ที่อัปเดต:
Pulse Wave Momentum
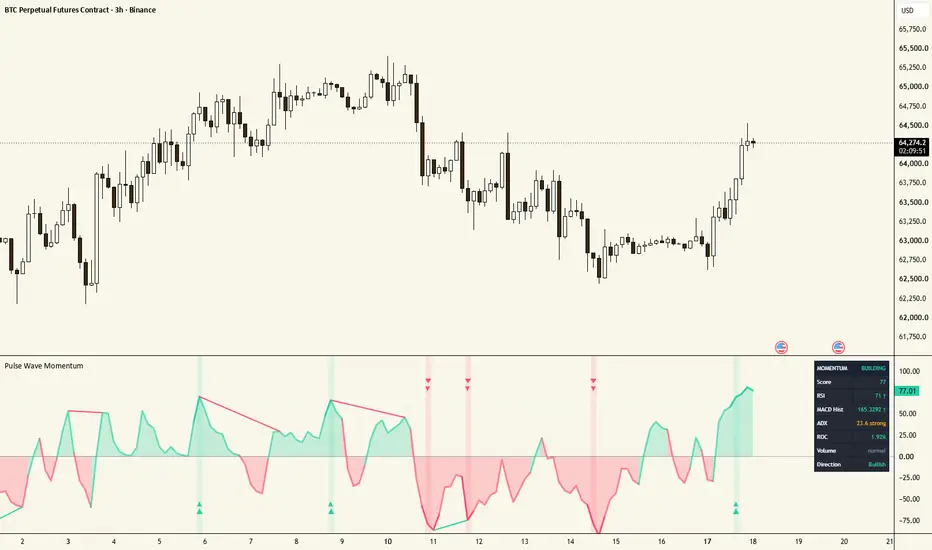
Pulse Wave Momentum (PWM)
A momentum indicator that combines five signals — RSI, MACD, ADX, Rate of Change, and Volume — into one simple score from -100 to +100, so you can see when momentum is building or fading at a glance.
How It Works
Instead of watching RSI, MACD, ADX, and volume separately and trying to piece them together yourself, PWM does that work for you. Each indicator "votes" toward bullish or bearish momentum:
MACD histogram expansion (biggest weight) — is the move accelerating?
ADX/DMI — is there real trend strength and clear direction?
RSI — is it rising on the right side of 50?
Rate of Change — is price speeding up?
Volume — does the move have real participation behind it?
These votes are combined into one score, then smoothed to reduce noise. A high positive score means strong bullish momentum. A high negative score means strong bearish momentum. A score near zero means the signals disagree or the market is flat.
When the score crosses above your Building Threshold (default +60), you get a green triangle and background highlight — momentum is building. When it crosses below your Fading Threshold (default -60), you get a red triangle and highlight — momentum is fading.
How to Use It
Add it below your price chart. Check the dashboard in the top-right corner to see the overall score plus each individual component, so you always know what's driving the signal.
Use the green/red triangles as confirmation, not as a standalone entry trigger — pair them with your own support/resistance or price action analysis. Since momentum indicators lag price by nature, treat a "building" signal as confirmation that a move already has conviction, not a prediction of a move about to start.
You can set alerts for both building and fading signals so you don't have to watch the chart constantly.
Customizing It
All the lengths and thresholds are adjustable. For volatile markets like crypto or small-caps, tighten things up (shorter ROC, higher volume multiplier). For slower markets like large-cap stocks on daily charts, the defaults work well.
A momentum indicator that combines five signals — RSI, MACD, ADX, Rate of Change, and Volume — into one simple score from -100 to +100, so you can see when momentum is building or fading at a glance.
How It Works
Instead of watching RSI, MACD, ADX, and volume separately and trying to piece them together yourself, PWM does that work for you. Each indicator "votes" toward bullish or bearish momentum:
MACD histogram expansion (biggest weight) — is the move accelerating?
ADX/DMI — is there real trend strength and clear direction?
RSI — is it rising on the right side of 50?
Rate of Change — is price speeding up?
Volume — does the move have real participation behind it?
These votes are combined into one score, then smoothed to reduce noise. A high positive score means strong bullish momentum. A high negative score means strong bearish momentum. A score near zero means the signals disagree or the market is flat.
When the score crosses above your Building Threshold (default +60), you get a green triangle and background highlight — momentum is building. When it crosses below your Fading Threshold (default -60), you get a red triangle and highlight — momentum is fading.
How to Use It
Add it below your price chart. Check the dashboard in the top-right corner to see the overall score plus each individual component, so you always know what's driving the signal.
Use the green/red triangles as confirmation, not as a standalone entry trigger — pair them with your own support/resistance or price action analysis. Since momentum indicators lag price by nature, treat a "building" signal as confirmation that a move already has conviction, not a prediction of a move about to start.
You can set alerts for both building and fading signals so you don't have to watch the chart constantly.
Customizing It
All the lengths and thresholds are adjustable. For volatile markets like crypto or small-caps, tighten things up (shorter ROC, higher volume multiplier). For slower markets like large-cap stocks on daily charts, the defaults work well.
Release Note
Recent updates:Added automatic bullish/bearish divergence detection, with lines drawn directly on the oscillator
Dashboard is now fully repositionable to any corner of the chart
Added Compact Mode for a cleaner, smaller footprint on mobile
Added a clean white-theme option for the dashboard

คำจำกัดสิทธิ์ความรับผิดชอบ
ข้อมูลและบทความไม่ได้มีวัตถุประสงค์เพื่อก่อให้เกิดกิจกรรมทางการเงิน, การลงทุน, การซื้อขาย, ข้อเสนอแนะ หรือคำแนะนำประเภทอื่น ๆ ที่ให้หรือรับรองโดย TradingView อ่านเพิ่มเติมใน ข้อกำหนดการใช้งาน
คำจำกัดสิทธิ์ความรับผิดชอบ
ข้อมูลและบทความไม่ได้มีวัตถุประสงค์เพื่อก่อให้เกิดกิจกรรมทางการเงิน, การลงทุน, การซื้อขาย, ข้อเสนอแนะ หรือคำแนะนำประเภทอื่น ๆ ที่ให้หรือรับรองโดย TradingView อ่านเพิ่มเติมใน ข้อกำหนดการใช้งาน