J - 200sma Band Tracker
(2022)
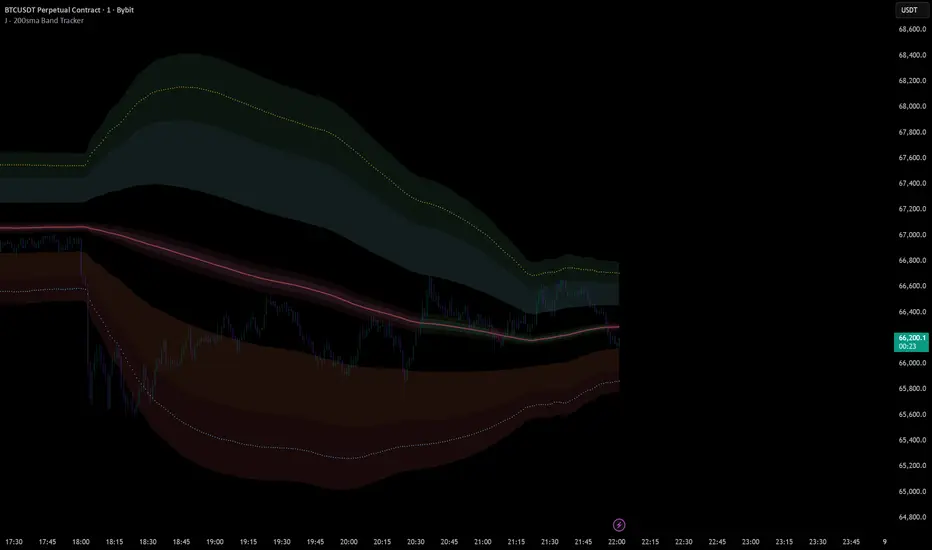
A Bollinger Band-based overlay that tracks price equilibrium using a 200 SMA as its core.
It layers multiple standard deviation bands (1–3σ) to highlight overbought/oversold zones, a narrow band to show tight consolidation, and an inner band to visualize micro price positioning.
A Bollinger Band-based overlay that tracks price equilibrium using a 200 SMA as its core.
It layers multiple standard deviation bands (1–3σ) to highlight overbought/oversold zones, a narrow band to show tight consolidation, and an inner band to visualize micro price positioning.

No courses, don't sell signals — just my own edge, stats public: jalgo.ca/
คำจำกัดสิทธิ์ความรับผิดชอบ
ข้อมูลและบทความไม่ได้มีวัตถุประสงค์เพื่อก่อให้เกิดกิจกรรมทางการเงิน, การลงทุน, การซื้อขาย, ข้อเสนอแนะ หรือคำแนะนำประเภทอื่น ๆ ที่ให้หรือรับรองโดย TradingView อ่านเพิ่มเติมใน ข้อกำหนดการใช้งาน
คำจำกัดสิทธิ์ความรับผิดชอบ
ข้อมูลและบทความไม่ได้มีวัตถุประสงค์เพื่อก่อให้เกิดกิจกรรมทางการเงิน, การลงทุน, การซื้อขาย, ข้อเสนอแนะ หรือคำแนะนำประเภทอื่น ๆ ที่ให้หรือรับรองโดย TradingView อ่านเพิ่มเติมใน ข้อกำหนดการใช้งาน