OPEN-SOURCE SCRIPT
[ A L P H A X ] Structure Edge
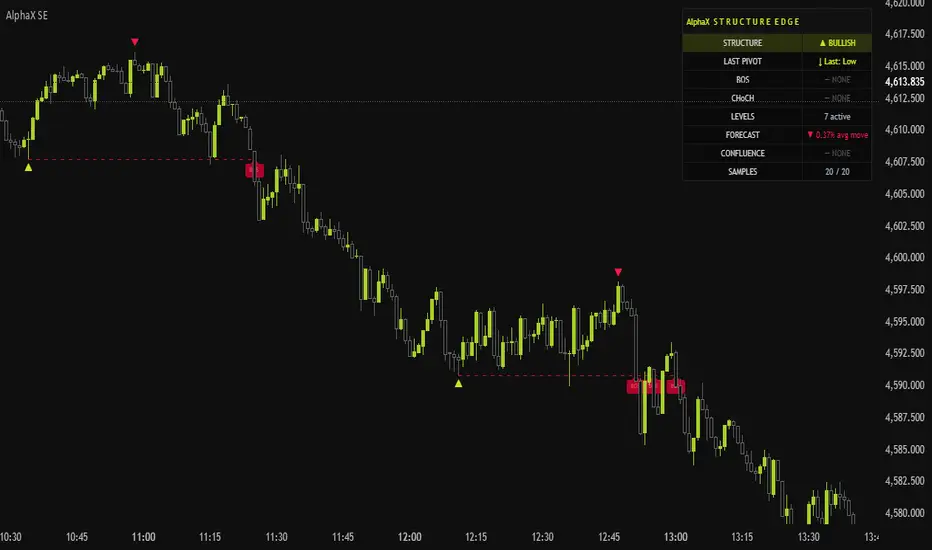
AlphaX Structure Edge — Swing Structure Detection, BOS, CHoCH, Structure Levels, Premium/Discount Zones, Swing Forecast & Fibonacci Extensions
AlphaX Structure Edge is a professional-grade Smart Money Concepts indicator that maps the complete picture of market structure directly on your chart. It detects confirmed swing pivots, identifies Break of Structure and Change of Character events in real time, draws adaptive structure levels with touch-count strength scoring, visualizes the Premium and Discount range between the last major swing high and low, and projects the next probable swing target using a statistical forecast engine built from your instrument's own historical swing behavior. Every element works together as a single unified system — from the first confirmed pivot to the forecast target and its Fibonacci extensions.
━━━━━━━━━━━━━━━━━━━━━━━━━━━━━━━━━━━━━━━━
📸 Visual Overview

AlphaX Structure Edge on XAUUSD — swing pivot markers, BOS and CHoCH labels, structure level lines with pill labels, Premium/Discount/EQ band, forecast corridor with step markers, target zone, and Fibonacci extensions
━━━━━━━━━━━━━━━━━━━━━━━━━━━━━━━━━━━━━━━━
🔬 Swing Pivot Detection
The foundation of Structure Edge is a robust pivot detection engine built on ta.pivothigh and ta.pivotlow — Pine's native confirmed pivot functions. A pivot is only confirmed once the required number of bars on both sides have closed without making a new extreme, meaning every pivot you see on the chart is structurally confirmed and non-repainting.
The Swing Length setting controls how many bars on each side are required to confirm a pivot. Larger values produce fewer but stronger, more institutionally significant pivots. Smaller values are more sensitive and catch minor structure swings.
Every confirmed swing high is marked with a small red triangle above the bar. Every confirmed swing low is marked with a small green triangle below the bar. These markers appear at the actual pivot bar, offset by the confirmation delay, and give you a clean visual map of the market's structural sequence at a glance.
━━━━━━━━━━━━━━━━━━━━━━━━━━━━━━━━━━━━━━━━
📈 Break of Structure (BOS) and Change of Character (CHoCH)
Market structure is defined by the sequence of highs and lows price is printing. AlphaX Structure Edge tracks this sequence in real time and identifies two critical structural events:
Break of Structure (BOS)
A BOS occurs when price closes beyond the last confirmed swing level in the direction of the current trend — confirming that the trend is continuing. A bullish BOS means price closed above the last confirmed swing high, extending the bullish structure. A bearish BOS means price closed below the last confirmed swing low, extending the bearish structure.
BOS events are marked with a dashed horizontal line drawn from the broken swing level to the close bar, and a compact BOS label. Bull BOS uses green tones. Bear BOS uses red tones. BOS signals that the prevailing trend remains intact and confirms continuation.
Change of Character (CHoCH)
A CHoCH occurs when price closes beyond the last confirmed swing level in the opposite direction of the current trend — the first sign that market character is changing. If the trend has been bullish and price closes below the last confirmed swing low, the structure is printing a CHoCH. If the trend has been bearish and price closes above the last confirmed swing high, the same event occurs in the bullish direction.
CHoCH events are marked with a solid line and a prominent CHoCH ▲ or CHoCH ▼ label. CHoCH is not a confirmed reversal — it is the earliest available warning that the current trend may be ending and new structure is forming. The distinction between BOS and CHoCH is critical:
Both events are confirmed on bar close only — no repainting.
━━━━━━━━━━━━━━━━━━━━━━━━━━━━━━━━━━━━━━━━
📊 Structure Levels with Touch-Count Strength Scoring
Every confirmed swing pivot creates a Structure Level — a horizontal line drawn from the pivot bar forward in time with a right-side pill label showing the exact price and touch count.
Structure levels are not static zones. AlphaX Structure Edge manages every level dynamically bar by bar:
Touch counting: When price enters the level's sensitivity band without closing through it, the touch counter increments. Levels that have been tested two or more times display a ×N badge on their pill label — showing exactly how many times the market has respected that level. When the Highlight Tested Levels option is enabled, multi-touch levels are rendered with a stronger, more opaque line — making the most significant levels immediately visible without reading the labels.
Age fading: Unbroken levels gradually fade in opacity as they age relative to the Max Level Age setting. Fresh levels are more prominent; old untested levels fade toward transparency. This keeps the chart focused on recently relevant structure without manually cleaning up old levels.
Break detection: When price closes beyond a level by more than the sensitivity threshold, the level is considered broken. Its line switches to a dotted style and fades to a low-opacity color — remaining visible as a reference point for prior structure without competing for attention with active levels.
Auto-removal: Broken levels are removed 30 bars after breaking. Unbroken levels older than the Max Level Age setting are removed automatically.
Structure levels with pill labels — multi-touch levels show ×N badge and are rendered with stronger color
━━━━━━━━━━━━━━━━━━━━━━━━━━━━━━━━━━━━━━━━
🎯 Premium / Discount / Equilibrium Band
Between the last confirmed swing high and swing low lies the institutional trading range. AlphaX Structure Edge visualizes this range as a unified band divided into three zones:
The band updates dynamically on every bar using the most recent confirmed swing high and low — it always reflects the current structural context, not a fixed historical range.
How to use the Premium/Discount band:
━━━━━━━━━━━━━━━━━━━━━━━━━━━━━━━━━━━━━━━━
🔮 Swing Forecast Engine
AlphaX Structure Edge contains a statistical forecast engine that projects the next probable swing target based on your instrument's own historical swing behavior — not a fixed percentage or ATR multiple.
How the forecast is calculated:
Every time a swing direction change occurs, the engine records the size of the completed swing as a percentage move and its duration in bars. These values accumulate over the last N swings (controlled by the History Samples setting). When the last bar is reached, the engine aggregates these historical swings using your chosen method and projects the next swing from the current pivot:
The standard deviation across all recorded swings determines the uncertainty band — how wide the forecast corridor is. A narrow corridor means your instrument moves consistently. A wide corridor means swing sizes vary significantly and the target should be treated with lower confidence.
Forecast visuals:
━━━━━━━━━━━━━━━━━━━━━━━━━━━━━━━━━━━━━━━━
📐 Fibonacci Extensions with Structure Confluence Highlighting
Beyond the forecast target, AlphaX Structure Edge draws up to five Fibonacci extension levels projected from the current swing origin. Five levels are available with independently toggleable and configurable ratios:
All five levels are fully customizable — you can change the ratio values to any number you prefer, not just the classic Fibonacci sequence.
Structure confluence highlighting: When a Fibonacci level falls within the sensitivity band of an existing active structure level, that fib line is rendered with a thicker width and stronger color, and a ⬡ badge appears on its label. Fib levels that coincide with prior structure are meaningfully stronger targets than those in open price space — the highlighting makes these confluences immediately visible without manual comparison.
Fibonacci extensions beyond the forecast target — ⬡ badges highlighting levels that overlap with active structure levels
━━━━━━━━━━━━━━━━━━━━━━━━━━━━━━━━━━━━━━━━
📋 Live Dashboard
The dashboard gives a real-time text summary of every structural condition in a compact panel:
━━━━━━━━━━━━━━━━━━━━━━━━━━━━━━━━━━━━━━━━
⚡ Key Features
━━━━━━━━━━━━━━━━━━━━━━━━━━━━━━━━━━━━━━━━
⚙ Settings Reference
Detection
Market Structure
Structure Levels
Swing Forecast
Dashboard
━━━━━━━━━━━━━━━━━━━━━━━━━━━━━━━━━━━━━━━━
🚀 How to Trade with AlphaX Structure Edge — Step by Step
Step 1 — Establish the structural bias
Step 2 — Identify your entry zone
Step 3 — Confirm the entry with structure signals
Step 4 — Use the forecast target for your take profit
Step 5 — Manage with structural signals
━━━━━━━━━━━━━━━━━━━━━━━━━━━━━━━━━━━━━━━━
🔔 Alert Conditions
All alert messages include {{ticker}} and {{interval}} for webhook integration.
━━━━━━━━━━━━━━━━━━━━━━━━━━━━━━━━━━━━━━━━
👥 Who This Is For
━━━━━━━━━━━━━━━━━━━━━━━━━━━━━━━━━━━━━━━━
📝 Notes
━━━━━━━━━━━━━━━━━━━━━━━━━━━━━━━━━━━━━━━━
⚠ Disclaimer
This indicator is a technical analysis and visualization tool intended for educational and informational purposes only. It does not constitute financial advice or a recommendation to buy or sell any financial instrument. All signals are generated from historical and real-time price data using mathematical calculations — their accuracy or profitability is not guaranteed. Past performance does not guarantee future results. Always conduct your own analysis, use proper risk management, and consult a licensed financial advisor before making any trading decisions. The author accepts no responsibility for any losses incurred from the use of this indicator.
━━━━━━━━━━━━━━━━━━━━━━━━━━━━━━━━━━━━━━━━
Built for traders who read price through the lens of structure — where every swing tells a story and every break means something.
AlphaX Structure Edge is a professional-grade Smart Money Concepts indicator that maps the complete picture of market structure directly on your chart. It detects confirmed swing pivots, identifies Break of Structure and Change of Character events in real time, draws adaptive structure levels with touch-count strength scoring, visualizes the Premium and Discount range between the last major swing high and low, and projects the next probable swing target using a statistical forecast engine built from your instrument's own historical swing behavior. Every element works together as a single unified system — from the first confirmed pivot to the forecast target and its Fibonacci extensions.
━━━━━━━━━━━━━━━━━━━━━━━━━━━━━━━━━━━━━━━━
📸 Visual Overview
AlphaX Structure Edge on XAUUSD — swing pivot markers, BOS and CHoCH labels, structure level lines with pill labels, Premium/Discount/EQ band, forecast corridor with step markers, target zone, and Fibonacci extensions
━━━━━━━━━━━━━━━━━━━━━━━━━━━━━━━━━━━━━━━━
🔬 Swing Pivot Detection
The foundation of Structure Edge is a robust pivot detection engine built on ta.pivothigh and ta.pivotlow — Pine's native confirmed pivot functions. A pivot is only confirmed once the required number of bars on both sides have closed without making a new extreme, meaning every pivot you see on the chart is structurally confirmed and non-repainting.
The Swing Length setting controls how many bars on each side are required to confirm a pivot. Larger values produce fewer but stronger, more institutionally significant pivots. Smaller values are more sensitive and catch minor structure swings.
Every confirmed swing high is marked with a small red triangle above the bar. Every confirmed swing low is marked with a small green triangle below the bar. These markers appear at the actual pivot bar, offset by the confirmation delay, and give you a clean visual map of the market's structural sequence at a glance.
━━━━━━━━━━━━━━━━━━━━━━━━━━━━━━━━━━━━━━━━
📈 Break of Structure (BOS) and Change of Character (CHoCH)
Market structure is defined by the sequence of highs and lows price is printing. AlphaX Structure Edge tracks this sequence in real time and identifies two critical structural events:
Break of Structure (BOS)
A BOS occurs when price closes beyond the last confirmed swing level in the direction of the current trend — confirming that the trend is continuing. A bullish BOS means price closed above the last confirmed swing high, extending the bullish structure. A bearish BOS means price closed below the last confirmed swing low, extending the bearish structure.
BOS events are marked with a dashed horizontal line drawn from the broken swing level to the close bar, and a compact BOS label. Bull BOS uses green tones. Bear BOS uses red tones. BOS signals that the prevailing trend remains intact and confirms continuation.
Change of Character (CHoCH)
A CHoCH occurs when price closes beyond the last confirmed swing level in the opposite direction of the current trend — the first sign that market character is changing. If the trend has been bullish and price closes below the last confirmed swing low, the structure is printing a CHoCH. If the trend has been bearish and price closes above the last confirmed swing high, the same event occurs in the bullish direction.
CHoCH events are marked with a solid line and a prominent CHoCH ▲ or CHoCH ▼ label. CHoCH is not a confirmed reversal — it is the earliest available warning that the current trend may be ending and new structure is forming. The distinction between BOS and CHoCH is critical:
- A BOS in the direction of the trend → trend continuation. Stay aligned with the bias.
- A CHoCH against the trend → character is changing. Be alert for reversal setups forming.
- A CHoCH followed by a BOS in the new direction → structural reversal confirmed.
Both events are confirmed on bar close only — no repainting.
━━━━━━━━━━━━━━━━━━━━━━━━━━━━━━━━━━━━━━━━
📊 Structure Levels with Touch-Count Strength Scoring
Every confirmed swing pivot creates a Structure Level — a horizontal line drawn from the pivot bar forward in time with a right-side pill label showing the exact price and touch count.
Structure levels are not static zones. AlphaX Structure Edge manages every level dynamically bar by bar:
Touch counting: When price enters the level's sensitivity band without closing through it, the touch counter increments. Levels that have been tested two or more times display a ×N badge on their pill label — showing exactly how many times the market has respected that level. When the Highlight Tested Levels option is enabled, multi-touch levels are rendered with a stronger, more opaque line — making the most significant levels immediately visible without reading the labels.
Age fading: Unbroken levels gradually fade in opacity as they age relative to the Max Level Age setting. Fresh levels are more prominent; old untested levels fade toward transparency. This keeps the chart focused on recently relevant structure without manually cleaning up old levels.
Break detection: When price closes beyond a level by more than the sensitivity threshold, the level is considered broken. Its line switches to a dotted style and fades to a low-opacity color — remaining visible as a reference point for prior structure without competing for attention with active levels.
Auto-removal: Broken levels are removed 30 bars after breaking. Unbroken levels older than the Max Level Age setting are removed automatically.
Structure levels with pill labels — multi-touch levels show ×N badge and are rendered with stronger color
━━━━━━━━━━━━━━━━━━━━━━━━━━━━━━━━━━━━━━━━
🎯 Premium / Discount / Equilibrium Band
Between the last confirmed swing high and swing low lies the institutional trading range. AlphaX Structure Edge visualizes this range as a unified band divided into three zones:
- PREM (Premium) — the upper half of the range. Price is trading above the midpoint, meaning it is relatively expensive compared to the recent range. Smart money institutions are more likely to be distributing (selling) in this zone.
- DISC (Discount) — the lower half of the range. Price is below the midpoint and relatively cheap. Smart money institutions are more likely to be accumulating (buying) in this zone.
- EQ (Equilibrium) — the exact midpoint of the range, marked with a dotted line. This is the fair value level of the current swing range. Price often finds temporary resistance or support at this level before continuing to one extreme or the other.
The band updates dynamically on every bar using the most recent confirmed swing high and low — it always reflects the current structural context, not a fixed historical range.
How to use the Premium/Discount band:
- In a bullish structure (after a BOS up), look for long entries from the Discount zone. Price pulling back into Discount during an uptrend is a Smart Money accumulation opportunity.
- In a bearish structure (after a BOS down), look for short entries from the Premium zone. Price rallying into Premium during a downtrend is a distribution opportunity.
- EQ acts as a decision point — price reacting from EQ suggests conviction in the current direction. Price grinding through EQ without reaction suggests the move has momentum behind it.
━━━━━━━━━━━━━━━━━━━━━━━━━━━━━━━━━━━━━━━━
🔮 Swing Forecast Engine
AlphaX Structure Edge contains a statistical forecast engine that projects the next probable swing target based on your instrument's own historical swing behavior — not a fixed percentage or ATR multiple.
How the forecast is calculated:
Every time a swing direction change occurs, the engine records the size of the completed swing as a percentage move and its duration in bars. These values accumulate over the last N swings (controlled by the History Samples setting). When the last bar is reached, the engine aggregates these historical swings using your chosen method and projects the next swing from the current pivot:
- Weighted — the most recent swings carry more weight than older ones. Best for instruments where recent behavior is more predictive than distant history.
- Average — all samples are weighted equally. More stable and resistant to individual outliers.
- Median — uses the middle value of all recorded swings, ignoring extremes entirely. Best when your instrument occasionally prints unusually large or small swings that skew the average.
The standard deviation across all recorded swings determines the uncertainty band — how wide the forecast corridor is. A narrow corridor means your instrument moves consistently. A wide corridor means swing sizes vary significantly and the target should be treated with lower confidence.
Forecast visuals:
- Forecast Corridor — a semi-transparent box from the current pivot to the projected target area, sized by the uncertainty band. Bull forecasts use green tones. Bear forecasts use red tones.
- Center Trajectory — a dashed line from the current pivot price to the projected target, showing the expected path of the move.
- Step Markers — three small horizontal tick marks along the trajectory at evenly spaced intervals, creating a visual stepping path feel along the projected route.
- Target Zone — a tighter box at the end of the corridor showing the exact projected target level and the projected percentage move. When the target overlaps with an existing structure level, the target box changes color to match the level and displays a ⬡ confluence badge — highlighting a higher-probability target.
━━━━━━━━━━━━━━━━━━━━━━━━━━━━━━━━━━━━━━━━
📐 Fibonacci Extensions with Structure Confluence Highlighting
Beyond the forecast target, AlphaX Structure Edge draws up to five Fibonacci extension levels projected from the current swing origin. Five levels are available with independently toggleable and configurable ratios:
- Level 1 — 1.000 (100% of the projected move, the base target)
- Level 2 — 1.272 (127.2%)
- Level 3 — 1.618 (161.8%)
- Level 4 — 2.000 (200%, disabled by default)
- Level 5 — 2.618 (261.8%, disabled by default)
All five levels are fully customizable — you can change the ratio values to any number you prefer, not just the classic Fibonacci sequence.
Structure confluence highlighting: When a Fibonacci level falls within the sensitivity band of an existing active structure level, that fib line is rendered with a thicker width and stronger color, and a ⬡ badge appears on its label. Fib levels that coincide with prior structure are meaningfully stronger targets than those in open price space — the highlighting makes these confluences immediately visible without manual comparison.
Fibonacci extensions beyond the forecast target — ⬡ badges highlighting levels that overlap with active structure levels
━━━━━━━━━━━━━━━━━━━━━━━━━━━━━━━━━━━━━━━━
📋 Live Dashboard
The dashboard gives a real-time text summary of every structural condition in a compact panel:
- STRUCTURE — current structure trend: ▲ BULLISH, ▼ BEARISH, or — UNDEFINED. Highlighted in the corresponding color when a clear bias is active.
- LAST PIVOT — whether the most recently confirmed pivot was a high or low.
- BOS — whether a BOS occurred on the current bar and in which direction. Highlighted when active.
- CHoCH — whether a CHoCH occurred on the current bar and in which direction. Highlighted when active.
- LEVELS — count of active unbroken structure levels currently on the chart.
- FORECAST — the projected direction and average percentage move based on current swing history.
- CONFLUENCE — shows ⬡ YES — HIGH PROB when the forecast target overlaps with an active structure level. This is one of the most important rows — a forecast target with structure confluence is a significantly higher-probability setup.
- SAMPLES — how many swing samples have been loaded versus the configured maximum.
━━━━━━━━━━━━━━━━━━━━━━━━━━━━━━━━━━━━━━━━
⚡ Key Features
- 🔬 Robust swing pivot detection using ta.pivothigh / ta.pivotlow — non-repainting, confirmed on bar close
- 📈 BOS detection — dashed line and label at the broken swing level, directional color coded
- ⚠ CHoCH detection — solid line and label at the first counter-trend structural break, the earliest reversal warning
- 📊 Structure levels with touch counting — lines + pill labels, multi-touch levels highlighted with ×N badge and stronger color
- 🎯 Premium / Discount / EQ band — institutional range visualization updating dynamically from the current swing high and low
- 🔮 Statistical swing forecast — projects next target from historical swing % data using Weighted, Average, or Median aggregation
- 📐 Forecast uncertainty corridor — width driven by standard deviation of historical swings, narrower when price moves consistently
- ⬡ Target confluence detection — forecast target and fib levels highlighted when they overlap with active structure levels
- 📏 Five configurable Fibonacci extension levels — all ratios adjustable, individually toggleable
- 📋 Live 8-row dashboard — structure trend, last pivot, BOS, CHoCH, level count, forecast, confluence, sample count
- 🔔 8 alert conditions — swing high/low confirmed, bull/bear BOS, bull/bear CHoCH, any BOS, any CHoCH
- ✅ Zero repainting — all signals confirmed on bar close
- 🎨 Full AlphaX visual theme — yellow-green for bullish, red for bearish, dark background dashboard, consistent throughout
━━━━━━━━━━━━━━━━━━━━━━━━━━━━━━━━━━━━━━━━
⚙ Settings Reference
Detection
- Swing Length — bars required on each side to confirm a pivot (default: 16)
Market Structure
- Show BOS — toggle BOS lines and labels
- Show CHoCH — toggle CHoCH lines and labels
- Show Premium / Discount / EQ Band — toggle the institutional range visualization
Structure Levels
- Show Structure Levels — toggle all level lines and pill labels
- Level Sensitivity (ATR×) — controls the touch detection band and break threshold, scaled to ATR(200)
- Max Level Age (bars) — how long an unbroken level remains before automatic removal
- Highlight Tested Levels — render multi-touch levels with stronger color and show ×N badge
Swing Forecast
- History Samples — number of recent swing legs used for the projection calculation (default: 20)
- Calculation — aggregation method: Weighted (recent swings count more), Average (equal weight), Median (ignores outliers)
- Projection Width — how many bars to the right the corridor and target are drawn
- Show Forecast Corridor — toggle the corridor box and center trajectory
- Show Target Zone — toggle the target box and percentage label
- Show Fib Extensions — toggle Fibonacci extension lines and labels
- Level 1–5 — independently enable/disable each Fib level and set its ratio
Dashboard
- Show Dashboard — toggle the dashboard panel
- Position — Top Right, Top Left, Bottom Right, Bottom Left
━━━━━━━━━━━━━━━━━━━━━━━━━━━━━━━━━━━━━━━━
🚀 How to Trade with AlphaX Structure Edge — Step by Step
Step 1 — Establish the structural bias
- Check the STRUCTURE row on the dashboard — is it ▲ BULLISH or ▼ BEARISH?
- A confirmed BOS in the bullish direction with a sequence of higher highs and higher lows = bullish structure. Only look for long setups.
- A confirmed BOS in the bearish direction with lower highs and lower lows = bearish structure. Only look for short setups.
- If a CHoCH just printed, the structure is transitioning. Wait for a BOS in the new direction before committing to the new bias.
Step 2 — Identify your entry zone
- In bullish structure, price should be pulling back. Look for the pullback to enter the Discount zone below EQ. This is where smart money accumulates.
- In bearish structure, price should be rallying back. Look for the rally to enter the Premium zone above EQ. This is where smart money distributes.
- Check whether an active structure level sits inside the Discount or Premium zone — a level that has been tested multiple times (×N badge) inside the Discount during an uptrend is a high-confluence long entry zone.
Step 3 — Confirm the entry with structure signals
- Wait for price to reach your identified zone — Discount during uptrends, Premium during downtrends.
- Look for a BOS in the trend direction after the pullback. A new BOS confirming the trend is resuming from Discount (bull) or Premium (bear) is your entry trigger.
- If you see a CHoCH appear at the zone — price briefly broke the swing level against the trend but then reversed — this is a classic liquidity sweep. If price then resumes in the trend direction with a new BOS, this is a high-probability entry.
Step 4 — Use the forecast target for your take profit
- Check the forecast corridor — where is the projected target? This is your primary TP reference.
- If the CONFLUENCE row shows ⬡ YES — HIGH PROB, the forecast target coincides with an active structure level. This level is likely to act as resistance (in a bull move) or support (in a bear move). Consider taking full or partial profit at the target zone.
- Use the Fibonacci extension levels for secondary targets. The 1.272 and 1.618 levels are particularly significant. Any Fib level with a ⬡ badge overlapping a structure level is a priority target.
Step 5 — Manage with structural signals
- If a CHoCH prints against your open trade, the structure is warning you. Tighten your stop or reduce position size.
- If a BOS prints in your trade direction during the move, the structure is extending — the forecast target may be exceeded. Consider trailing your stop to the most recent BOS level.
- If price reaches the forecast target zone but fails to break through, and a CHoCH appears, the move may be complete. Close the trade.
━━━━━━━━━━━━━━━━━━━━━━━━━━━━━━━━━━━━━━━━
🔔 Alert Conditions
- Swing High Confirmed — new swing high confirmed after full bar-close validation
- Swing Low Confirmed — new swing low confirmed after full bar-close validation
- Bull BOS — price closed above the last confirmed swing high in a bullish continuation
- Bear BOS — price closed below the last confirmed swing low in a bearish continuation
- Bull CHoCH — price closed above the last swing high against a bearish structure — potential reversal up
- Bear CHoCH — price closed below the last swing low against a bullish structure — potential reversal down
- Any BOS — fires on any BOS event regardless of direction
- Any CHoCH — fires on any CHoCH event regardless of direction
All alert messages include {{ticker}} and {{interval}} for webhook integration.
━━━━━━━━━━━━━━━━━━━━━━━━━━━━━━━━━━━━━━━━
👥 Who This Is For
- 🥇 Smart Money Concepts traders — built specifically around the SMC framework of BOS, CHoCH, structure levels, Premium/Discount, and institutional swing targets
- 📉 Forex and Gold traders — works across all liquid instruments where swing structure drives price behavior
- 📊 Swing traders and intraday traders — the forecast engine adapts to both short and longer timeframe swing behavior automatically
- 🧠 Systematic traders — BOS and CHoCH provide objective, non-discretionary structural signals with zero repainting
- 📈 Traders who want one complete structure tool — pivots, BOS, CHoCH, levels, Premium/Discount, forecast, and Fibs in a single indicator
- 🔔 Alert-driven traders — 8 alert conditions with clean webhook-ready messages for every structural event
━━━━━━━━━━━━━━━━━━━━━━━━━━━━━━━━━━━━━━━━
📝 Notes
- All pivot detections and BOS/CHoCH signals are confirmed on bar close — this indicator does not repaint. Signals visible on historical bars will not change or disappear.
- The forecast engine requires a minimum of 2 completed swing samples before it begins projecting. The SAMPLES row on the dashboard shows how many have loaded. The more samples loaded, the more statistically stable the forecast becomes.
- Increasing the Swing Length reduces the frequency of pivots and structural signals but increases their significance — each event represents a larger, more meaningful market structure event. Decreasing it produces more frequent signals on smaller structural moves.
- The Level Sensitivity (ATR×) setting controls both the touch detection radius and the break threshold simultaneously. Increasing it creates a wider zone around each level — more touches are registered and a larger close is needed to break it. Decreasing it is more precise but may register fewer touches on fast-moving instruments.
- The forecast target is a statistical projection based on historical average swing behavior — not a guarantee. It represents the most probable outcome given recent history. Always use proper risk management and do not treat the forecast target as a certain price destination.
━━━━━━━━━━━━━━━━━━━━━━━━━━━━━━━━━━━━━━━━
⚠ Disclaimer
This indicator is a technical analysis and visualization tool intended for educational and informational purposes only. It does not constitute financial advice or a recommendation to buy or sell any financial instrument. All signals are generated from historical and real-time price data using mathematical calculations — their accuracy or profitability is not guaranteed. Past performance does not guarantee future results. Always conduct your own analysis, use proper risk management, and consult a licensed financial advisor before making any trading decisions. The author accepts no responsibility for any losses incurred from the use of this indicator.
━━━━━━━━━━━━━━━━━━━━━━━━━━━━━━━━━━━━━━━━
Built for traders who read price through the lens of structure — where every swing tells a story and every break means something.
สคริปต์โอเพนซอร์ซ
ด้วยเจตนารมณ์หลักของ TradingView ผู้สร้างสคริปต์นี้ได้ทำให้เป็นโอเพนซอร์ส เพื่อให้เทรดเดอร์สามารถตรวจสอบและยืนยันฟังก์ชันการทำงานของมันได้ ขอชื่นชมผู้เขียน! แม้ว่าคุณจะใช้งานได้ฟรี แต่โปรดจำไว้ว่าการเผยแพร่โค้ดซ้ำจะต้องเป็นไปตาม กฎระเบียบการใช้งาน ของเรา

🌐 alphax.trading
Institutional Grade Signals --> Engineered for Retail
💎ᴠɪᴘ tradingview.com/v/TaXohZvb/
[ A L P H A X ] PRIME - Premium Signal Engine
🔢 alphax.trading/resources/calculators
AlphaX Calculators
Institutional Grade Signals --> Engineered for Retail
💎ᴠɪᴘ tradingview.com/v/TaXohZvb/
[ A L P H A X ] PRIME - Premium Signal Engine
🔢 alphax.trading/resources/calculators
AlphaX Calculators
คำจำกัดสิทธิ์ความรับผิดชอบ
ข้อมูลและบทความไม่ได้มีวัตถุประสงค์เพื่อก่อให้เกิดกิจกรรมทางการเงิน, การลงทุน, การซื้อขาย, ข้อเสนอแนะ หรือคำแนะนำประเภทอื่น ๆ ที่ให้หรือรับรองโดย TradingView อ่านเพิ่มเติมใน ข้อกำหนดการใช้งาน
สคริปต์โอเพนซอร์ซ
ด้วยเจตนารมณ์หลักของ TradingView ผู้สร้างสคริปต์นี้ได้ทำให้เป็นโอเพนซอร์ส เพื่อให้เทรดเดอร์สามารถตรวจสอบและยืนยันฟังก์ชันการทำงานของมันได้ ขอชื่นชมผู้เขียน! แม้ว่าคุณจะใช้งานได้ฟรี แต่โปรดจำไว้ว่าการเผยแพร่โค้ดซ้ำจะต้องเป็นไปตาม กฎระเบียบการใช้งาน ของเรา
🌐 alphax.trading
Institutional Grade Signals --> Engineered for Retail
💎ᴠɪᴘ tradingview.com/v/TaXohZvb/
[ A L P H A X ] PRIME - Premium Signal Engine
🔢 alphax.trading/resources/calculators
AlphaX Calculators
Institutional Grade Signals --> Engineered for Retail
💎ᴠɪᴘ tradingview.com/v/TaXohZvb/
[ A L P H A X ] PRIME - Premium Signal Engine
🔢 alphax.trading/resources/calculators
AlphaX Calculators
คำจำกัดสิทธิ์ความรับผิดชอบ
ข้อมูลและบทความไม่ได้มีวัตถุประสงค์เพื่อก่อให้เกิดกิจกรรมทางการเงิน, การลงทุน, การซื้อขาย, ข้อเสนอแนะ หรือคำแนะนำประเภทอื่น ๆ ที่ให้หรือรับรองโดย TradingView อ่านเพิ่มเติมใน ข้อกำหนดการใช้งาน