High-Probability Key Levels & Clean Price Action
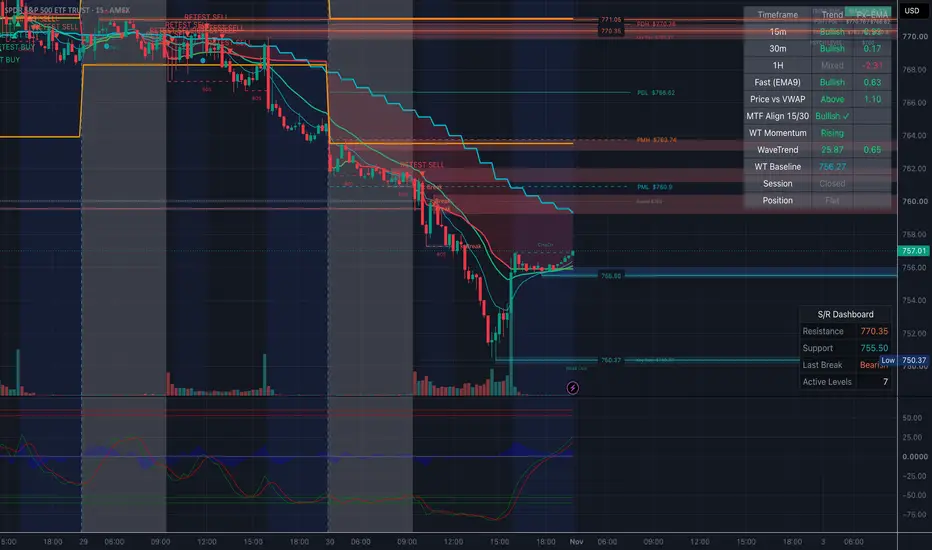
Core Philosophy
Most trading indicators fail because they clutter the screen with dozens of lagging lines, giant billboard text, and infinite lasers that squish your candlesticks.
This indicator is built on institutional order flow principles: it strips away noise and focuses exclusively on where smart money enters, stops are placed, and liquidity rests.
The 4 Pillars of the Indicator
┌───────────────────────────────────────────────────────────────┐
│ 1. DAILY & PRE-MARKET LEVELS (PDH, PDL, PMH, PML) │
│ 2. SWING S/R & PSYCHOLOGICAL ROUND NUMBERS │
│ 3. MOMENTUM BASELINE (9 & 21 EMAs) │
│ 4. HIGH-PROBABILITY SIGNALS (Breakout-Retests & Filtered) │
└───────────────────────────────────────────────────────────────┘
1. Daily & Pre-Market Key Levels (The Liquidity Anchors)
Institutions use prior day extremes and pre-market ranges to gauge market direction:
PDH (Previous Day High - Solid Red): Major overhead supply/resistance.
PDL (Previous Day Low - Solid Green): Major support and downside liquidity target.
PMH (Pre-Market High - Dashed Orange): Defines the morning opening breakout ceiling.
PML (Pre-Market Low - Dashed Cyan): Defines the morning opening breakdown floor.
Clean Execution: These lines are session-bounded—they only draw forward from today's open with clean right-edge price tags, keeping past candles 100% visible.
2. Support / Resistance & Psychological Pivots
Swing S/R Levels: Clean, dotted horizontal lines marking the most recent significant swing high and swing low.
Psychological Round Numbers: Auto-detects the single nearest whole number based on price magnitude (e.g., $750, $760, $770) where retail stop-loss and limit orders cluster.
3. Trend Baseline (Clean 9 & 21 EMAs)
9 EMA (Cyan - Fast Momentum): Shows intraday momentum direction.
21 EMA (Green - Trend Guide): Acts as the dynamic trailing trend baseline.
When 9 > 21, intraday bias is Bullish. When 9 < 21, bias is Bearish.
4. High-Probability Setups (Zero Chop)
Instead of firing constant low-quality signals, the indicator only flags high-probability institutional setups:
Breakout & Retest (▲ RETEST BUY / ▼ RETEST SELL):
Bullish Retest: Price breaks above PDH or PMH
→
→ pulls back to touch and hold the level
→
→ closes green with 9 EMA >= 21 EMA.
Bearish Breakdown-Retest: Price breaks below PDL or PML
→
→ rallies back to touch and reject the level
→
→ closes red with 9 EMA <= 21 EMA.
Chop-Filtered EMA 9/21 Crosses (Discreet dots):
Crossovers that occur in the middle of nowhere (chop) are filtered out.
A dot only prints if the cross occurs near a key level (PDH/PDL, PMH/PML, Swing S/R, or a Psych Level) where genuine reversals happen.
Compact HUD Status Pill (Top-Right)
A clean, unobtrusive 2x4 telemetry badge in the corner displaying:
Trend Bias: BULLISH (9>21) in green or BEARISH (9<21) in red.
PDH / PDL: Exact dollar levels for the day.
PMH / PML: Live pre-market boundaries.
Psych Level: The nearest active round magnet level.
How to Trade With It (Institutional Playbook)
Setup Trigger Condition Execution
A. Morning Breakout-Retest Price breaks PMH or PDH at the open, pulls back to the line, and prints ▲ RETEST BUY. Enter Long. Stop loss just below the level. Target the next round psychological level.
B. Liquidity Sweep & Reversal Price pierces PDL, fails to stay below, and prints an EMA Bull Cross dot right at Key Support. Enter Long for a mean-reversion squeeze back up to the 21 EMA or VWAP.
C. Breakdown Continuation Price loses PML, retests from underneath, prints ▼ RETEST SELL. Enter Short. Stop loss just above the retested level.
Built-in Alerts
Includes 4 pre-configured alerts for push notifications, webhooks, or mobile alerts:
Breakout-Retest BUY
Breakdown-Retest SELL
EMA Bull Cross (Near Key Level)
EMA Bear Cross (Near Key Level)
Most trading indicators fail because they clutter the screen with dozens of lagging lines, giant billboard text, and infinite lasers that squish your candlesticks.
This indicator is built on institutional order flow principles: it strips away noise and focuses exclusively on where smart money enters, stops are placed, and liquidity rests.
The 4 Pillars of the Indicator
┌───────────────────────────────────────────────────────────────┐
│ 1. DAILY & PRE-MARKET LEVELS (PDH, PDL, PMH, PML) │
│ 2. SWING S/R & PSYCHOLOGICAL ROUND NUMBERS │
│ 3. MOMENTUM BASELINE (9 & 21 EMAs) │
│ 4. HIGH-PROBABILITY SIGNALS (Breakout-Retests & Filtered) │
└───────────────────────────────────────────────────────────────┘
1. Daily & Pre-Market Key Levels (The Liquidity Anchors)
Institutions use prior day extremes and pre-market ranges to gauge market direction:
PDH (Previous Day High - Solid Red): Major overhead supply/resistance.
PDL (Previous Day Low - Solid Green): Major support and downside liquidity target.
PMH (Pre-Market High - Dashed Orange): Defines the morning opening breakout ceiling.
PML (Pre-Market Low - Dashed Cyan): Defines the morning opening breakdown floor.
Clean Execution: These lines are session-bounded—they only draw forward from today's open with clean right-edge price tags, keeping past candles 100% visible.
2. Support / Resistance & Psychological Pivots
Swing S/R Levels: Clean, dotted horizontal lines marking the most recent significant swing high and swing low.
Psychological Round Numbers: Auto-detects the single nearest whole number based on price magnitude (e.g., $750, $760, $770) where retail stop-loss and limit orders cluster.
3. Trend Baseline (Clean 9 & 21 EMAs)
9 EMA (Cyan - Fast Momentum): Shows intraday momentum direction.
21 EMA (Green - Trend Guide): Acts as the dynamic trailing trend baseline.
When 9 > 21, intraday bias is Bullish. When 9 < 21, bias is Bearish.
4. High-Probability Setups (Zero Chop)
Instead of firing constant low-quality signals, the indicator only flags high-probability institutional setups:
Breakout & Retest (▲ RETEST BUY / ▼ RETEST SELL):
Bullish Retest: Price breaks above PDH or PMH
→
→ pulls back to touch and hold the level
→
→ closes green with 9 EMA >= 21 EMA.
Bearish Breakdown-Retest: Price breaks below PDL or PML
→
→ rallies back to touch and reject the level
→
→ closes red with 9 EMA <= 21 EMA.
Chop-Filtered EMA 9/21 Crosses (Discreet dots):
Crossovers that occur in the middle of nowhere (chop) are filtered out.
A dot only prints if the cross occurs near a key level (PDH/PDL, PMH/PML, Swing S/R, or a Psych Level) where genuine reversals happen.
Compact HUD Status Pill (Top-Right)
A clean, unobtrusive 2x4 telemetry badge in the corner displaying:
Trend Bias: BULLISH (9>21) in green or BEARISH (9<21) in red.
PDH / PDL: Exact dollar levels for the day.
PMH / PML: Live pre-market boundaries.
Psych Level: The nearest active round magnet level.
How to Trade With It (Institutional Playbook)
Setup Trigger Condition Execution
A. Morning Breakout-Retest Price breaks PMH or PDH at the open, pulls back to the line, and prints ▲ RETEST BUY. Enter Long. Stop loss just below the level. Target the next round psychological level.
B. Liquidity Sweep & Reversal Price pierces PDL, fails to stay below, and prints an EMA Bull Cross dot right at Key Support. Enter Long for a mean-reversion squeeze back up to the 21 EMA or VWAP.
C. Breakdown Continuation Price loses PML, retests from underneath, prints ▼ RETEST SELL. Enter Short. Stop loss just above the retested level.
Built-in Alerts
Includes 4 pre-configured alerts for push notifications, webhooks, or mobile alerts:
Breakout-Retest BUY
Breakdown-Retest SELL
EMA Bull Cross (Near Key Level)
EMA Bear Cross (Near Key Level)

คำจำกัดสิทธิ์ความรับผิดชอบ
ข้อมูลและบทความไม่ได้มีวัตถุประสงค์เพื่อก่อให้เกิดกิจกรรมทางการเงิน, การลงทุน, การซื้อขาย, ข้อเสนอแนะ หรือคำแนะนำประเภทอื่น ๆ ที่ให้หรือรับรองโดย TradingView อ่านเพิ่มเติมใน ข้อกำหนดการใช้งาน
คำจำกัดสิทธิ์ความรับผิดชอบ
ข้อมูลและบทความไม่ได้มีวัตถุประสงค์เพื่อก่อให้เกิดกิจกรรมทางการเงิน, การลงทุน, การซื้อขาย, ข้อเสนอแนะ หรือคำแนะนำประเภทอื่น ๆ ที่ให้หรือรับรองโดย TradingView อ่านเพิ่มเติมใน ข้อกำหนดการใช้งาน