JRC ONE v1.1 - Execution & Validation
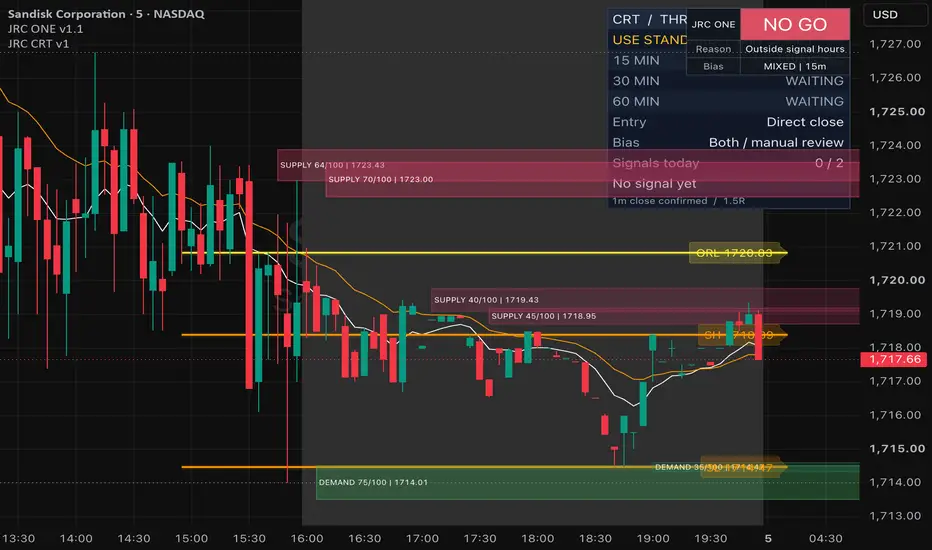
JRC ONE v1.1 - Execution & Validation
JRC ONE combines a session-level map, confirmed higher-timeframe bias, two retest setup types, risk/cost gates, and an internal execution simulation. It is an indicator, not an automated order system or a TradingView strategy. Its purpose is to separate a confirmed plan from a subsequently accepted simulated fill, and to make rejected plans and dataset limitations visible.
The source describes an original synthesis of JRC/PRB/SRT concepts; no LuxAlgo source is used. The heatmap is derived from confirmed price pivots and volume/touch heuristics, not order-book liquidity, true delta, or a probability of success.
QUICK START
1. Use standard 1-5 minute candlesticks on a US stock/ETF with America/New_York exchange timezone. Other instruments, chart types and intervals are blocked from accepting plans.
2. Enable extended-session data. Premarket data is required by default. Load enough history for the prior regular session, opening range, volume baseline and 300-bar warm-up.
3. Keep the bias timeframe above the chart timeframe; default is 15 minutes.
4. Set the validation dates and realistic cost assumptions. Defaults cover 2026, use 1 slippage tick, a 2-tick full spread and 1 basis point fee per side.
5. Start with Compact dashboard. Use Detailed for statistics and coverage, the last-10-trades ledger for records, and rejection diagnostics for blocked setups.
CONTEXT AND LEVELS
Bias uses the last completed higher-timeframe close and EMA 9/20. Bullish means close > EMA 9 > EMA 20; bearish is the reverse. Mixed bias does not start a setup. Historical offsets with lookahead_on are used for this completed higher-timeframe context.
The map includes previous regular-session high/low (PDH/PDL), premarket high/low (PMH/PML), 09:30-09:35 opening-range high/low (ORH/ORL), and confirmed swing high/low (SH/SL). Session levels are calculated in a one-minute source context. Levels within two ticks are merged and labels identify their components. Label spacing may move captions vertically while the price line stays at its actual level.
Pivot strength defaults to three bars on either side. A pivot is only known after its right-hand confirmation bars; zones originate at that confirmation, not retroactively at the pivot. Zones expire after 390 elapsed minutes or invalidate when price closes beyond the outer boundary. Supply/demand strength is a visual score based on volume and repeat touches. Colors, visibility caps and heatmap filters affect rendering only; hiding a zone does not remove it from obstacle calculations.
VWAP can reset by New York calendar day (default) or at the regular-session opening. EMA 9 and 20 provide local trend context. RVOL compares the current bar's volume with the preceding 20 regular-session bar volumes, not a time-of-day seasonal average.
SETUP A: BREAK AND RETEST
Price closes across a mapped level in the higher-timeframe bias direction. Breakout RVOL must reach the threshold, default 1.5, and the breakout must not be too extended. A later candle retests a band around the level and closes on the intended side. By default, retest volume must be below breakout volume. A still-later candle closes beyond the retest candle's extreme with a directional body. The confirmation must also agree with local VWAP and EMA 9/20 ordering.
SETUP B: SWEEP, RECLAIM AND RETEST
Price penetrates a mapped level by at least the configured ATR fraction, closes back across it with a directional body, and closes in the appropriate half of the candle range. It then requires a later holding retest and a still-later close beyond the retest candle's extreme. The sweep path does not use the continuation RVOL, quiet-retest or local VWAP/EMA gate, but still follows the confirmed higher-timeframe bias.
Both paths freeze ATR when armed. Default retest half-width is 0.25 ATR, minimum sweep penetration 0.10 ATR, failure distance 0.5 ATR, setup life 15 minutes, and confirmation time after retest 5 minutes. Bias changes or failure/expiry invalidate a setup. Default maximum entry extension is 1.5 frozen ATR. When both paths qualify at the same level, Sweep wins by default; this is configurable. The script arms one candidate at a time using its mapped-level evaluation order.
SESSIONS AND PLAN LIMITS
Default signal windows are 09:35-11:00 and 14:00-15:30, New York time, weekdays within the regular session. Afternoon signals can be disabled. The default daily cap is two confirmed PLANS, not two filled trades; zero removes the cap. Cooldown defaults to five minutes. A used level/direction is not reused that day even if its confirmed plan later fails fill validation. Pending setups clear when their signal window/date ends or a plan/guide becomes active.
RISK AND TARGETS
A stop uses the setup's tracked extreme plus a frozen-ATR buffer, default 0.20 ATR. Price risk must satisfy minimum tick distance and maximum ATR distance. Targets are limited by the nearest mapped level or opposing supply/demand zone and an ATR clearance buffer, and by the maximum gross target multiple, default 2.5R.
Plans must meet a minimum NET reward/total stop-loss ratio, default 1.5. The calculation includes configured fees and modeled adverse stop execution. There is also a maximum modeled costs/price-risk gate, default 25%. Targets and stops are rounded to instrument ticks. These gates are checked again at the modeled entry price.
PLAN VERSUS SIMULATED FILL
PLAN labels and alerts are committed at a confirmed bar close. They freeze the intended stop/target. A fill is modeled at a later bar's OPEN, default next bar open plus zero extra delay bars. This fill is only evaluated and reported at that later bar's CLOSE, so it is not an intrabar execution alert.
The modeled market entry includes adverse half-spread plus slippage, rounded up to whole ticks. A plan may be rejected for a gap past its stop/target, changed bias, excessive extension, unsuitable stop distance, costs, insufficient net reward, expiration, or a changed session/date. Default maximum fill wait is 15 minutes. Only one simulated guide is active at a time.
A newly modeled open fill may hit its stop or target on the same bar. If both are touched, the simulation chooses STOP FIRST and counts an ambiguous bar. Stop exits account for adverse opening gaps and configured market-fill costs. Target exits assume the target price. Regular-session/date exits are also modeled. If the final session bar is missing, an exit uses a later available open rather than inventing a previous-close fill. No pyramiding, partial fills, order book or broker execution is modeled.
DASHBOARD AND VALIDATION
Compact mode shows GO, WAIT or NO GO with a reason and bias or current stop/target.
GO means a NEW bar-close-confirmed plan. It does not mean a filled order, and an existing guide does not keep GO active.
WAIT covers setup development, bar confirmation, pending fill or guide management.
NO GO includes unsupported context, signal-window restrictions, rejections, date restrictions and the daily cap.
Detailed mode can show per-setup closed counts, win percentage, average net R, total closed R, R-based profit factor, closed-trade drawdown, maximum loss streak, requested versus loaded date coverage, first eligibility, open guides, outcomes and rejection counts. The default small-sample warning threshold is 100 closed trades; crossing that threshold is not evidence of reliability.
Net trade R divides net price profit/loss after modeled fees by the entry-to-original-stop PRICE distance. This differs from the plan eligibility ratio, whose denominator includes modeled stop execution and fees. Drawdown is based on accumulated CLOSED-trade R, not mark-to-market equity or dollar account drawdown. An active guide is excluded from closed statistics.
The requested default test range is 2026-01-01 inclusive through 2027-01-01 exclusive. Align end dates to a bar boundary. The dashboard flags incomplete loaded coverage. Results can change when chart history, symbol, timeframe, session settings, dates or inputs change. This publication does not claim a verified win rate or profitable performance.
LEDGER AND EXPORT
Show last 10 closed trades displays the newest records in the center and replaces the main dashboard. Rejection diagnostics list codes 1-9: invalidated, expired, bias changed, extended entry, stop distance, net reward, costs, session/date/gap, and used level. Some diagnostics count evaluated bars/events rather than unique trades.
Data Window plots expose closed-trade records on exit bars. If your TradingView plan supports chart CSV export, filter rows with Closed trade ID to reconstruct the available ledger. Times are Unix milliseconds. Setup code 1 = break/retest, 2 = sweep. Side 1 = long, -1 = short. Exit code 1 = stop, 2 = target, 3 = session, 4 = delayed session, 5 = date.
ALERTS
Choose Any alert() function call for a detailed confirmed PLAN message, or JRC ONE Long plan / JRC ONE Short plan with Once per bar close. Use one route to avoid duplicates. Alerts describe plans, not executed fills; actual execution price and costs need separate validation. Recreate alerts after changing inputs because TradingView stores their configuration.
LIMITATIONS
The simulation uses historical OHLCV and simplified execution assumptions. It does not model queue position, available liquidity, partial fills, short availability, borrow costs or broker-specific behavior. Lower-timeframe/session data availability, market data revisions and the loaded dataset can affect output. Confirmed pivots are delayed by design. Heat scores are visual heuristics. Defaults are experimental and require out-of-sample evaluation; no live-trading performance is established by this publication.
JRC ONE combines a session-level map, confirmed higher-timeframe bias, two retest setup types, risk/cost gates, and an internal execution simulation. It is an indicator, not an automated order system or a TradingView strategy. Its purpose is to separate a confirmed plan from a subsequently accepted simulated fill, and to make rejected plans and dataset limitations visible.
The source describes an original synthesis of JRC/PRB/SRT concepts; no LuxAlgo source is used. The heatmap is derived from confirmed price pivots and volume/touch heuristics, not order-book liquidity, true delta, or a probability of success.
QUICK START
1. Use standard 1-5 minute candlesticks on a US stock/ETF with America/New_York exchange timezone. Other instruments, chart types and intervals are blocked from accepting plans.
2. Enable extended-session data. Premarket data is required by default. Load enough history for the prior regular session, opening range, volume baseline and 300-bar warm-up.
3. Keep the bias timeframe above the chart timeframe; default is 15 minutes.
4. Set the validation dates and realistic cost assumptions. Defaults cover 2026, use 1 slippage tick, a 2-tick full spread and 1 basis point fee per side.
5. Start with Compact dashboard. Use Detailed for statistics and coverage, the last-10-trades ledger for records, and rejection diagnostics for blocked setups.
CONTEXT AND LEVELS
Bias uses the last completed higher-timeframe close and EMA 9/20. Bullish means close > EMA 9 > EMA 20; bearish is the reverse. Mixed bias does not start a setup. Historical offsets with lookahead_on are used for this completed higher-timeframe context.
The map includes previous regular-session high/low (PDH/PDL), premarket high/low (PMH/PML), 09:30-09:35 opening-range high/low (ORH/ORL), and confirmed swing high/low (SH/SL). Session levels are calculated in a one-minute source context. Levels within two ticks are merged and labels identify their components. Label spacing may move captions vertically while the price line stays at its actual level.
Pivot strength defaults to three bars on either side. A pivot is only known after its right-hand confirmation bars; zones originate at that confirmation, not retroactively at the pivot. Zones expire after 390 elapsed minutes or invalidate when price closes beyond the outer boundary. Supply/demand strength is a visual score based on volume and repeat touches. Colors, visibility caps and heatmap filters affect rendering only; hiding a zone does not remove it from obstacle calculations.
VWAP can reset by New York calendar day (default) or at the regular-session opening. EMA 9 and 20 provide local trend context. RVOL compares the current bar's volume with the preceding 20 regular-session bar volumes, not a time-of-day seasonal average.
SETUP A: BREAK AND RETEST
Price closes across a mapped level in the higher-timeframe bias direction. Breakout RVOL must reach the threshold, default 1.5, and the breakout must not be too extended. A later candle retests a band around the level and closes on the intended side. By default, retest volume must be below breakout volume. A still-later candle closes beyond the retest candle's extreme with a directional body. The confirmation must also agree with local VWAP and EMA 9/20 ordering.
SETUP B: SWEEP, RECLAIM AND RETEST
Price penetrates a mapped level by at least the configured ATR fraction, closes back across it with a directional body, and closes in the appropriate half of the candle range. It then requires a later holding retest and a still-later close beyond the retest candle's extreme. The sweep path does not use the continuation RVOL, quiet-retest or local VWAP/EMA gate, but still follows the confirmed higher-timeframe bias.
Both paths freeze ATR when armed. Default retest half-width is 0.25 ATR, minimum sweep penetration 0.10 ATR, failure distance 0.5 ATR, setup life 15 minutes, and confirmation time after retest 5 minutes. Bias changes or failure/expiry invalidate a setup. Default maximum entry extension is 1.5 frozen ATR. When both paths qualify at the same level, Sweep wins by default; this is configurable. The script arms one candidate at a time using its mapped-level evaluation order.
SESSIONS AND PLAN LIMITS
Default signal windows are 09:35-11:00 and 14:00-15:30, New York time, weekdays within the regular session. Afternoon signals can be disabled. The default daily cap is two confirmed PLANS, not two filled trades; zero removes the cap. Cooldown defaults to five minutes. A used level/direction is not reused that day even if its confirmed plan later fails fill validation. Pending setups clear when their signal window/date ends or a plan/guide becomes active.
RISK AND TARGETS
A stop uses the setup's tracked extreme plus a frozen-ATR buffer, default 0.20 ATR. Price risk must satisfy minimum tick distance and maximum ATR distance. Targets are limited by the nearest mapped level or opposing supply/demand zone and an ATR clearance buffer, and by the maximum gross target multiple, default 2.5R.
Plans must meet a minimum NET reward/total stop-loss ratio, default 1.5. The calculation includes configured fees and modeled adverse stop execution. There is also a maximum modeled costs/price-risk gate, default 25%. Targets and stops are rounded to instrument ticks. These gates are checked again at the modeled entry price.
PLAN VERSUS SIMULATED FILL
PLAN labels and alerts are committed at a confirmed bar close. They freeze the intended stop/target. A fill is modeled at a later bar's OPEN, default next bar open plus zero extra delay bars. This fill is only evaluated and reported at that later bar's CLOSE, so it is not an intrabar execution alert.
The modeled market entry includes adverse half-spread plus slippage, rounded up to whole ticks. A plan may be rejected for a gap past its stop/target, changed bias, excessive extension, unsuitable stop distance, costs, insufficient net reward, expiration, or a changed session/date. Default maximum fill wait is 15 minutes. Only one simulated guide is active at a time.
A newly modeled open fill may hit its stop or target on the same bar. If both are touched, the simulation chooses STOP FIRST and counts an ambiguous bar. Stop exits account for adverse opening gaps and configured market-fill costs. Target exits assume the target price. Regular-session/date exits are also modeled. If the final session bar is missing, an exit uses a later available open rather than inventing a previous-close fill. No pyramiding, partial fills, order book or broker execution is modeled.
DASHBOARD AND VALIDATION
Compact mode shows GO, WAIT or NO GO with a reason and bias or current stop/target.
GO means a NEW bar-close-confirmed plan. It does not mean a filled order, and an existing guide does not keep GO active.
WAIT covers setup development, bar confirmation, pending fill or guide management.
NO GO includes unsupported context, signal-window restrictions, rejections, date restrictions and the daily cap.
Detailed mode can show per-setup closed counts, win percentage, average net R, total closed R, R-based profit factor, closed-trade drawdown, maximum loss streak, requested versus loaded date coverage, first eligibility, open guides, outcomes and rejection counts. The default small-sample warning threshold is 100 closed trades; crossing that threshold is not evidence of reliability.
Net trade R divides net price profit/loss after modeled fees by the entry-to-original-stop PRICE distance. This differs from the plan eligibility ratio, whose denominator includes modeled stop execution and fees. Drawdown is based on accumulated CLOSED-trade R, not mark-to-market equity or dollar account drawdown. An active guide is excluded from closed statistics.
The requested default test range is 2026-01-01 inclusive through 2027-01-01 exclusive. Align end dates to a bar boundary. The dashboard flags incomplete loaded coverage. Results can change when chart history, symbol, timeframe, session settings, dates or inputs change. This publication does not claim a verified win rate or profitable performance.
LEDGER AND EXPORT
Show last 10 closed trades displays the newest records in the center and replaces the main dashboard. Rejection diagnostics list codes 1-9: invalidated, expired, bias changed, extended entry, stop distance, net reward, costs, session/date/gap, and used level. Some diagnostics count evaluated bars/events rather than unique trades.
Data Window plots expose closed-trade records on exit bars. If your TradingView plan supports chart CSV export, filter rows with Closed trade ID to reconstruct the available ledger. Times are Unix milliseconds. Setup code 1 = break/retest, 2 = sweep. Side 1 = long, -1 = short. Exit code 1 = stop, 2 = target, 3 = session, 4 = delayed session, 5 = date.
ALERTS
Choose Any alert() function call for a detailed confirmed PLAN message, or JRC ONE Long plan / JRC ONE Short plan with Once per bar close. Use one route to avoid duplicates. Alerts describe plans, not executed fills; actual execution price and costs need separate validation. Recreate alerts after changing inputs because TradingView stores their configuration.
LIMITATIONS
The simulation uses historical OHLCV and simplified execution assumptions. It does not model queue position, available liquidity, partial fills, short availability, borrow costs or broker-specific behavior. Lower-timeframe/session data availability, market data revisions and the loaded dataset can affect output. Confirmed pivots are delayed by design. Heat scores are visual heuristics. Defaults are experimental and require out-of-sample evaluation; no live-trading performance is established by this publication.

คำจำกัดสิทธิ์ความรับผิดชอบ
ข้อมูลและบทความไม่ได้มีวัตถุประสงค์เพื่อก่อให้เกิดกิจกรรมทางการเงิน, การลงทุน, การซื้อขาย, ข้อเสนอแนะ หรือคำแนะนำประเภทอื่น ๆ ที่ให้หรือรับรองโดย TradingView อ่านเพิ่มเติมใน ข้อกำหนดการใช้งาน
คำจำกัดสิทธิ์ความรับผิดชอบ
ข้อมูลและบทความไม่ได้มีวัตถุประสงค์เพื่อก่อให้เกิดกิจกรรมทางการเงิน, การลงทุน, การซื้อขาย, ข้อเสนอแนะ หรือคำแนะนำประเภทอื่น ๆ ที่ให้หรือรับรองโดย TradingView อ่านเพิ่มเติมใน ข้อกำหนดการใช้งาน