ที่อัปเดต:
Eye Liquidity Sweep Map [EyeAlgo]
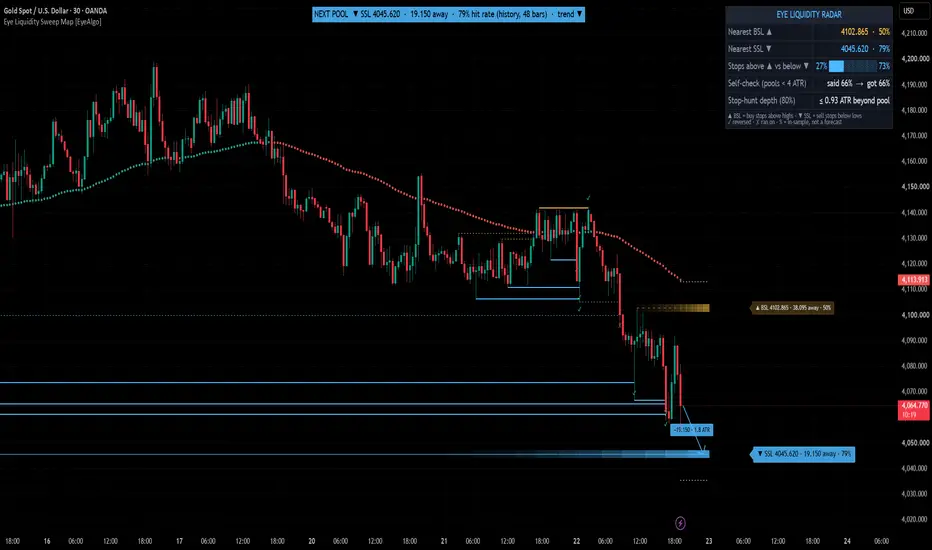
Eye Liquidity Sweep Map shows where stop orders are likely stacked (liquidity pools, estimated from highs, lows and sessions), how often price has reached pools at that distance on YOUR chart, what happened after pools were swept, and it checks its own percentages against what really happened.

🟢 OVERVIEW
This tool adds measured statistics to the usual liquidity-pool lines. It answers four questions on one chart:
• Where is the nearest buy-side liquidity (stops above highs, BSL) and sell-side liquidity (stops below lows, SSL)?
• How often has price reached a pool at this distance within 48 bars, measured on this symbol's own history?
• After a pool of each type is swept, how often does price reverse and how often does it run on?
• How deep did sweeps that reversed go, that is, how far past the pool reversed sweeps usually went on this chart?
🟢 WHAT MAKES IT ORIGINAL
▶ Reach probability by distance: each highlighted pool shows the historical chance that price trades through it within 48 bars. It is learned from this chart, split by distance (in 50-bar ATR), and sampled once per pool per window so samples never overlap.
▶ Live self-check: the % is stored when a pool is sampled, before the outcome is known. When the window ends, the script compares what it said with what happened and shows "said X% → got Y%" in the Radar (checked later on the same chart's history). It is a calibration check of the indicator's own numbers, not a forecast.
▶ Stop-hunt depth: for sweeps that reversed, the script records how far beyond the pool price went. The Radar shows the depth (in ATR(50)) that 80% of those reversed sweeps stayed within, and a dotted tick marks that level beyond each highlighted pool.
▶ Sweep scoreboard per pool type: four pool types (swing, equal highs / lows, previous period day / week / month, and Asia · London · New York sessions combined) each keep their own count of REVERSED and RAN ON outcomes.
▶ Stops above vs below: a weighted share of the pools above and below price (equal levels and previous-period levels weigh more), shown as a bar, so you see which side holds more stacked liquidity.
🟢 HOW IT WORKS
1. Liquidity pools
Confirmed swing highs / lows (5 bars left, 5 bars right, so pools never repaint), equal highs / lows (levels within 0.15 × ATR are merged into one pool), the previous period's high / low (day on intraday charts, week on daily, month on weekly, year on monthly), the previous week's high / low on intraday charts, and the Asia, London and New York session highs / lows (UTC times, editable). A pool is removed the moment price trades through it.
2. Highlighted pools
The nearest buy-side and nearest sell-side pool are drawn bright, with a fading strength zone when its hit rate is 40% or more, and a label such as "▼ SSL 4045.620 · 32.5 away · 50%". The % is the historical hit rate of pools at that distance. Other pools still count in all statistics; switch on "Also show faint lines for the other pools" to draw them.
3. Sweep outcomes
When price trades through a pool, the script waits 12 bars. A close 1 × ATR(14) back inside = REVERSED (✓), a close 1 × ATR(14) beyond = RAN ON (✗), neither = no decision (counted in the samples, so the two rates can add up to less than 100%). Pool distances and hit-rate buckets use ATR(50).
4. Radar table
• Nearest BSL / SSL with their hit rates
• Stops above ▲ vs below ▼ bar
• Self-check (pools closer than 4 ATR): said → got
• Stop-hunt depth (80%)
Turn on "Show full statistics rows" to also see hit rate by distance bucket (<2, 2–4, 4–8, 8+ ATR), the REVERSED / RAN ON rates and sample counts per pool type, and the number of open pools.
5. Optional sweep setups (experimental, off by default)
A wick takes a pool and the candle closes back inside. Stop beyond the wick + 0.2 ATR, target = the nearest opposite pool between 1R and 3R, otherwise 2R, time exit after 48 bars, trend filter (EMA 100) on by default. Optional quality filters: sweep-candle volume and rejection-wick size. Setups are graded ⭐ / ⭐⭐ / ⭐⭐⭐ and tracked to their result. The photo above has the setups switched on. They are an experiment, not a proven edge.

Second example: NAS100, 1-hour chart, same indicator and settings.
🟢 WHAT THE NUMBERS MEAN (AND DO NOT MEAN)
• Hit rate = how often price reached a pool. It is NOT a win rate. The indicator does not enter trades; reaching a pool says nothing about whether a trade there would make money.
• All percentages are in-sample: they come from the history loaded on your chart and describe the past.
• Example while testing (October 2026): XAUUSD 15m said 68% → got 70%. This is one instrument and one timeframe on one sample of history. It matches closely because both sides come from the same chart; this shows the numbers are internally consistent, not that the future will repeat.
• Works on any symbol and timeframe. Test the settings and timeframe on your own instrument before relying on it.
🟢 HOW TO USE
1. Read the banner at the top: the nearest highlighted pool with at least a 50% hit rate (otherwise the nearest), its distance and its historical hit rate.
2. Check the Radar: which side has more stacked liquidity, and what stop-hunt depth sweeps on this chart usually reach.
3. Watch for a sweep: a ✓ means the sweep reversed, a ✗ means it ran on. Look at the pool-type rows (full statistics) to see which type tends to reverse on your symbol.
4. Use the dotted stop-hunt tick as a reference for how far past a pool sweeps that reversed have gone on this chart.
5. Combine it with your own analysis and risk management.
🟢 HOW TO CHANGE SETTINGS
1. Add the indicator to your chart.
2. Hover the indicator name at the top-left of the chart and click the ⚙ gear icon.
3. Change values in the "Inputs" tab and click OK.
Quick guide:
• More pools labelled → raise "Highlighted pools per side".
• Show every pool → switch on "Also show faint lines for the other pools" and "Show liquidity ladder".
• No session levels → switch off "Use Asia / London / New York session highs & lows as pools".
• More / fewer equal levels → change "Equal highs / lows tolerance".
• Sweep setups → switch on "Show sweep setups" and use the quality filters in the same group.
• Trend line → "Show trend EMA line" (green above the EMA, red below).
• Alerts → right-click the chart → Add alert → choose "Eye Liquidity Sweep Map" and the condition.
🟢 SETTINGS
• Liquidity Pools: swing bars, equal-level tolerance, previous period / previous week / session pools and session times, show pools, ladder, highlighted pools per side, hide pools further than N ATR.
• Sweeps & Outcomes: show swept pools, minimum sweep depth, outcome window, reversal / run distance, swept pools kept.
• Sweep Setups (experimental): show setups, stop buffer, maximum stop distance, minimum / maximum reward:risk, time exit, ⭐ thresholds, trend EMA length, minimum close back inside, quality filters (volume, wick %), TP / SL boxes, setups kept.
• Reach Probability: reach window (bars), minimum samples.
• Colours, table position, full statistics rows, detailed alerts.
🟢 ALERTS
• Sweep REVERSED / Sweep RAN ON
• Buy-side liquidity swept / Sell-side liquidity swept (wick sweep that closed back inside)
• Sweep setup ▲ / ▼ (needs setups ON), ⭐⭐⭐ setup
• Setup target hit / Setup stop hit
• Detailed alert() message (setups only) with direction, stars, entry, stop and target; choose "Any alert() function call" when creating the alert.
🟢 IMPORTANT NOTES & LIMITATIONS
• Pools appear only after a swing is confirmed (5 bars), so they never repaint. A pool is "taken" by any trade beyond it, even 1 tick.
• Percentages and counts need history. With little history they show "–" or "collecting…" until the minimum samples are reached.
• Session pools use fixed UTC times; a session that crosses UTC midnight is split in two. They are used on intraday charts only.
• Volume filters need volume data on the symbol (forex and CFD feeds use tick volume).
• Alerts and outcomes use confirmed bars; the banner, Radar and highlighted pools update live on the last bar.
• TradingView allows 500 lines, boxes and labels per script, so on long histories the oldest drawings are removed automatically.
• The script does not place trades.
🟢 DISCLAIMER
This indicator is for educational and analysis purposes only. It is not financial advice. Past behaviour on a chart does not guarantee future results. Always use your own analysis and risk management.
🟢 OVERVIEW
This tool adds measured statistics to the usual liquidity-pool lines. It answers four questions on one chart:
• Where is the nearest buy-side liquidity (stops above highs, BSL) and sell-side liquidity (stops below lows, SSL)?
• How often has price reached a pool at this distance within 48 bars, measured on this symbol's own history?
• After a pool of each type is swept, how often does price reverse and how often does it run on?
• How deep did sweeps that reversed go, that is, how far past the pool reversed sweeps usually went on this chart?
🟢 WHAT MAKES IT ORIGINAL
▶ Reach probability by distance: each highlighted pool shows the historical chance that price trades through it within 48 bars. It is learned from this chart, split by distance (in 50-bar ATR), and sampled once per pool per window so samples never overlap.
▶ Live self-check: the % is stored when a pool is sampled, before the outcome is known. When the window ends, the script compares what it said with what happened and shows "said X% → got Y%" in the Radar (checked later on the same chart's history). It is a calibration check of the indicator's own numbers, not a forecast.
▶ Stop-hunt depth: for sweeps that reversed, the script records how far beyond the pool price went. The Radar shows the depth (in ATR(50)) that 80% of those reversed sweeps stayed within, and a dotted tick marks that level beyond each highlighted pool.
▶ Sweep scoreboard per pool type: four pool types (swing, equal highs / lows, previous period day / week / month, and Asia · London · New York sessions combined) each keep their own count of REVERSED and RAN ON outcomes.
▶ Stops above vs below: a weighted share of the pools above and below price (equal levels and previous-period levels weigh more), shown as a bar, so you see which side holds more stacked liquidity.
🟢 HOW IT WORKS
1. Liquidity pools
Confirmed swing highs / lows (5 bars left, 5 bars right, so pools never repaint), equal highs / lows (levels within 0.15 × ATR are merged into one pool), the previous period's high / low (day on intraday charts, week on daily, month on weekly, year on monthly), the previous week's high / low on intraday charts, and the Asia, London and New York session highs / lows (UTC times, editable). A pool is removed the moment price trades through it.
2. Highlighted pools
The nearest buy-side and nearest sell-side pool are drawn bright, with a fading strength zone when its hit rate is 40% or more, and a label such as "▼ SSL 4045.620 · 32.5 away · 50%". The % is the historical hit rate of pools at that distance. Other pools still count in all statistics; switch on "Also show faint lines for the other pools" to draw them.
3. Sweep outcomes
When price trades through a pool, the script waits 12 bars. A close 1 × ATR(14) back inside = REVERSED (✓), a close 1 × ATR(14) beyond = RAN ON (✗), neither = no decision (counted in the samples, so the two rates can add up to less than 100%). Pool distances and hit-rate buckets use ATR(50).
4. Radar table
• Nearest BSL / SSL with their hit rates
• Stops above ▲ vs below ▼ bar
• Self-check (pools closer than 4 ATR): said → got
• Stop-hunt depth (80%)
Turn on "Show full statistics rows" to also see hit rate by distance bucket (<2, 2–4, 4–8, 8+ ATR), the REVERSED / RAN ON rates and sample counts per pool type, and the number of open pools.
5. Optional sweep setups (experimental, off by default)
A wick takes a pool and the candle closes back inside. Stop beyond the wick + 0.2 ATR, target = the nearest opposite pool between 1R and 3R, otherwise 2R, time exit after 48 bars, trend filter (EMA 100) on by default. Optional quality filters: sweep-candle volume and rejection-wick size. Setups are graded ⭐ / ⭐⭐ / ⭐⭐⭐ and tracked to their result. The photo above has the setups switched on. They are an experiment, not a proven edge.
Second example: NAS100, 1-hour chart, same indicator and settings.
🟢 WHAT THE NUMBERS MEAN (AND DO NOT MEAN)
• Hit rate = how often price reached a pool. It is NOT a win rate. The indicator does not enter trades; reaching a pool says nothing about whether a trade there would make money.
• All percentages are in-sample: they come from the history loaded on your chart and describe the past.
• Example while testing (October 2026): XAUUSD 15m said 68% → got 70%. This is one instrument and one timeframe on one sample of history. It matches closely because both sides come from the same chart; this shows the numbers are internally consistent, not that the future will repeat.
• Works on any symbol and timeframe. Test the settings and timeframe on your own instrument before relying on it.
🟢 HOW TO USE
1. Read the banner at the top: the nearest highlighted pool with at least a 50% hit rate (otherwise the nearest), its distance and its historical hit rate.
2. Check the Radar: which side has more stacked liquidity, and what stop-hunt depth sweeps on this chart usually reach.
3. Watch for a sweep: a ✓ means the sweep reversed, a ✗ means it ran on. Look at the pool-type rows (full statistics) to see which type tends to reverse on your symbol.
4. Use the dotted stop-hunt tick as a reference for how far past a pool sweeps that reversed have gone on this chart.
5. Combine it with your own analysis and risk management.
🟢 HOW TO CHANGE SETTINGS
1. Add the indicator to your chart.
2. Hover the indicator name at the top-left of the chart and click the ⚙ gear icon.
3. Change values in the "Inputs" tab and click OK.
Quick guide:
• More pools labelled → raise "Highlighted pools per side".
• Show every pool → switch on "Also show faint lines for the other pools" and "Show liquidity ladder".
• No session levels → switch off "Use Asia / London / New York session highs & lows as pools".
• More / fewer equal levels → change "Equal highs / lows tolerance".
• Sweep setups → switch on "Show sweep setups" and use the quality filters in the same group.
• Trend line → "Show trend EMA line" (green above the EMA, red below).
• Alerts → right-click the chart → Add alert → choose "Eye Liquidity Sweep Map" and the condition.
🟢 SETTINGS
• Liquidity Pools: swing bars, equal-level tolerance, previous period / previous week / session pools and session times, show pools, ladder, highlighted pools per side, hide pools further than N ATR.
• Sweeps & Outcomes: show swept pools, minimum sweep depth, outcome window, reversal / run distance, swept pools kept.
• Sweep Setups (experimental): show setups, stop buffer, maximum stop distance, minimum / maximum reward:risk, time exit, ⭐ thresholds, trend EMA length, minimum close back inside, quality filters (volume, wick %), TP / SL boxes, setups kept.
• Reach Probability: reach window (bars), minimum samples.
• Colours, table position, full statistics rows, detailed alerts.
🟢 ALERTS
• Sweep REVERSED / Sweep RAN ON
• Buy-side liquidity swept / Sell-side liquidity swept (wick sweep that closed back inside)
• Sweep setup ▲ / ▼ (needs setups ON), ⭐⭐⭐ setup
• Setup target hit / Setup stop hit
• Detailed alert() message (setups only) with direction, stars, entry, stop and target; choose "Any alert() function call" when creating the alert.
🟢 IMPORTANT NOTES & LIMITATIONS
• Pools appear only after a swing is confirmed (5 bars), so they never repaint. A pool is "taken" by any trade beyond it, even 1 tick.
• Percentages and counts need history. With little history they show "–" or "collecting…" until the minimum samples are reached.
• Session pools use fixed UTC times; a session that crosses UTC midnight is split in two. They are used on intraday charts only.
• Volume filters need volume data on the symbol (forex and CFD feeds use tick volume).
• Alerts and outcomes use confirmed bars; the banner, Radar and highlighted pools update live on the last bar.
• TradingView allows 500 lines, boxes and labels per script, so on long histories the oldest drawings are removed automatically.
• The script does not place trades.
🟢 DISCLAIMER
This indicator is for educational and analysis purposes only. It is not financial advice. Past behaviour on a chart does not guarantee future results. Always use your own analysis and risk management.
Release Note
Fix: previous day / week high-low pools merged with session pools were counted as Session. They now keep the Previous period type, so the per-type scoreboard and tooltips are correct.
คำจำกัดสิทธิ์ความรับผิดชอบ
ข้อมูลและบทความไม่ได้มีวัตถุประสงค์เพื่อก่อให้เกิดกิจกรรมทางการเงิน, การลงทุน, การซื้อขาย, ข้อเสนอแนะ หรือคำแนะนำประเภทอื่น ๆ ที่ให้หรือรับรองโดย TradingView อ่านเพิ่มเติมใน ข้อกำหนดการใช้งาน
คำจำกัดสิทธิ์ความรับผิดชอบ
ข้อมูลและบทความไม่ได้มีวัตถุประสงค์เพื่อก่อให้เกิดกิจกรรมทางการเงิน, การลงทุน, การซื้อขาย, ข้อเสนอแนะ หรือคำแนะนำประเภทอื่น ๆ ที่ให้หรือรับรองโดย TradingView อ่านเพิ่มเติมใน ข้อกำหนดการใช้งาน