OPEN-SOURCE SCRIPT
Multi EMA + Forecast (5,30,60,120,250,500)
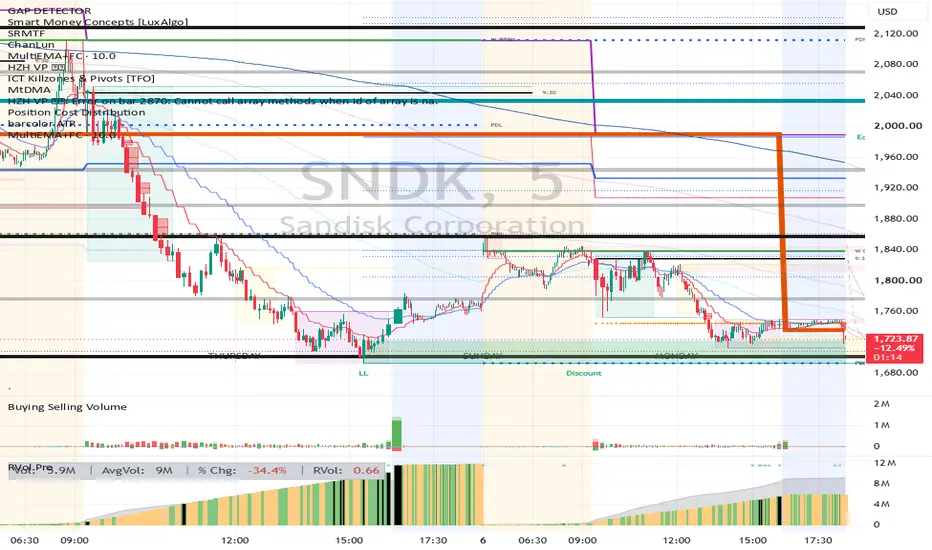
Multi-Timeframe (MTF) EMA Group
Overview
The Multi-Timeframe (MTF) EMA Group is a powerful trend-following indicator designed to give traders a clearer perspective on market direction by projecting higher-timeframe data onto their current chart. By combining a cluster of Exponential Moving Averages (EMAs) with Multi-Timeframe capabilities, this tool helps you filter out market noise and align your entries with the macro trend.
Whether you are a scalper looking for higher-timeframe context or a swing trader managing dynamic support and resistance, this indicator provides a clean, customizable visual ribbon to guide your bias.
Key Features
Multi-Timeframe (MTF) Selection: Plot EMAs from any timeframe (e.g., 1-Hour, 4-Hour, Daily) onto your current working chart (e.g., 5-Minute, 15-Minute).
Customizable EMA Cluster: Includes multiple EMA inputs (e.g., 5, 9, 20, 50, 100, 200) allowing you to build a dense "ribbon" or a simple two-line crossover system.
Trend Visualizer: When the shorter EMAs are stacked above the longer EMAs, the ribbon indicates a bullish trend. When the order is reversed, it indicates a bearish trend. The widening of the group signifies trend strength, while a pinching or twisting group warns of consolidation or a potential reversal.
Non-Repainting MTF Data: Built using standard TradingView MTF protocols to ensure the data is accurate and does not repaint once the higher timeframe candle closes.
How to Use It in Your Trading
Trend Alignment: Avoid trading against the dominant trend. For example, if you are trading on a 15-minute chart, set the indicator's timeframe to 1-Hour or 4-Hour. Only take long setups when the price is above the higher-timeframe EMA group, and short setups when it is below.
Dynamic Support & Resistance: A tightly clustered group of EMAs often acts as a strong zone of dynamic support in an uptrend or resistance in a downtrend. Look for price to pull back into the EMA "value area" for optimal trade entries.
Crossovers & Reversals: Watch for the shortest EMA in the group to cross through the longer EMAs as an early warning sign that the macro trend might be shifting.
Customization Options
Resolution/Timeframe: Easily toggle the timeframe drop-down in the settings to pull data from your desired chart interval.
Lengths: Fully adjustable lengths for every EMA in the group to suit your specific trading style.
Colors & Styling: Customize the thickness and color gradients of the lines to make the ribbon visually intuitive on both dark and light chart themes.
Disclaimer: This indicator is for educational and analytical purposes only. Past performance does not guarantee future results. Always combine moving averages with other forms of technical analysis, such as price action and volume, before making trading decisions.
Overview
The Multi-Timeframe (MTF) EMA Group is a powerful trend-following indicator designed to give traders a clearer perspective on market direction by projecting higher-timeframe data onto their current chart. By combining a cluster of Exponential Moving Averages (EMAs) with Multi-Timeframe capabilities, this tool helps you filter out market noise and align your entries with the macro trend.
Whether you are a scalper looking for higher-timeframe context or a swing trader managing dynamic support and resistance, this indicator provides a clean, customizable visual ribbon to guide your bias.
Key Features
Multi-Timeframe (MTF) Selection: Plot EMAs from any timeframe (e.g., 1-Hour, 4-Hour, Daily) onto your current working chart (e.g., 5-Minute, 15-Minute).
Customizable EMA Cluster: Includes multiple EMA inputs (e.g., 5, 9, 20, 50, 100, 200) allowing you to build a dense "ribbon" or a simple two-line crossover system.
Trend Visualizer: When the shorter EMAs are stacked above the longer EMAs, the ribbon indicates a bullish trend. When the order is reversed, it indicates a bearish trend. The widening of the group signifies trend strength, while a pinching or twisting group warns of consolidation or a potential reversal.
Non-Repainting MTF Data: Built using standard TradingView MTF protocols to ensure the data is accurate and does not repaint once the higher timeframe candle closes.
How to Use It in Your Trading
Trend Alignment: Avoid trading against the dominant trend. For example, if you are trading on a 15-minute chart, set the indicator's timeframe to 1-Hour or 4-Hour. Only take long setups when the price is above the higher-timeframe EMA group, and short setups when it is below.
Dynamic Support & Resistance: A tightly clustered group of EMAs often acts as a strong zone of dynamic support in an uptrend or resistance in a downtrend. Look for price to pull back into the EMA "value area" for optimal trade entries.
Crossovers & Reversals: Watch for the shortest EMA in the group to cross through the longer EMAs as an early warning sign that the macro trend might be shifting.
Customization Options
Resolution/Timeframe: Easily toggle the timeframe drop-down in the settings to pull data from your desired chart interval.
Lengths: Fully adjustable lengths for every EMA in the group to suit your specific trading style.
Colors & Styling: Customize the thickness and color gradients of the lines to make the ribbon visually intuitive on both dark and light chart themes.
Disclaimer: This indicator is for educational and analytical purposes only. Past performance does not guarantee future results. Always combine moving averages with other forms of technical analysis, such as price action and volume, before making trading decisions.
สคริปต์โอเพนซอร์ซ
ด้วยเจตนารมณ์หลักของ TradingView ผู้สร้างสคริปต์นี้ได้ทำให้เป็นโอเพนซอร์ส เพื่อให้เทรดเดอร์สามารถตรวจสอบและยืนยันฟังก์ชันการทำงานของมันได้ ขอชื่นชมผู้เขียน! แม้ว่าคุณจะใช้งานได้ฟรี แต่โปรดจำไว้ว่าการเผยแพร่โค้ดซ้ำจะต้องเป็นไปตาม กฎระเบียบการใช้งาน ของเรา

คำจำกัดสิทธิ์ความรับผิดชอบ
ข้อมูลและบทความไม่ได้มีวัตถุประสงค์เพื่อก่อให้เกิดกิจกรรมทางการเงิน, การลงทุน, การซื้อขาย, ข้อเสนอแนะ หรือคำแนะนำประเภทอื่น ๆ ที่ให้หรือรับรองโดย TradingView อ่านเพิ่มเติมใน ข้อกำหนดการใช้งาน
สคริปต์โอเพนซอร์ซ
ด้วยเจตนารมณ์หลักของ TradingView ผู้สร้างสคริปต์นี้ได้ทำให้เป็นโอเพนซอร์ส เพื่อให้เทรดเดอร์สามารถตรวจสอบและยืนยันฟังก์ชันการทำงานของมันได้ ขอชื่นชมผู้เขียน! แม้ว่าคุณจะใช้งานได้ฟรี แต่โปรดจำไว้ว่าการเผยแพร่โค้ดซ้ำจะต้องเป็นไปตาม กฎระเบียบการใช้งาน ของเรา
คำจำกัดสิทธิ์ความรับผิดชอบ
ข้อมูลและบทความไม่ได้มีวัตถุประสงค์เพื่อก่อให้เกิดกิจกรรมทางการเงิน, การลงทุน, การซื้อขาย, ข้อเสนอแนะ หรือคำแนะนำประเภทอื่น ๆ ที่ให้หรือรับรองโดย TradingView อ่านเพิ่มเติมใน ข้อกำหนดการใช้งาน