Soul Investor | Momentum Intelligence (EMA 21/50)
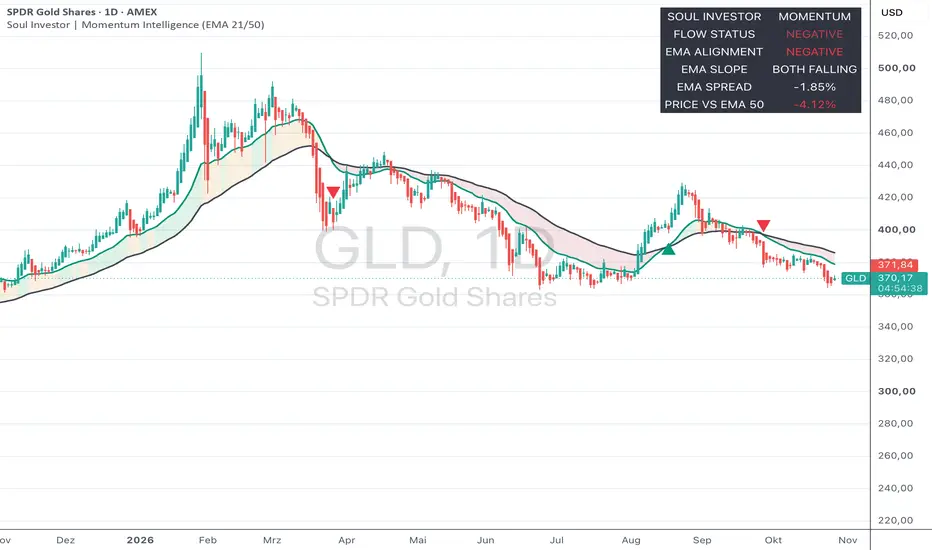
# Soul Investor | Momentum Intelligence (EMA 21/50)
**Beyond Traditional Moving Averages — Understanding the Rhythm of Market Momentum**
## Overview
Soul Investor | Momentum Intelligence is a technical trend analysis indicator designed to visualize not only the direction of a market trend, but also how its underlying momentum evolves over time.
Rather than relying exclusively on traditional moving average crossovers, the indicator introduces a structured momentum framework that distinguishes between emerging, expanding, cooling and negative trend conditions.
Built around the 21-period and 50-period Exponential Moving Averages (EMAs), it combines trend alignment, moving average slopes, relative EMA distance and price positioning into one intuitive analytical interface.
The objective is simple: **Make market momentum easier to understand, interpret and monitor.**
## The Four Momentum Phases
### 1. Emerging Flow — A New Trend Begins
**Visual Color: Turquoise**
Emerging Flow identifies the initial stage following a bullish EMA crossover.
It begins when EMA 21 crosses above EMA 50 and remains active for a configurable number of bars, provided the positive EMA alignment persists.
The default emerging window is five bars.
This phase highlights an early positive trend development, rather than a confirmed long-term investment opportunity.
### 2. Expanding Flow — Momentum Strengthens
**Visual Color: Green**
Expanding Flow identifies conditions in which:
- EMA 21 is above EMA 50.
- Both moving averages are rising over the selected lookback period.
- The percentage spread between EMA 21 and EMA 50 is increasing.
- The Emerging Flow window is no longer active.
These conditions suggest strengthening positive trend alignment.
### 3. Cooling Flow — Momentum Begins to Weaken
**Visual Color: Gold**
Cooling Flow identifies a potential loss of positive momentum.
It occurs when EMA 21 remains above EMA 50, but the percentage spread between the moving averages is narrowing, outside the Emerging Flow window.
Importantly, Cooling Flow does not automatically represent a bearish trend reversal.
It indicates that positive momentum is moderating and may warrant closer observation.
### 4. Negative Flow — Bearish Trend Alignment
**Visual Color: Red**
Negative Flow is active whenever EMA 21 is below EMA 50.
This indicates negative intermediate-term EMA alignment, regardless of whether the moving averages are currently rising or falling.
When none of the four phase conditions applies, the dashboard displays a neutral Transition status.
## The Momentum Intelligence Dashboard
A compact dashboard provides five analytical measurements:
**Flow Status**
Displays the current momentum classification: Emerging, Expanding, Cooling, Negative or Transition.
**EMA Alignment**
Identifies whether EMA 21 is above or below EMA 50.
**EMA Slope**
Evaluates whether both moving averages are rising, falling or moving in different directions over the configured lookback period.
**EMA Spread (%)**
Measures the relative distance between the two moving averages.
Formula:
(EMA 21 / EMA 50 − 1) × 100
**Price vs EMA 50 (%)**
Measures how far the current closing price is above or below the EMA 50.
Formula:
(Close / EMA 50 − 1) × 100
Together, these measurements provide additional context for interpreting trend direction and momentum changes.
## Four Independent Smart Alerts
The indicator includes four independently configurable TradingView alert conditions.
**BULLISH | EMA 21 Crosses Above EMA 50**
Triggered when EMA 21 crosses above EMA 50 on a confirmed candle close.
**EXPANDING | Momentum Strengthening**
Triggered when the indicator enters Expanding Flow from a different phase.
**COOLING | Momentum Weakening**
Triggered when the indicator enters Cooling Flow from a different phase.
**BEARISH | EMA 21 Crosses Below EMA 50**
Triggered when EMA 21 crosses below EMA 50 on a confirmed candle close.
Alerts are evaluated on confirmed bar closes and can be configured individually.
## Visual Design
The indicator uses two EMA lines with a dynamic colored zone between them.
The zone reflects the current momentum phase, while small triangular markers identify bullish and bearish EMA crossovers.
This design allows traders and investors to recognize changes in momentum structure without adding multiple separate indicators to the chart.
## Recommended Settings
- Timeframe: Daily (1D)
- Fast EMA: 21 periods
- Slow EMA: 50 periods
- EMA slope lookback: 5 periods
- Emerging Flow duration: 5 bars
- Suggested chart view: 1 year
- Alert frequency: Once per bar close
All major parameters can be adjusted in the indicator settings.
## Interpretation and Limitations
Soul Investor | Momentum Intelligence is a trend-following analytical tool.
Exponential moving averages are calculated from historical price data and therefore respond to price developments with a delay.
During sideways or highly volatile markets, the indicator may produce frequent changes between momentum phases or misleading crossover signals.
An Emerging or Expanding Flow classification does not constitute a buy recommendation. Cooling or Negative Flow does not automatically constitute a sell recommendation.
The indicator does not evaluate company fundamentals, valuation, market liquidity or individual portfolio risk.
Its momentum classifications are rule-based analytical interpretations and do not imply statistically validated predictive performance.
## About Soul Investor
Developed by **Soul Investor Academy**.
Soul Investor brings together professional investment expertise, disciplined market analysis and a conscious philosophy of wealth creation.
Our approach combines financial knowledge with clarity, independence and long-term thinking.
**Soul Investor — The Beauty of Wealth.**
*For educational and informational purposes only. This indicator does not constitute financial or investment advice. Past performance and historical technical patterns do not guarantee future results.*
**Beyond Traditional Moving Averages — Understanding the Rhythm of Market Momentum**
## Overview
Soul Investor | Momentum Intelligence is a technical trend analysis indicator designed to visualize not only the direction of a market trend, but also how its underlying momentum evolves over time.
Rather than relying exclusively on traditional moving average crossovers, the indicator introduces a structured momentum framework that distinguishes between emerging, expanding, cooling and negative trend conditions.
Built around the 21-period and 50-period Exponential Moving Averages (EMAs), it combines trend alignment, moving average slopes, relative EMA distance and price positioning into one intuitive analytical interface.
The objective is simple: **Make market momentum easier to understand, interpret and monitor.**
## The Four Momentum Phases
### 1. Emerging Flow — A New Trend Begins
**Visual Color: Turquoise**
Emerging Flow identifies the initial stage following a bullish EMA crossover.
It begins when EMA 21 crosses above EMA 50 and remains active for a configurable number of bars, provided the positive EMA alignment persists.
The default emerging window is five bars.
This phase highlights an early positive trend development, rather than a confirmed long-term investment opportunity.
### 2. Expanding Flow — Momentum Strengthens
**Visual Color: Green**
Expanding Flow identifies conditions in which:
- EMA 21 is above EMA 50.
- Both moving averages are rising over the selected lookback period.
- The percentage spread between EMA 21 and EMA 50 is increasing.
- The Emerging Flow window is no longer active.
These conditions suggest strengthening positive trend alignment.
### 3. Cooling Flow — Momentum Begins to Weaken
**Visual Color: Gold**
Cooling Flow identifies a potential loss of positive momentum.
It occurs when EMA 21 remains above EMA 50, but the percentage spread between the moving averages is narrowing, outside the Emerging Flow window.
Importantly, Cooling Flow does not automatically represent a bearish trend reversal.
It indicates that positive momentum is moderating and may warrant closer observation.
### 4. Negative Flow — Bearish Trend Alignment
**Visual Color: Red**
Negative Flow is active whenever EMA 21 is below EMA 50.
This indicates negative intermediate-term EMA alignment, regardless of whether the moving averages are currently rising or falling.
When none of the four phase conditions applies, the dashboard displays a neutral Transition status.
## The Momentum Intelligence Dashboard
A compact dashboard provides five analytical measurements:
**Flow Status**
Displays the current momentum classification: Emerging, Expanding, Cooling, Negative or Transition.
**EMA Alignment**
Identifies whether EMA 21 is above or below EMA 50.
**EMA Slope**
Evaluates whether both moving averages are rising, falling or moving in different directions over the configured lookback period.
**EMA Spread (%)**
Measures the relative distance between the two moving averages.
Formula:
(EMA 21 / EMA 50 − 1) × 100
**Price vs EMA 50 (%)**
Measures how far the current closing price is above or below the EMA 50.
Formula:
(Close / EMA 50 − 1) × 100
Together, these measurements provide additional context for interpreting trend direction and momentum changes.
## Four Independent Smart Alerts
The indicator includes four independently configurable TradingView alert conditions.
**BULLISH | EMA 21 Crosses Above EMA 50**
Triggered when EMA 21 crosses above EMA 50 on a confirmed candle close.
**EXPANDING | Momentum Strengthening**
Triggered when the indicator enters Expanding Flow from a different phase.
**COOLING | Momentum Weakening**
Triggered when the indicator enters Cooling Flow from a different phase.
**BEARISH | EMA 21 Crosses Below EMA 50**
Triggered when EMA 21 crosses below EMA 50 on a confirmed candle close.
Alerts are evaluated on confirmed bar closes and can be configured individually.
## Visual Design
The indicator uses two EMA lines with a dynamic colored zone between them.
The zone reflects the current momentum phase, while small triangular markers identify bullish and bearish EMA crossovers.
This design allows traders and investors to recognize changes in momentum structure without adding multiple separate indicators to the chart.
## Recommended Settings
- Timeframe: Daily (1D)
- Fast EMA: 21 periods
- Slow EMA: 50 periods
- EMA slope lookback: 5 periods
- Emerging Flow duration: 5 bars
- Suggested chart view: 1 year
- Alert frequency: Once per bar close
All major parameters can be adjusted in the indicator settings.
## Interpretation and Limitations
Soul Investor | Momentum Intelligence is a trend-following analytical tool.
Exponential moving averages are calculated from historical price data and therefore respond to price developments with a delay.
During sideways or highly volatile markets, the indicator may produce frequent changes between momentum phases or misleading crossover signals.
An Emerging or Expanding Flow classification does not constitute a buy recommendation. Cooling or Negative Flow does not automatically constitute a sell recommendation.
The indicator does not evaluate company fundamentals, valuation, market liquidity or individual portfolio risk.
Its momentum classifications are rule-based analytical interpretations and do not imply statistically validated predictive performance.
## About Soul Investor
Developed by **Soul Investor Academy**.
Soul Investor brings together professional investment expertise, disciplined market analysis and a conscious philosophy of wealth creation.
Our approach combines financial knowledge with clarity, independence and long-term thinking.
**Soul Investor — The Beauty of Wealth.**
*For educational and informational purposes only. This indicator does not constitute financial or investment advice. Past performance and historical technical patterns do not guarantee future results.*

คำจำกัดสิทธิ์ความรับผิดชอบ
ข้อมูลและบทความไม่ได้มีวัตถุประสงค์เพื่อก่อให้เกิดกิจกรรมทางการเงิน, การลงทุน, การซื้อขาย, ข้อเสนอแนะ หรือคำแนะนำประเภทอื่น ๆ ที่ให้หรือรับรองโดย TradingView อ่านเพิ่มเติมใน ข้อกำหนดการใช้งาน
คำจำกัดสิทธิ์ความรับผิดชอบ
ข้อมูลและบทความไม่ได้มีวัตถุประสงค์เพื่อก่อให้เกิดกิจกรรมทางการเงิน, การลงทุน, การซื้อขาย, ข้อเสนอแนะ หรือคำแนะนำประเภทอื่น ๆ ที่ให้หรือรับรองโดย TradingView อ่านเพิ่มเติมใน ข้อกำหนดการใช้งาน