ที่อัปเดต:
Khajanchi Smart Swing Engine [Auto-Fibs]
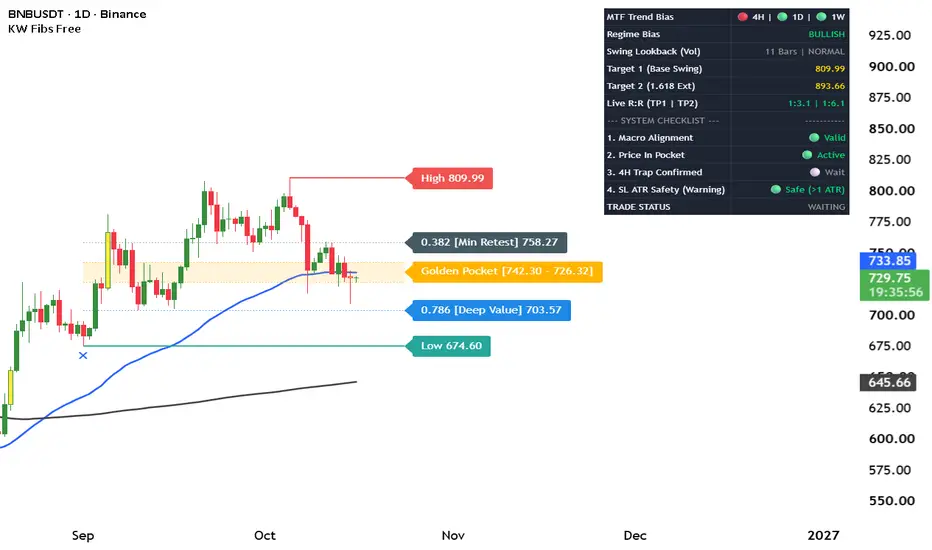
Overview
The Khajanchi Smart Swing Engine is a universal, trend-filtered trading suite engineered specifically for swing traders. Instead of cluttering your chart with isolated indicators, this engine combines institutional moving averages, volatility-adjusted swing pivots, automated Fibonacci zones, and RSI divergences into a single, clean workspace.
Optimized for the 4H and Daily timeframes, the script is designed to be asset-agnostic—working seamlessly across Indian equities (NSE/BSE), crypto, indices, and commodities by using ATR (Average True Range) to adapt to the asset's unique volatility.
Core Features
Institutional Regime Filter (50 EMA & 200 SMA): The 200 SMA acts as the master trend filter. The engine only looks for bullish setups when the price is above the 200 SMA, and bearish setups when below. The 50 EMA acts as your dynamic support/resistance for high-probability pullback entries.
ATR-Adaptive Auto-Fibs & The Golden Pocket: Stop drawing manual retracements. The script auto-detects structural swing highs and lows, dynamically tightening its lookback during high volatility and expanding during consolidation. It automatically projects Fibonacci retracement zones in the direction of the trend, highlighting the 0.382 (Ideal Retest) in green and coloring the 0.5 to 0.618 "Golden Pocket" in yellow.
Trend-Filtered RSI (7) Divergence: Uses a highly responsive 7-period RSI to spot exhaustion. To prevent false signals, it only plots Bullish Divergences during overall uptrends (buy the dip) and Bearish Divergences during downtrends (sell the rip).
Clean Telemetry HUD: A minimalist top-right dashboard provides instant situational awareness without obscuring price action. It tracks the current Regime Bias (Bullish/Bearish), real-time RSI State (Bull Power >60, Bear Power <40, or Neutral 40-60), the current ATR-adjusted swing lookback, and the 200 SMA baseline.
Built-in Custom Alerts: Features native alert conditions that notify you exactly when an asset pulls back and touches the 50 EMA within an established trend—perfect for setting up limit orders at the Golden Pocket.
How to Trade with this Engine
Identify the Regime: Look at the HUD. Is the Regime Bullish (Price > 200 SMA)? If yes, you are only looking for long positions.
Wait for the Pullback: Let the price retrace into the highlighted yellow "Golden Pocket" (0.500 - 0.618) or touch the 50 EMA.
Confirm the Trigger: Look for a printed Bullish Divergence arrow below the price, or check the HUD to see if the RSI is resetting from Neutral back into "Bull Power" (>60).
Execute: Enter the trade with your stop loss safely below the recent dynamic support line (auto-plotted in grey) or the 0.786 deep value zone.
Best Timeframes: 4H and 1D (Daily)
Asset Classes: Universal (Crypto, Equities, Forex, Commodities)
Script and logic engineered by Khajanchi Wealth.
The Khajanchi Smart Swing Engine is a universal, trend-filtered trading suite engineered specifically for swing traders. Instead of cluttering your chart with isolated indicators, this engine combines institutional moving averages, volatility-adjusted swing pivots, automated Fibonacci zones, and RSI divergences into a single, clean workspace.
Optimized for the 4H and Daily timeframes, the script is designed to be asset-agnostic—working seamlessly across Indian equities (NSE/BSE), crypto, indices, and commodities by using ATR (Average True Range) to adapt to the asset's unique volatility.
Core Features
Institutional Regime Filter (50 EMA & 200 SMA): The 200 SMA acts as the master trend filter. The engine only looks for bullish setups when the price is above the 200 SMA, and bearish setups when below. The 50 EMA acts as your dynamic support/resistance for high-probability pullback entries.
ATR-Adaptive Auto-Fibs & The Golden Pocket: Stop drawing manual retracements. The script auto-detects structural swing highs and lows, dynamically tightening its lookback during high volatility and expanding during consolidation. It automatically projects Fibonacci retracement zones in the direction of the trend, highlighting the 0.382 (Ideal Retest) in green and coloring the 0.5 to 0.618 "Golden Pocket" in yellow.
Trend-Filtered RSI (7) Divergence: Uses a highly responsive 7-period RSI to spot exhaustion. To prevent false signals, it only plots Bullish Divergences during overall uptrends (buy the dip) and Bearish Divergences during downtrends (sell the rip).
Clean Telemetry HUD: A minimalist top-right dashboard provides instant situational awareness without obscuring price action. It tracks the current Regime Bias (Bullish/Bearish), real-time RSI State (Bull Power >60, Bear Power <40, or Neutral 40-60), the current ATR-adjusted swing lookback, and the 200 SMA baseline.
Built-in Custom Alerts: Features native alert conditions that notify you exactly when an asset pulls back and touches the 50 EMA within an established trend—perfect for setting up limit orders at the Golden Pocket.
How to Trade with this Engine
Identify the Regime: Look at the HUD. Is the Regime Bullish (Price > 200 SMA)? If yes, you are only looking for long positions.
Wait for the Pullback: Let the price retrace into the highlighted yellow "Golden Pocket" (0.500 - 0.618) or touch the 50 EMA.
Confirm the Trigger: Look for a printed Bullish Divergence arrow below the price, or check the HUD to see if the RSI is resetting from Neutral back into "Bull Power" (>60).
Execute: Enter the trade with your stop loss safely below the recent dynamic support line (auto-plotted in grey) or the 0.786 deep value zone.
Best Timeframes: 4H and 1D (Daily)
Asset Classes: Universal (Crypto, Equities, Forex, Commodities)
Script and logic engineered by Khajanchi Wealth.
Release Note
Khajanchi Smart Swing Engine [Master Setup]Overview
The Khajanchi Smart Swing Engine has officially evolved from an advanced mapping tool into a complete, institutional-grade execution system. Designed strictly for the 4H and Daily timeframes, this engine replaces cluttered retail charts with a minimalist, math-driven interface. By integrating Multi-Timeframe (MTF) trend alignment, liquidity sweep detection, and stealth volume confirmation into a single workspace, it removes emotional decision-making from your swing trading process.
This system is asset-agnostic and adapts dynamically to the unique volatility (ATR) of Indian equities, crypto, indices, and forex.
Core System Features
Active Execution Engine (Zero Clutter): No more chart noise from past trades. The engine isolates the current active swing structure. When all systemic conditions align, it prints a single "Entry" label. A Chandelier trailing stop-loss runs invisibly in the background, only printing the "Exit" label when the structural trend definitively breaks.
Stealth Volume & The Golden Pocket: Volume panes ruin chart scaling. Instead, this engine highlights specific candlesticks in Yellow if the price enters the Fibonacci Golden Pocket (0.500 - 0.618) and buying volume spikes 1.5x above the 20-period average. It provides instant visual confirmation of institutional defense.
Turtle Soup Liquidity Sweeps: Retail traders place stop-losses directly at swing lows. Institutions hunt them. If the price wicks below the dynamic support line but closes back above it, the engine prints a subtle Blue "X" to identify the liquidity sweep—a high-probability reversal setup.
Multi-Timeframe (MTF) Telemetry HUD: The top-right dashboard acts as your master control center. It simultaneously scans the 1H, 4H, 1D, and 1W charts, displaying their 200 SMA trend alignment via a clean traffic-light system (🟢/🔴) so you never trade against the macro regime.
Dynamic Risk Management: The HUD tracks the current volatility state. If the ATR compresses significantly, it flags a green SQUEEZE, warning you of an imminent explosive move. It also auto-calculates the System Risk/Reward ratio for the current pocket, illuminating in green only if the setup offers a mathematical edge of 1:1.5 or greater.
How to Execute the Khajanchi System
Verify the Context: Check the HUD. Ensure the MTF Bias aligns with your intended trade direction and the Regime is confirmed.
Wait for the Setup: Let the price pull back into the shaded Golden Pocket or sweep the dynamic support/resistance levels.
Confirm the Trap: Look for a Stealth Volume highlight (Yellow Candle) or a Liquidity Sweep (Blue "X").
Execute & Trail: Enter on the engine's "Entry" signal. Let the invisible ATR-driven algorithm manage the trade until the "Exit" label appears.
Release Notes (Changelog for Update)
Major Architectural Upgrades [Master Setup V2]
Added Stealth Volume Confirmation: Removed the bottom volume pane to fix vertical chart compression. Volume spikes (>1.5x average) inside the Golden Pocket are now confirmed via Yellow candlestick highlights.
Added Liquidity Sweep Detection: The engine now tracks stop-loss hunting. A subtle Blue "X" identifies when price sweeps below support and reverses (Turtle Soup).
Upgraded to Active Execution Engine: Cleared historical chart clutter. "Entry" and "Exit" markers now exclusively track the active, ongoing swing structure.
Invisible Trailing Stop: Removed the visible Chandelier stepline to preserve chart aesthetics. The ATR trailing stop now calculates invisibly in the background to trigger your Exit signals.
Overhauled Telemetry HUD:
Integrated a live Multi-Timeframe (MTF) scanner (1H, 4H, 1D, 1W).
Added automated Risk/Reward conditional coloring (Green for R:R ≥ 1.5, Grey for subpar setups).
Added a Volatility State tracker (Normal, Squeeze, Expanding) to identify coiled momentum before breakouts.
Release Note
[Major Update: V4 Top-Down Master Dashboard]We have completely overhauled the execution logic to transform this script into a true Top-Down Algorithmic Dashboard. You no longer need to switch timeframes or decipher chart clutter.
Single-Timeframe "Radar" Execution: We engineered a background radar that pulls 4H intraday trigger data (Volume Spikes & Liquidity Sweeps) directly into your 1D chart. Trade the daily structure while the engine snipes the 4-hour triggers for you.
Dynamic Master Checklist: Added a live 3-step execution checklist to the HUD. It tracks Macro Alignment, Pocket Zone Entry, and 4H Trap Confirmation. When all three align, the HUD switches from "WAITING" to a green "READY / EXECUTE".
Zero Chart Clutter: Removed all historical Entry/Exit markers and invisible trailing stop lines. The workspace is now strictly dedicated to the active, ongoing price action.
Aesthetic Bounding: Capped all infinite dynamic support, resistance, and Fibonacci lines exactly at their price labels to ensure they never overlap with the telemetry dashboard.
Unified Master Alert: Re-coded the alert system. You now only need one alert per asset. It fires exclusively when the HUD Master Checklist achieves full 🟢 alignment.
Release Note
[Major Update: V6 - Dynamic ATR Stop-Loss Safety Check]We have integrated a highly advanced risk-management mechanism directly into the Master Checklist. The engine now actively guards your capital against random intraday market noise.
Integrated ATR Safety Barrier: The HUD now dynamically measures the exact distance from the current live price down to your 0.786 structural stop-loss.
Noise Filtering: It compares this stop-loss distance against the asset's current Average True Range (ATR). If your stop is tighter than 1 full ATR, the setup is mathematically too close to the "chop zone."
Visual Safety Gate: Row 4 on the HUD now displays 🟢 Safe (>1 ATR) for secure stops, or flashes 🔴 Too Tight if the risk of a random wick stopping you out is too high.
Execution Block: The final "READY / EXECUTE" status will now remain in "WAITING" if your stop-loss distance fails the minimum 1 ATR safety check, physically preventing you from taking mathematically fragile trades.
Release Note
[Major Update V7: ADX Chop Filter, Dynamic HUD Positioning & Visual Overhaul]The Khajanchi Master Engine has been upgraded to eliminate sideways market noise, improve chart visibility, and streamline the visual experience for swing traders.
ADX Chop & Consolidation Filter: We integrated an ADX(14) threshold to quantify trend strength. If momentum flatlines and the asset enters consolidation, the engine overrides the standard Bullish/Bearish logic. The dashboard will flag the market as RANGING / CHOP (Amber) and actively lock the execution status to CHOP FILTERED to protect your capital from false breakouts.
Reconfigurable HUD Positioning: You are no longer locked into a fixed dashboard location. The settings menu now includes a dropdown to snap the Telemetry HUD to any corner of your chart (Top Right, Bottom Right, Top Left, Bottom Left), ensuring it never obstructs live price action.
Overlap Collision Fix: The dynamic structural lines and Fibonacci zones have been re-coded with a tighter X-coordinate offset. Lines now terminate precisely at their data labels, creating a clean boundary that will never bleed into or overlap with your HUD.
Streamlined Institutional Palette: To maximize visual clarity, the shallow 0.236 retracement level has been completely removed, decluttering the workspace. The remaining structural boundaries and Golden Pocket zones have been unified under a crisp, high-contrast color palette (Deep Red, Teal, Slate Blue, Amber Gold, and Royal Blue) perfectly aligned with Khajanchi Wealth's visual identity.
Release Note
**[Major Update V12: Advanced Live Trade Journal & Date-Anchored Visuals]**We have completely upgraded the post-execution trade tracking system to serve as a comprehensive, dynamic trade journal directly on your chart.
* **Date-Anchored Trade Lines:** Infinite historical lines are gone. By inputting your exact "Entry Date" (Year, Month, Day) in the settings, your Entry, Stop-Loss, and Target lines will anchor to that specific day and project strictly forward into the future. Your historical price action remains completely spotless.
* **Complete Visual Customization:** You now have full control over your active trade lines. In addition to custom Khajanchi color routing, you can now adjust the Line Thickness (1 to 4) and select your preferred Line Style (Solid, Dotted, or Dashed).
* **Upgraded Journal Metrics:** The Live Trade Management HUD now tracks your **Days Active** so you know exactly how long your capital has been deployed. We also added a **Total Risk Amount** calculator that automatically computes your exact fiat capital at risk based on your entry, stop-loss, and quantity.
* **Dynamic UI Feedback:** The Trade Journal HUD has been given a high-contrast aesthetic overhaul. The font sizes for your live profits have been enlarged for quick reading, and the "Management Action" row now features dynamic color-shifting backgrounds (e.g., glowing green when your target is hit, amber when it's time to trail your stop to breakeven, and red if your stop is breached).
* **Engine Optimization:** Fully patched and optimized to comply with the strict new TradingView Pine Script v6 compiler standards.
Release Note
[Major Update V14: Master Trade Ledger (Infinite Portfolio Tracking)]Infinite Scale: Scrapped the individual UI slots to bypass TradingView's input limitations. You can now track an unlimited number of active trades using the new "Master Trade Ledger" text box.
Format: Simply input your active trades in CSV format: TICKER, L/S, QTY, ENTRY, SL, TARGET, Y, M, D. The algorithm seamlessly parses up to 40,000 characters of data instantly.
Dynamic Background Routing: The engine silently scans your Ledger, slices the data, and checks if any row matches your current chart. If it finds a match, the Date-Anchored lines and the Khajanchi Live Journal pop up instantly. If there is no match, the chart remains completely clean.
Release Note
[Release Notes Update: V15 - Dual Target (TP1/TP2) Integration]Dual Target Plotting: The Master Trade Ledger has been expanded to support two simultaneous profit targets (TP1 for structural Swing Highs, and TP2 for Trend-Based Fib Extension runners).
Ledger Format Change: Ensure your string matches the new 10-input format: TICKER, L/S, QTY, ENTRY, SL, TP1, TP2, YEAR, MONTH, DAY.
Dynamic Exit Feedback: The Trade Journal HUD will now actively guide you through scaling out of your position. Once TP1 is hit, the Management Action row will lock in green and display TP1 HIT - RUNNER ACTIVE. It will only call for a FULL EXIT once TP2 is mathematically breached.
Release Note
[Release Notes Update: V16 - Static 1.618 Fib Expansion & Dynamic Math Parsing]Dual Target Pre-Calculation: The Master Setup HUD now actively projects both Target 1 (Base Swing liquidity) and Target 2 (1.618 Fib Extension).
Repaint Mitigation: By locking Target 2 to the mathematical extension of the original A-B impulse wave, your limit-sell orders remain completely static. The target will not repaint or shift while your trade fluctuates inside the Golden Pocket.
Bearish Auto-Inversion: The core logic has been optimized so that if the trend flips (e.g., Bearish regime), the script automatically subtracts the 1.618 extension downward to project accurate short-selling targets.
Split R:R Tracking: The Telemetry Dashboard now calculates your exact risk-to-reward ratio for both TP1 and TP2 simultaneously based on the live current price.
Release Note
[Release Notes Update: V18 - Identifier Fix]Compilation Patch: Re-declared the prev_low and prev_high variables that were accidentally omitted during the V17 anchor lock rewrite. The Liquidity Sweep detection module (Turtle Soup) is now fully functional and properly scanning historical pivots.
Release Note
[Release Notes Update: V20 - Adaptive Data Fallback & HUD Fixes]New Coin Data Fallback: Fixed a critical bug where newly launched coins (like AERO) with fewer than 200 days of history would break the engine's regime detection. If the 200 SMA is mathematically missing (na), the script now seamlessly falls back to the 50 EMA, and then to raw price action, guaranteeing accurate Bullish/Bearish classification regardless of how new the token is.
HUD Safety Fix: The MTF indicator in the HUD will now display a grey ⚪ instead of a red 🔴 if the moving average data simply hasn't formed yet, preventing false bearish signals on newly launched assets.
Release Note
"V47.0 - UI optimization. Migrated the Master Trade Ledger and active position tracking journal exclusively to the Master Pro module."Release Note
KW Fibs (v2.3) - The Visual Optimization UpdateThis update focuses on solving chart clutter and removing visual decision fatigue during tight price action.
[] Visual Clearance Offset: To ensure the current price action is never obstructed, the Fibonacci boundary lines and their accompanying text labels are now pushed 8 bars into the future (to the right of the current candle).
[] Merged Golden Pocket Label: The separate 0.500 and 0.618 text tags were redundant and noisy. They have been merged into a single, centralized "Golden Pocket" label that dynamically tracks the center of the pullback zone, while displaying the exact upper and lower price thresholds within brackets. The structural yellow and orange border lines remain exactly where they are.
Release Note
[] Golden Pocket Label Fix: Corrected an issue where the 0.500 and 0.618 text tags were still rendering as separate, overlapping labels. They have now been properly merged into a single, clean "Golden Pocket" label that dynamically tracks the center of the pullback zone, while displaying the exact upper and lower price thresholds within brackets.
[] Offset Alignment: Confirmed that the 8-bar future offset is properly applied to push all boundary lines and text labels away from the current price action, ensuring an unobstructed view of the chart.

คำจำกัดสิทธิ์ความรับผิดชอบ
ข้อมูลและบทความไม่ได้มีวัตถุประสงค์เพื่อก่อให้เกิดกิจกรรมทางการเงิน, การลงทุน, การซื้อขาย, ข้อเสนอแนะ หรือคำแนะนำประเภทอื่น ๆ ที่ให้หรือรับรองโดย TradingView อ่านเพิ่มเติมใน ข้อกำหนดการใช้งาน
คำจำกัดสิทธิ์ความรับผิดชอบ
ข้อมูลและบทความไม่ได้มีวัตถุประสงค์เพื่อก่อให้เกิดกิจกรรมทางการเงิน, การลงทุน, การซื้อขาย, ข้อเสนอแนะ หรือคำแนะนำประเภทอื่น ๆ ที่ให้หรือรับรองโดย TradingView อ่านเพิ่มเติมใน ข้อกำหนดการใช้งาน