ที่อัปเดต:
FCBI Brake Pressure
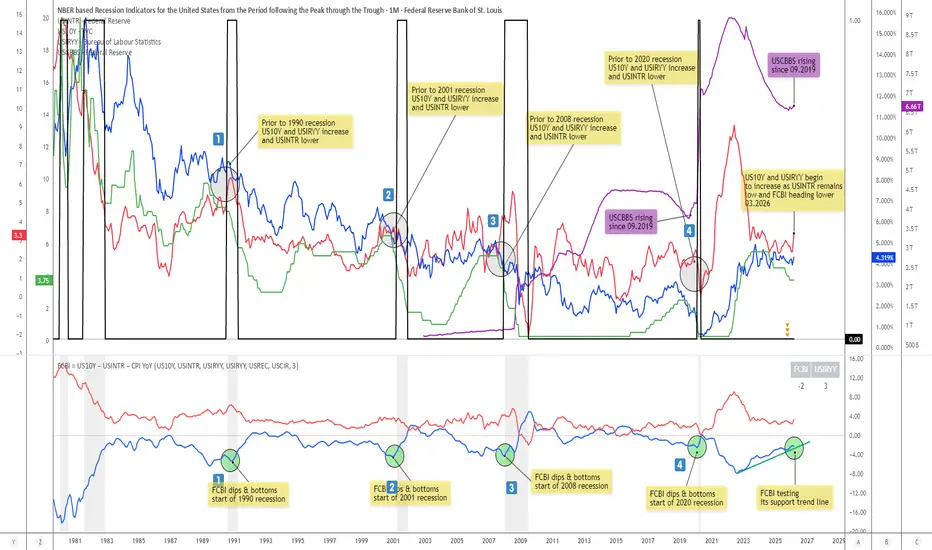
Brake Pressure (FCBI − USIRYY)
Concept
The Brake Pressure indicator quantifies whether the bond market is braking or releasing liquidity relative to real yields (USIRYY).
It is derived from the Financial-Conditions Brake Index (FCBI) and expresses the balance between long-term yield pressure and real-rate dynamics.
Formula
Brake Pressure = FCBI − USIRYY
where FCBI = (US10Y) − (USINTR) − (CPI YoY)
Purpose
While FCBI measures the intensity of financial-condition pressure, Brake Pressure shows when that brake is being applied or released.
It captures the turning point of liquidity transmission in the financial system.
How to Read
Brake Pressure < 0 (orange) → Brake engaged → financial conditions tighter than real-rate baseline; liquidity constrained.
Brake Pressure ≈ 0 → Neutral zone → transition phase between tightening and easing.
Brake Pressure > 0 (teal) → Brake released → financial conditions looser than real-rate baseline; liquidity flows freely → late-cycle setup before recession.
Zero-Cross Logic
Cross ↑ above 0 → FCBI > USIRYY → brake released → liquidity acceleration → typically 6–18 months before recession.
Cross ↓ below 0 → FCBI < USIRYY → brake re-engaged → tightening resumes.
Historical Behavior
Each major U.S. recession (2001, 2008, 2020) was preceded by a Brake Pressure cross above zero after a negative phase, signaling that long yields had stopped resisting Fed cuts and liquidity was expanding.
Practical Use
• Identify late-cycle turning points and liquidity inflection phases.
• Combine with FCBI for a complete macro transmission picture.
• Watch for sustained positive readings as early macro-recession warnings.
Current Example (Oct 2025)
FCBI ≈ −3.1, USIRYY ≈ +3.0 → Brake Pressure ≈ −6.1 → Brake still engaged. When this crosses above 0, it signals that liquidity is free flowing and the recession countdown has begun.
Summary
FCBI shows how tight the brake is. Brake Pressure shows when the brake releases.
When Brake Pressure > 0, the system has entered the liquidity-expansion phase that historically precedes a U.S. recession.
Concept
The Brake Pressure indicator quantifies whether the bond market is braking or releasing liquidity relative to real yields (USIRYY).
It is derived from the Financial-Conditions Brake Index (FCBI) and expresses the balance between long-term yield pressure and real-rate dynamics.
Formula
Brake Pressure = FCBI − USIRYY
where FCBI = (US10Y) − (USINTR) − (CPI YoY)
Purpose
While FCBI measures the intensity of financial-condition pressure, Brake Pressure shows when that brake is being applied or released.
It captures the turning point of liquidity transmission in the financial system.
How to Read
Brake Pressure < 0 (orange) → Brake engaged → financial conditions tighter than real-rate baseline; liquidity constrained.
Brake Pressure ≈ 0 → Neutral zone → transition phase between tightening and easing.
Brake Pressure > 0 (teal) → Brake released → financial conditions looser than real-rate baseline; liquidity flows freely → late-cycle setup before recession.
Zero-Cross Logic
Cross ↑ above 0 → FCBI > USIRYY → brake released → liquidity acceleration → typically 6–18 months before recession.
Cross ↓ below 0 → FCBI < USIRYY → brake re-engaged → tightening resumes.
Historical Behavior
Each major U.S. recession (2001, 2008, 2020) was preceded by a Brake Pressure cross above zero after a negative phase, signaling that long yields had stopped resisting Fed cuts and liquidity was expanding.
Practical Use
• Identify late-cycle turning points and liquidity inflection phases.
• Combine with FCBI for a complete macro transmission picture.
• Watch for sustained positive readings as early macro-recession warnings.
Current Example (Oct 2025)
FCBI ≈ −3.1, USIRYY ≈ +3.0 → Brake Pressure ≈ −6.1 → Brake still engaged. When this crosses above 0, it signals that liquidity is free flowing and the recession countdown has begun.
Summary
FCBI shows how tight the brake is. Brake Pressure shows when the brake releases.
When Brake Pressure > 0, the system has entered the liquidity-expansion phase that historically precedes a U.S. recession.
Release Note
The FCBI Brake Pressure indicator is designed to measure the intensity and progression of market-driven tightening pressure within the financial system.It builds on the core FCBI framework by not only identifying when financial conditions begin to tighten, but also how much pressure is being applied over time.
🧠 Concept
Financial conditions often tighten before central bank policy reacts, driven primarily by movements in the bond market.
The Brake Pressure variant focuses on this dynamic by tracking:
US10Y Treasury Yield as the primary source of tightening pressure
USINTR as the lagging policy anchor
USIRYY as the macro context
Rather than simply signaling tightening, this indicator evaluates:
How forcefully the bond market is acting as a “brake” on the economy
⚙️ What “Brake Pressure” represents
Brake Pressure reflects the strength and persistence of divergence between:
Rising yields and inflation
vs
Slower-moving or stable policy rates
This divergence creates internal stress within financial conditions, which can build gradually before becoming visible in broader markets.
📈 How to interpret
🔻 Increasing Brake Pressure
Indicates tightening forces are intensifying
Suggests growing divergence between market conditions and policy stance
Financial stress is building beneath the surface
👉 Often observed during early to mid-stage macro stress phases
🔺 Decreasing Brake Pressure
Indicates relief or stabilization
Suggests either:
Yields are easing
Policy is catching up
Financial conditions are becoming less restrictive
⚠️ Extended high pressure
Signals a sustained imbalance
Historically associated with:
Increased fragility in the system
Higher likelihood of regime shifts (policy reaction, volatility, or economic slowdown)
🔁 Historical behavior
Across macro cycles, periods of rising Brake Pressure have tended to:
Precede tightening cycles and economic slowdowns
Reflect phases where the bond market forces adjustment
Transition into turning points once pressure is either:
Released (through easing or stabilization)
or resolved (through policy tightening or economic contraction)
🎯 Use case
The FCBI Brake Pressure indicator is best used to:
Track the intensity of financial tightening over time
Identify hidden stress buildup before it becomes visible
Complement broader macro analysis, including:
Liquidity conditions
Policy shifts
Market regime transitions
⚠️ Important note
Brake Pressure is not a direct recession or timing signal.
Instead, it highlights:
🟡 The buildup and evolution of internal financial stress
The outcome depends on how the system resolves that pressure through:
Policy response
Liquidity conditions
Market adjustment
🧭 Summary
The FCBI Brake Pressure indicator provides insight into:
How strongly and persistently financial conditions are tightening beneath the surface
—offering a dynamic view of macro pressure buildup that often precedes major market and economic transitions.

คำจำกัดสิทธิ์ความรับผิดชอบ
ข้อมูลและบทความไม่ได้มีวัตถุประสงค์เพื่อก่อให้เกิดกิจกรรมทางการเงิน, การลงทุน, การซื้อขาย, ข้อเสนอแนะ หรือคำแนะนำประเภทอื่น ๆ ที่ให้หรือรับรองโดย TradingView อ่านเพิ่มเติมใน ข้อกำหนดการใช้งาน
คำจำกัดสิทธิ์ความรับผิดชอบ
ข้อมูลและบทความไม่ได้มีวัตถุประสงค์เพื่อก่อให้เกิดกิจกรรมทางการเงิน, การลงทุน, การซื้อขาย, ข้อเสนอแนะ หรือคำแนะนำประเภทอื่น ๆ ที่ให้หรือรับรองโดย TradingView อ่านเพิ่มเติมใน ข้อกำหนดการใช้งาน