Dow Jones 30 - Donut
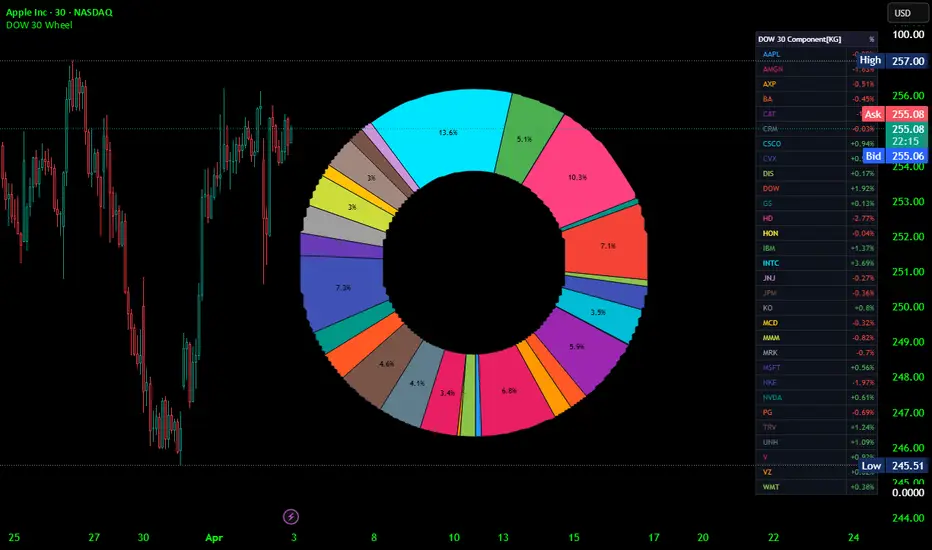
This indicator creates a circular "donut" or pie-chart that visualizes the absolute percentage changes of all 30 Dow Jones Industrial Average components over a user‑defined timeframe. Each component is represented by a colored slice whose angular size (i.e., its share of the full 360°) is proportional to how much the stock’s price moved (in absolute terms) during the selected period. In other words, stocks that moved the most get the largest slices.
A separate legend table lists all 30 tickers with their signed percentage change (positive or negative) and uses the same colors as the donut slices. This allows traders to quickly see:
Which Dow components are experiencing the highest volatility (largest absolute move).
Whether each component is up or down (green for positive, red for negative).
The relative contribution of each stock to the total movement of the index.
The donut chart is drawn on a fixed canvas at the right side of the chart, independent of the price scale, so it does not interfere with the main price action.
Time Frame>>>>>>>>>>>>>>>
The indicator fetches data for a user‑selectable timeframe. The default setting is D (daily), meaning it compares today’s close with the previous day’s close. Using the indicator’s settings, you can change the timeframe to any value supported by Trading-View (e.g., 60 for 60 minutes, W for weekly, M for monthly). The same timeframe is applied to all 30 stocks simultaneously.
How to Use>>>>>>>>>>>>
Add the indicator to any chart in Trading-View. Because it uses a fixed canvas, the underlying chart symbol does not matter – the indicator works standalone.
Adjust the “Timeframe” input (default = “D”) to analyze price changes over a different period, such as weekly or intraday.
Set the “Horizontal Offset” (default = 60) to move the donut chart left or right. The offset determines how many bars from the last bar the donut’s center is placed. Increase the value to shift the donut further to the right, decrease to bring it closer to the price bars.
Interpret the donut chart:
Each slice corresponds to one Dow component (see legend for ticker names).
Slice size = that stock’s absolute percentage change divided by the sum of all absolute percentage changes. Larger slices indicate bigger price swings.
Colors are fixed per ticker (e.g., AAPL is blue, MSFT is purple) to make identification easier.
If a slice is large enough (span ≥ 10°), a small label shows the slice’s percentage of the total absolute movement (not the signed change).
Read the legend table (positioned at the middle right of the chart):
Left column: ticker names, each in its slice color.
Right column: signed percentage change with a “+” or “−” sign, coloured green (positive) or red (negative). This tells you not only the magnitude but also the direction of each stock’s move.
Refresh – the indicator recalculates on every new bar. The donut and legend are updated only on the last bar (most recent complete bar of the selected timeframe) to conserve resources.
Important Notes on Behavior:-
The script makes exactly 30 data requests (one per component) to fetch both the current and previous close. This respects Trading-View’s limit of 40 security calls.
The donut uses absolute percentage changes, so a stock that drops 5% and a stock that rises 5% contribute equally to the slice size.
If all absolute changes are zero (e.g., on a holiday with no price movement), the script defaults to equal slice sizes (each 3.33% of the donut) to keep the visualization intact.
The indicator draws only once per bar (on barstate.islast) and deletes previous drawings to avoid clutter.
Disclaimer:=
This indicator is provided for informational and educational purposes only. It does not constitute financial advice, trading recommendations, or any form of solicitation to buy or sell securities. Past price movements do not guarantee future results. The data used by the indicator may be delayed or inaccurate, and the user assumes all risks associated with any trading decisions made while using this tool. Always conduct your own research and consult a qualified financial advisor before making investment decisions.
A separate legend table lists all 30 tickers with their signed percentage change (positive or negative) and uses the same colors as the donut slices. This allows traders to quickly see:
Which Dow components are experiencing the highest volatility (largest absolute move).
Whether each component is up or down (green for positive, red for negative).
The relative contribution of each stock to the total movement of the index.
The donut chart is drawn on a fixed canvas at the right side of the chart, independent of the price scale, so it does not interfere with the main price action.
Time Frame>>>>>>>>>>>>>>>
The indicator fetches data for a user‑selectable timeframe. The default setting is D (daily), meaning it compares today’s close with the previous day’s close. Using the indicator’s settings, you can change the timeframe to any value supported by Trading-View (e.g., 60 for 60 minutes, W for weekly, M for monthly). The same timeframe is applied to all 30 stocks simultaneously.
How to Use>>>>>>>>>>>>
Add the indicator to any chart in Trading-View. Because it uses a fixed canvas, the underlying chart symbol does not matter – the indicator works standalone.
Adjust the “Timeframe” input (default = “D”) to analyze price changes over a different period, such as weekly or intraday.
Set the “Horizontal Offset” (default = 60) to move the donut chart left or right. The offset determines how many bars from the last bar the donut’s center is placed. Increase the value to shift the donut further to the right, decrease to bring it closer to the price bars.
Interpret the donut chart:
Each slice corresponds to one Dow component (see legend for ticker names).
Slice size = that stock’s absolute percentage change divided by the sum of all absolute percentage changes. Larger slices indicate bigger price swings.
Colors are fixed per ticker (e.g., AAPL is blue, MSFT is purple) to make identification easier.
If a slice is large enough (span ≥ 10°), a small label shows the slice’s percentage of the total absolute movement (not the signed change).
Read the legend table (positioned at the middle right of the chart):
Left column: ticker names, each in its slice color.
Right column: signed percentage change with a “+” or “−” sign, coloured green (positive) or red (negative). This tells you not only the magnitude but also the direction of each stock’s move.
Refresh – the indicator recalculates on every new bar. The donut and legend are updated only on the last bar (most recent complete bar of the selected timeframe) to conserve resources.
Important Notes on Behavior:-
The script makes exactly 30 data requests (one per component) to fetch both the current and previous close. This respects Trading-View’s limit of 40 security calls.
The donut uses absolute percentage changes, so a stock that drops 5% and a stock that rises 5% contribute equally to the slice size.
If all absolute changes are zero (e.g., on a holiday with no price movement), the script defaults to equal slice sizes (each 3.33% of the donut) to keep the visualization intact.
The indicator draws only once per bar (on barstate.islast) and deletes previous drawings to avoid clutter.
Disclaimer:=
This indicator is provided for informational and educational purposes only. It does not constitute financial advice, trading recommendations, or any form of solicitation to buy or sell securities. Past price movements do not guarantee future results. The data used by the indicator may be delayed or inaccurate, and the user assumes all risks associated with any trading decisions made while using this tool. Always conduct your own research and consult a qualified financial advisor before making investment decisions.

คำจำกัดสิทธิ์ความรับผิดชอบ
ข้อมูลและบทความไม่ได้มีวัตถุประสงค์เพื่อก่อให้เกิดกิจกรรมทางการเงิน, การลงทุน, การซื้อขาย, ข้อเสนอแนะ หรือคำแนะนำประเภทอื่น ๆ ที่ให้หรือรับรองโดย TradingView อ่านเพิ่มเติมใน ข้อกำหนดการใช้งาน
คำจำกัดสิทธิ์ความรับผิดชอบ
ข้อมูลและบทความไม่ได้มีวัตถุประสงค์เพื่อก่อให้เกิดกิจกรรมทางการเงิน, การลงทุน, การซื้อขาย, ข้อเสนอแนะ หรือคำแนะนำประเภทอื่น ๆ ที่ให้หรือรับรองโดย TradingView อ่านเพิ่มเติมใน ข้อกำหนดการใช้งาน