Titpaud Trend Arcs
Titpaud Trend Arcs
WHAT IT DOES
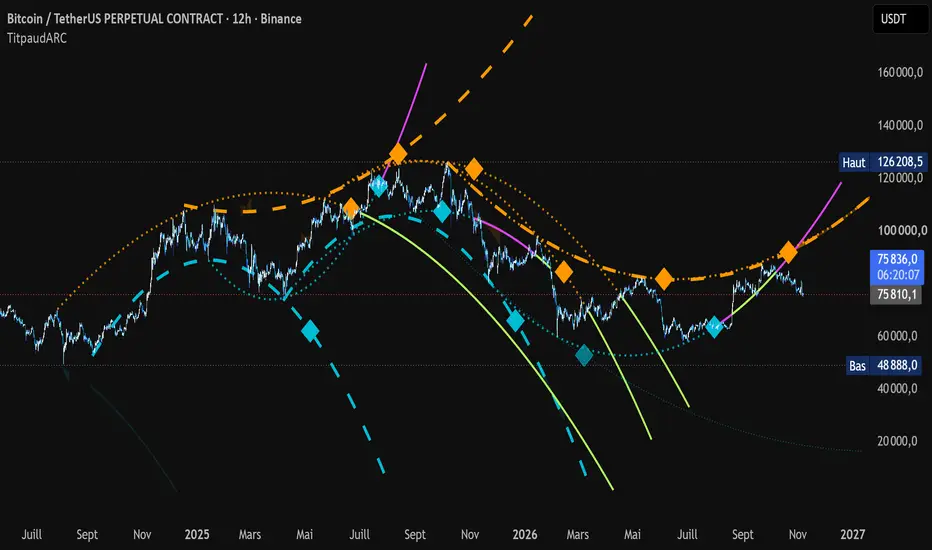
Titpaud Trend Arcs draws curved trendlines (arcs) through the swing highs and the swing lows of the chart and projects them forward as possible resistance and support.
A straight trendline assumes the price keeps the same speed. Real swings often speed up or slow down: a top forms as a dome, a bottom as a bowl, and a trend that loses momentum bends. Each arc is a parabola fitted on the latest swings of one side, so it follows that bend and shows where the curve would pass next if the move keeps its shape.
Orange arcs go through the highs (resistance), cyan arcs through the lows (support). When an arc breaks, it goes on in another color with the opposite role (magenta = broken support now acting as resistance, light green = broken resistance now acting as support).
HOW IT WORKS
1. Pivots: a pivot high is a bar whose high is the highest of the N bars on each side; pivot lows work the same way. The pivot length is 15 bars on the x1 layer, multiplied by 4, 16 or 64 for the larger layers (x4 = 60 bars on each side by default). Wicks or candle bodies can be used.
2. New arc: when a pivot is confirmed and joins no running arc, a least-squares parabola is fitted on the latest 3 to 5 pivots of its kind. Only one arc is kept: the one with the most pivots that still passes near each of them (non-accelerating arcs first).
3. Living arcs: a new pivot that comes within 1.5 ATR50 of a running arc of the same role joins it. The arc is fitted again on all its pivots (8 at most) and goes on as one long arc. The new curve is joined smoothly to the old one.
4. Projection: each arc is drawn ahead for 4 times the average gap between its pivots. The projection starts again when the price touches the arc without breaking it, and it is prolonged while the arc is coming toward the price, while it stays near the price, or when it is flat.
5. Break and polarity flip: a close beyond the arc by 0.5 ATR50 (plus the zone margin) breaks it. The arc then changes role and color, up to 4 times. It ends after the last allowed break, or when its projection runs out with no new pivot and no break.
6. Far from the price: an arc is cut only when it is beyond its pivots by 30 ATR50 AND far from the price (the larger of 5 ATR50 and 2 x the height of its own pivots) AND still moving away. A small arc on 1m and a large arc on 1D are judged at their own size.
7. Accelerating arcs (all pivots on one branch that bends the way the price already goes, rising faster and faster or falling faster and faster) rarely hold: they are hidden by default (option faded or normal).
8. Confirmed arcs (a later pivot joined them, or they already changed role) are drawn bold; unconfirmed arcs thin and pale (option to hide them).
9. Merged zones: where two running arcs of the same role agree within 2 ATR50, a band is drawn. The more arcs agree, the darker the band.
10. Duplicates: when two arcs of the same role agree over their whole common projection, only the one with the most pivots is drawn.
11. Curvature turns: when the arcs of one side change from domes to bowls (or the reverse), the new arc is drawn dashed and thicker. Optional label on the pivot ("both" when the other side already bends the same way).
12. Birth marker: a small diamond shows the bar where each arc was born (when its last pivot was confirmed).
REPAINT AND DELAY
An arc is computed only on confirmed pivots, so it appears with a delay of N bars (60 bars on the x4 layer). The part already drawn is never changed: when a new pivot joins an arc, only the part after that bar is drawn again.
The arc is drawn back to its first pivot. Left of the diamond, the arc was fitted on pivots that were already known, so touches there prove nothing. Only the part right of the diamond is a real forecast. Keep this in mind when you look at past arcs.
TradingView limits drawings ahead of the last bar to 499 bars: only that part is limited, and it is drawn further as new bars come.
SETTINGS
- Display: arcs of the highs and of the lows, broken arcs (polarity flip), merged zones and past merged zones, duplicate arcs, unconfirmed arcs, curvature turn arcs and labels, pivot dots, birth markers (size and transparency).
- Pivots: wicks or bodies, pivot length of the x1 layer, layer x1 / x4 / x16 / x64.
- Arcs: number of pivots for a new arc, one arc per new pivot, distance for a pivot to join an arc, max pivots in one arc, agreement distance and margin of the merged zones, projection length, stop distance beyond the pivots, far-from-the-price distance (ATR50 and arc size), flat arcs, arcs coming toward or near the price, hiding the projection far from the price, renewal on a touch, break distance, accelerating arcs, running arcs kept, max role changes, curvature turn threshold, ended arcs kept on the chart.
- Colors: highs, lows, broken support, broken resistance, merged zone transparency.
TESTED, AND WHAT THE TEST SHOWED
Before publishing, the default settings were reproduced in Python and measured on 14 crypto markets (BTC, ETH, SOL, XRP, gold PAXG and others), from 3m to 1D, 2020 to 2026, split into two groups of years. Each touch of an arc after its birth was compared with the same arc shifted by 2 ATR, with the same arc placed at random dates, and with arcs computed the same way on shuffled prices.
Result: the price rebounds at the arcs about as often as at those control lines. Young arcs and arcs crossing a golden pocket did not do clearly better either. A line drawn through recent swings sits where the price tends to come back and hesitate anyway, so the rebounds you see on the chart are real but not specific to the arc.
So this is a chart-reading tool, not a signal. It helps to see the shape of a move (domes, bowls, loss of speed, role changes) and where a curved trend would pass next.
LIMITATIONS
The arcs are a geometric estimate. They do not predict whether the price will hold or break a level, and they are not a trading system on its own. Arcs fitted on few pivots can bend sharply and leave the chart quickly. Use it with your own analysis and risk management.
Original code by Titpaud, published open source under the Mozilla Public License 2.0.
WHAT IT DOES
Titpaud Trend Arcs draws curved trendlines (arcs) through the swing highs and the swing lows of the chart and projects them forward as possible resistance and support.
A straight trendline assumes the price keeps the same speed. Real swings often speed up or slow down: a top forms as a dome, a bottom as a bowl, and a trend that loses momentum bends. Each arc is a parabola fitted on the latest swings of one side, so it follows that bend and shows where the curve would pass next if the move keeps its shape.
Orange arcs go through the highs (resistance), cyan arcs through the lows (support). When an arc breaks, it goes on in another color with the opposite role (magenta = broken support now acting as resistance, light green = broken resistance now acting as support).
HOW IT WORKS
1. Pivots: a pivot high is a bar whose high is the highest of the N bars on each side; pivot lows work the same way. The pivot length is 15 bars on the x1 layer, multiplied by 4, 16 or 64 for the larger layers (x4 = 60 bars on each side by default). Wicks or candle bodies can be used.
2. New arc: when a pivot is confirmed and joins no running arc, a least-squares parabola is fitted on the latest 3 to 5 pivots of its kind. Only one arc is kept: the one with the most pivots that still passes near each of them (non-accelerating arcs first).
3. Living arcs: a new pivot that comes within 1.5 ATR50 of a running arc of the same role joins it. The arc is fitted again on all its pivots (8 at most) and goes on as one long arc. The new curve is joined smoothly to the old one.
4. Projection: each arc is drawn ahead for 4 times the average gap between its pivots. The projection starts again when the price touches the arc without breaking it, and it is prolonged while the arc is coming toward the price, while it stays near the price, or when it is flat.
5. Break and polarity flip: a close beyond the arc by 0.5 ATR50 (plus the zone margin) breaks it. The arc then changes role and color, up to 4 times. It ends after the last allowed break, or when its projection runs out with no new pivot and no break.
6. Far from the price: an arc is cut only when it is beyond its pivots by 30 ATR50 AND far from the price (the larger of 5 ATR50 and 2 x the height of its own pivots) AND still moving away. A small arc on 1m and a large arc on 1D are judged at their own size.
7. Accelerating arcs (all pivots on one branch that bends the way the price already goes, rising faster and faster or falling faster and faster) rarely hold: they are hidden by default (option faded or normal).
8. Confirmed arcs (a later pivot joined them, or they already changed role) are drawn bold; unconfirmed arcs thin and pale (option to hide them).
9. Merged zones: where two running arcs of the same role agree within 2 ATR50, a band is drawn. The more arcs agree, the darker the band.
10. Duplicates: when two arcs of the same role agree over their whole common projection, only the one with the most pivots is drawn.
11. Curvature turns: when the arcs of one side change from domes to bowls (or the reverse), the new arc is drawn dashed and thicker. Optional label on the pivot ("both" when the other side already bends the same way).
12. Birth marker: a small diamond shows the bar where each arc was born (when its last pivot was confirmed).
REPAINT AND DELAY
An arc is computed only on confirmed pivots, so it appears with a delay of N bars (60 bars on the x4 layer). The part already drawn is never changed: when a new pivot joins an arc, only the part after that bar is drawn again.
The arc is drawn back to its first pivot. Left of the diamond, the arc was fitted on pivots that were already known, so touches there prove nothing. Only the part right of the diamond is a real forecast. Keep this in mind when you look at past arcs.
TradingView limits drawings ahead of the last bar to 499 bars: only that part is limited, and it is drawn further as new bars come.
SETTINGS
- Display: arcs of the highs and of the lows, broken arcs (polarity flip), merged zones and past merged zones, duplicate arcs, unconfirmed arcs, curvature turn arcs and labels, pivot dots, birth markers (size and transparency).
- Pivots: wicks or bodies, pivot length of the x1 layer, layer x1 / x4 / x16 / x64.
- Arcs: number of pivots for a new arc, one arc per new pivot, distance for a pivot to join an arc, max pivots in one arc, agreement distance and margin of the merged zones, projection length, stop distance beyond the pivots, far-from-the-price distance (ATR50 and arc size), flat arcs, arcs coming toward or near the price, hiding the projection far from the price, renewal on a touch, break distance, accelerating arcs, running arcs kept, max role changes, curvature turn threshold, ended arcs kept on the chart.
- Colors: highs, lows, broken support, broken resistance, merged zone transparency.
TESTED, AND WHAT THE TEST SHOWED
Before publishing, the default settings were reproduced in Python and measured on 14 crypto markets (BTC, ETH, SOL, XRP, gold PAXG and others), from 3m to 1D, 2020 to 2026, split into two groups of years. Each touch of an arc after its birth was compared with the same arc shifted by 2 ATR, with the same arc placed at random dates, and with arcs computed the same way on shuffled prices.
Result: the price rebounds at the arcs about as often as at those control lines. Young arcs and arcs crossing a golden pocket did not do clearly better either. A line drawn through recent swings sits where the price tends to come back and hesitate anyway, so the rebounds you see on the chart are real but not specific to the arc.
So this is a chart-reading tool, not a signal. It helps to see the shape of a move (domes, bowls, loss of speed, role changes) and where a curved trend would pass next.
LIMITATIONS
The arcs are a geometric estimate. They do not predict whether the price will hold or break a level, and they are not a trading system on its own. Arcs fitted on few pivots can bend sharply and leave the chart quickly. Use it with your own analysis and risk management.
Original code by Titpaud, published open source under the Mozilla Public License 2.0.

คำจำกัดสิทธิ์ความรับผิดชอบ
ข้อมูลและบทความไม่ได้มีวัตถุประสงค์เพื่อก่อให้เกิดกิจกรรมทางการเงิน, การลงทุน, การซื้อขาย, ข้อเสนอแนะ หรือคำแนะนำประเภทอื่น ๆ ที่ให้หรือรับรองโดย TradingView อ่านเพิ่มเติมใน ข้อกำหนดการใช้งาน
คำจำกัดสิทธิ์ความรับผิดชอบ
ข้อมูลและบทความไม่ได้มีวัตถุประสงค์เพื่อก่อให้เกิดกิจกรรมทางการเงิน, การลงทุน, การซื้อขาย, ข้อเสนอแนะ หรือคำแนะนำประเภทอื่น ๆ ที่ให้หรือรับรองโดย TradingView อ่านเพิ่มเติมใน ข้อกำหนดการใช้งาน