Spread RSI Indicator
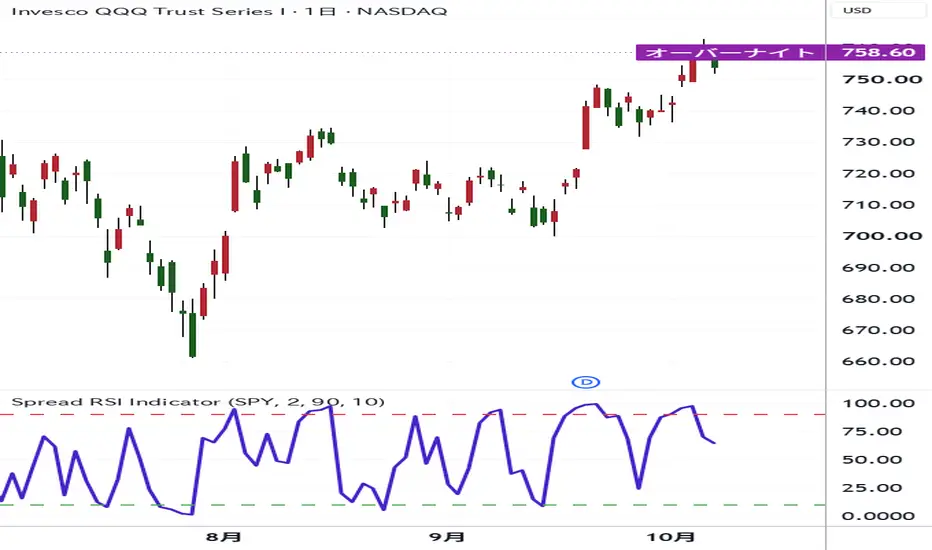
# Spread RSI Indicator
## Overview
Spread RSI is an indicator that applies the Relative Strength Index (RSI) to the price ratio between two financial instruments.
While a conventional RSI analyzes price movements of a single instrument, Spread RSI focuses on relative price movements between two instruments.
For example, by selecting SPY (S&P 500 ETF) as the comparison symbol, traders can analyze whether the instrument displayed on the chart is relatively strong or weak compared to SPY.
## Calculation Method
First, the price ratio is calculated using the closing prices of two instruments.
**Price Ratio = Chart Symbol Closing Price / Comparison Symbol Closing Price**
The RSI is then applied to this price ratio.
An increasing price ratio indicates that the chart symbol is strengthening relative to the comparison symbol, while a decreasing ratio indicates relative weakness.
Spread RSI measures changes in this price ratio and displays the results on a scale from 0 to 100.
## How to Use
**1. Relative Strength and Weakness Analysis**
By comparing individual stocks with SPY, traders can analyze the relative performance of individual stocks against the broader U.S. stock market.
**2. Overbought and Oversold Analysis**
A high Spread RSI reading indicates strong recent relative performance of the chart symbol compared to the comparison symbol, while a low reading indicates weak recent relative performance.
Upper and lower threshold levels can help identify potential short-term extremes in relative price movements.
**3. Strategy Development and Backtesting**
Traders can also develop trading rules based on Spread RSI and evaluate them using TradingView's Strategy Tester.
For example, with an RSI length of 2, a lower threshold of 10, and an upper threshold of 90, a simple trading approach might be:
- Buy when Spread RSI is at or below 10.
- Exit the long position when Spread RSI is at or above 90.
This approach is based on buying an instrument when it becomes relatively weak compared to the reference instrument and exiting when its relative strength recovers.
However, this strategy is not guaranteed to be profitable. Traders are encouraged to develop their own strategies and conduct backtests by adjusting the RSI length, threshold levels, and comparison symbols to evaluate their effectiveness.
## Input Settings
- **Comparison Symbol:** The reference instrument used for comparison. Default: SPY.
- **RSI Length:** The RSI calculation period. Default: 2.
- **RSI Upper Threshold:** The upper RSI threshold. Default: 90.
- **RSI Lower Threshold:** The lower RSI threshold. Default: 10.
## Important Notes
Spread RSI is designed to analyze relative price movements between two instruments. It does not guarantee trading signals or profitability.
Differences in trading hours and data update timing between the two instruments may affect the calculated values.
---
# Spread RSI Indicator(スプレッドRSI)
## 概要
Spread RSIは、2つの銘柄の価格比率にRSI(相対力指数)を適用したインジケーターです。
通常のRSIが単一銘柄の価格変動を分析するのに対し、Spread RSIは2銘柄間の相対的な値動きに着目します。
例えば、比較銘柄にSPY(S&P 500 ETF)を設定すると、チャートに表示している銘柄がSPYに対して相対的に強いのか、弱いのかを分析できます。
## 計算方法
まず、2銘柄の終値から価格比率を計算します。
**価格比率 = チャート銘柄の終値 ÷ 比較銘柄の終値**
次に、この価格比率にRSIを適用します。
価格比率の上昇はチャート銘柄の相対的な強さを、低下は相対的な弱さを示します。Spread RSIは、その価格比率の変化を0~100の範囲で表示します。
## 活用方法
**1. 相対的な強さ・弱さの分析**
個別株とSPYを比較することで、株式市場全体に対する個別株の相対的な値動きを分析できます。
**2. 買われ過ぎ・売られ過ぎの分析**
Spread RSIが高い水準にある場合、チャート銘柄が比較銘柄に対して相対的に強い状態を、低い水準にある場合は相対的に弱い状態を示します。
上限・下限の水準を利用することで、短期的な相対的過熱や行き過ぎを分析できます。
**3. ストラテジーの開発とバックテスト**
Spread RSIを利用した売買ルールを作成し、TradingViewのストラテジーテスターで検証することもできます。
例えば、RSIの計算期間を2、下限を10、上限を90に設定した場合、次のようなルールが考えられます。
- Spread RSIが10以下になったら買い
- Spread RSIが90以上になったら決済
これは、比較銘柄に対して相対的に弱くなった銘柄を買い、相対的な強さが回復したところで決済するという考え方です。
もちろん、このルールが常に有効とは限りません。RSIの計算期間や売買水準、比較銘柄などを変更しながら、ご自身でストラテジーを作成し、バックテストによって有効性を確認してみてください。
## 設定項目
- **Comparison Symbol:** 比較する銘柄。初期設定はSPYです。
- **RSI Length:** RSIの計算期間。初期設定は2です。
- **RSI Upper Threshold:** RSIの上限水準。初期設定は90です。
- **RSI Lower Threshold:** RSIの下限水準。初期設定は10です。
## 注意事項
Spread RSIは2銘柄間の相対的な値動きを分析するインジケーターであり、売買シグナルや収益を保証するものではありません。
また、比較する銘柄の取引時間やデータの更新タイミングが異なる場合、計算結果に影響することがあります。
## Overview
Spread RSI is an indicator that applies the Relative Strength Index (RSI) to the price ratio between two financial instruments.
While a conventional RSI analyzes price movements of a single instrument, Spread RSI focuses on relative price movements between two instruments.
For example, by selecting SPY (S&P 500 ETF) as the comparison symbol, traders can analyze whether the instrument displayed on the chart is relatively strong or weak compared to SPY.
## Calculation Method
First, the price ratio is calculated using the closing prices of two instruments.
**Price Ratio = Chart Symbol Closing Price / Comparison Symbol Closing Price**
The RSI is then applied to this price ratio.
An increasing price ratio indicates that the chart symbol is strengthening relative to the comparison symbol, while a decreasing ratio indicates relative weakness.
Spread RSI measures changes in this price ratio and displays the results on a scale from 0 to 100.
## How to Use
**1. Relative Strength and Weakness Analysis**
By comparing individual stocks with SPY, traders can analyze the relative performance of individual stocks against the broader U.S. stock market.
**2. Overbought and Oversold Analysis**
A high Spread RSI reading indicates strong recent relative performance of the chart symbol compared to the comparison symbol, while a low reading indicates weak recent relative performance.
Upper and lower threshold levels can help identify potential short-term extremes in relative price movements.
**3. Strategy Development and Backtesting**
Traders can also develop trading rules based on Spread RSI and evaluate them using TradingView's Strategy Tester.
For example, with an RSI length of 2, a lower threshold of 10, and an upper threshold of 90, a simple trading approach might be:
- Buy when Spread RSI is at or below 10.
- Exit the long position when Spread RSI is at or above 90.
This approach is based on buying an instrument when it becomes relatively weak compared to the reference instrument and exiting when its relative strength recovers.
However, this strategy is not guaranteed to be profitable. Traders are encouraged to develop their own strategies and conduct backtests by adjusting the RSI length, threshold levels, and comparison symbols to evaluate their effectiveness.
## Input Settings
- **Comparison Symbol:** The reference instrument used for comparison. Default: SPY.
- **RSI Length:** The RSI calculation period. Default: 2.
- **RSI Upper Threshold:** The upper RSI threshold. Default: 90.
- **RSI Lower Threshold:** The lower RSI threshold. Default: 10.
## Important Notes
Spread RSI is designed to analyze relative price movements between two instruments. It does not guarantee trading signals or profitability.
Differences in trading hours and data update timing between the two instruments may affect the calculated values.
---
# Spread RSI Indicator(スプレッドRSI)
## 概要
Spread RSIは、2つの銘柄の価格比率にRSI(相対力指数)を適用したインジケーターです。
通常のRSIが単一銘柄の価格変動を分析するのに対し、Spread RSIは2銘柄間の相対的な値動きに着目します。
例えば、比較銘柄にSPY(S&P 500 ETF)を設定すると、チャートに表示している銘柄がSPYに対して相対的に強いのか、弱いのかを分析できます。
## 計算方法
まず、2銘柄の終値から価格比率を計算します。
**価格比率 = チャート銘柄の終値 ÷ 比較銘柄の終値**
次に、この価格比率にRSIを適用します。
価格比率の上昇はチャート銘柄の相対的な強さを、低下は相対的な弱さを示します。Spread RSIは、その価格比率の変化を0~100の範囲で表示します。
## 活用方法
**1. 相対的な強さ・弱さの分析**
個別株とSPYを比較することで、株式市場全体に対する個別株の相対的な値動きを分析できます。
**2. 買われ過ぎ・売られ過ぎの分析**
Spread RSIが高い水準にある場合、チャート銘柄が比較銘柄に対して相対的に強い状態を、低い水準にある場合は相対的に弱い状態を示します。
上限・下限の水準を利用することで、短期的な相対的過熱や行き過ぎを分析できます。
**3. ストラテジーの開発とバックテスト**
Spread RSIを利用した売買ルールを作成し、TradingViewのストラテジーテスターで検証することもできます。
例えば、RSIの計算期間を2、下限を10、上限を90に設定した場合、次のようなルールが考えられます。
- Spread RSIが10以下になったら買い
- Spread RSIが90以上になったら決済
これは、比較銘柄に対して相対的に弱くなった銘柄を買い、相対的な強さが回復したところで決済するという考え方です。
もちろん、このルールが常に有効とは限りません。RSIの計算期間や売買水準、比較銘柄などを変更しながら、ご自身でストラテジーを作成し、バックテストによって有効性を確認してみてください。
## 設定項目
- **Comparison Symbol:** 比較する銘柄。初期設定はSPYです。
- **RSI Length:** RSIの計算期間。初期設定は2です。
- **RSI Upper Threshold:** RSIの上限水準。初期設定は90です。
- **RSI Lower Threshold:** RSIの下限水準。初期設定は10です。
## 注意事項
Spread RSIは2銘柄間の相対的な値動きを分析するインジケーターであり、売買シグナルや収益を保証するものではありません。
また、比較する銘柄の取引時間やデータの更新タイミングが異なる場合、計算結果に影響することがあります。

岩本祐介
著書『価格帯別出来高分析を使ったサポレジトレード
-TradingViewで可視化する市場参加者の注目点』(Pan Rolling)
tradersshop.com/bin/showprod?c=9784775991985
著書『価格帯別出来高分析を使ったサポレジトレード
-TradingViewで可視化する市場参加者の注目点』(Pan Rolling)
tradersshop.com/bin/showprod?c=9784775991985
คำจำกัดสิทธิ์ความรับผิดชอบ
ข้อมูลและบทความไม่ได้มีวัตถุประสงค์เพื่อก่อให้เกิดกิจกรรมทางการเงิน, การลงทุน, การซื้อขาย, ข้อเสนอแนะ หรือคำแนะนำประเภทอื่น ๆ ที่ให้หรือรับรองโดย TradingView อ่านเพิ่มเติมใน ข้อกำหนดการใช้งาน
岩本祐介
著書『価格帯別出来高分析を使ったサポレジトレード
-TradingViewで可視化する市場参加者の注目点』(Pan Rolling)
tradersshop.com/bin/showprod?c=9784775991985
著書『価格帯別出来高分析を使ったサポレジトレード
-TradingViewで可視化する市場参加者の注目点』(Pan Rolling)
tradersshop.com/bin/showprod?c=9784775991985
คำจำกัดสิทธิ์ความรับผิดชอบ
ข้อมูลและบทความไม่ได้มีวัตถุประสงค์เพื่อก่อให้เกิดกิจกรรมทางการเงิน, การลงทุน, การซื้อขาย, ข้อเสนอแนะ หรือคำแนะนำประเภทอื่น ๆ ที่ให้หรือรับรองโดย TradingView อ่านเพิ่มเติมใน ข้อกำหนดการใช้งาน