OPEN-SOURCE SCRIPT
MTF Ultimate Market State Dashboard
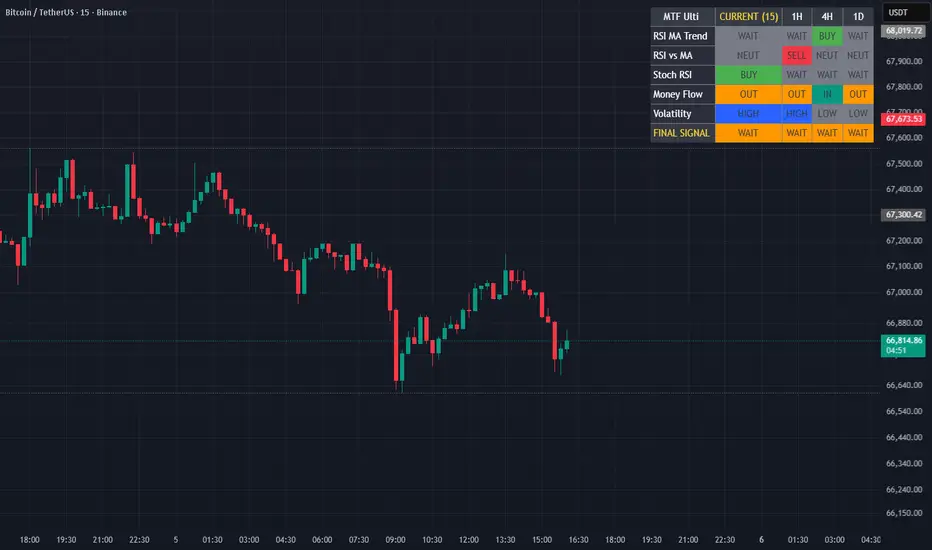
Overview
The MTF Ultimate Market State Dashboard is a comprehensive visual tool designed to provide a bird's-eye view of market conditions across multiple timeframes (Current, 1H, 4H, and Daily). Instead of flipping through charts, this dashboard aggregates trend, momentum, and volatility data into a single, clean interface.
Why this Mashup?
Trading in isolation on a single timeframe often leads to "noise" traps. This script combines four core technical pillars to confirm high-probability setups:
RSI & MA Synergy: Detects if the relative strength is trending above its average.
Stochastic RSI: Identifies momentum shifts and overbought/oversold exhaustion.
Money Flow Index (MFI): Integrates volume-weighted momentum to ensure price moves are backed by liquidity.
ATR Volatility: Monitors if the current price action is expanding or contracting relative to historical norms.
How it Works (The Logic)
The dashboard calculates data from higher timeframes using request.security.
RSI MA Trend: Signals a 'BUY' if the RSI Moving Average is below 50 but sloping upwards (recovery phase), and 'SELL' if above 50 but sloping downwards (distribution phase).
RSI vs MA: A direct comparison. If RSI > MA and rising, it indicates bullish dominance.
Final Signal: This is a confluence logic. A 'BUY' signal is triggered only when the RSI Trend, RSI vs MA, and Stoch RSI are all bullish AND the Money Flow Index is above 50.
Repaint Protection: Users can toggle Allow Repaint. When off, it uses closed-bar data (lookahead_off) to ensure signals are stable and reliable for live trading.
How to Use
Trend Alignment: Look for columns where multiple timeframes show the same color (Confluence).
Scalping: Use the 'Current TF' row for quick entries while ensuring the '4H' or '1D' trend is in your favor.
Volatility Filter: Use the 'Volatility' row to avoid trading in "dead" markets where ATR is significantly below its average.
The MTF Ultimate Market State Dashboard is a comprehensive visual tool designed to provide a bird's-eye view of market conditions across multiple timeframes (Current, 1H, 4H, and Daily). Instead of flipping through charts, this dashboard aggregates trend, momentum, and volatility data into a single, clean interface.
Why this Mashup?
Trading in isolation on a single timeframe often leads to "noise" traps. This script combines four core technical pillars to confirm high-probability setups:
RSI & MA Synergy: Detects if the relative strength is trending above its average.
Stochastic RSI: Identifies momentum shifts and overbought/oversold exhaustion.
Money Flow Index (MFI): Integrates volume-weighted momentum to ensure price moves are backed by liquidity.
ATR Volatility: Monitors if the current price action is expanding or contracting relative to historical norms.
How it Works (The Logic)
The dashboard calculates data from higher timeframes using request.security.
RSI MA Trend: Signals a 'BUY' if the RSI Moving Average is below 50 but sloping upwards (recovery phase), and 'SELL' if above 50 but sloping downwards (distribution phase).
RSI vs MA: A direct comparison. If RSI > MA and rising, it indicates bullish dominance.
Final Signal: This is a confluence logic. A 'BUY' signal is triggered only when the RSI Trend, RSI vs MA, and Stoch RSI are all bullish AND the Money Flow Index is above 50.
Repaint Protection: Users can toggle Allow Repaint. When off, it uses closed-bar data (lookahead_off) to ensure signals are stable and reliable for live trading.
How to Use
Trend Alignment: Look for columns where multiple timeframes show the same color (Confluence).
Scalping: Use the 'Current TF' row for quick entries while ensuring the '4H' or '1D' trend is in your favor.
Volatility Filter: Use the 'Volatility' row to avoid trading in "dead" markets where ATR is significantly below its average.
สคริปต์แบบโอเพนซอร์ส
ด้วยเจตนารมณ์หลักของ TradingView ผู้สร้างสคริปต์นี้ได้ทำให้เป็นโอเพนซอร์ส เพื่อให้เทรดเดอร์สามารถตรวจสอบและยืนยันฟังก์ชันการทำงานของมันได้ ขอชื่นชมผู้เขียน! แม้ว่าคุณจะใช้งานได้ฟรี แต่โปรดจำไว้ว่าการเผยแพร่โค้ดซ้ำจะต้องเป็นไปตาม กฎระเบียบการใช้งาน ของเรา

คำจำกัดสิทธิ์ความรับผิดชอบ
ข้อมูลและบทความไม่ได้มีวัตถุประสงค์เพื่อก่อให้เกิดกิจกรรมทางการเงิน, การลงทุน, การซื้อขาย, ข้อเสนอแนะ หรือคำแนะนำประเภทอื่น ๆ ที่ให้หรือรับรองโดย TradingView อ่านเพิ่มเติมใน ข้อกำหนดการใช้งาน
สคริปต์แบบโอเพนซอร์ส
ด้วยเจตนารมณ์หลักของ TradingView ผู้สร้างสคริปต์นี้ได้ทำให้เป็นโอเพนซอร์ส เพื่อให้เทรดเดอร์สามารถตรวจสอบและยืนยันฟังก์ชันการทำงานของมันได้ ขอชื่นชมผู้เขียน! แม้ว่าคุณจะใช้งานได้ฟรี แต่โปรดจำไว้ว่าการเผยแพร่โค้ดซ้ำจะต้องเป็นไปตาม กฎระเบียบการใช้งาน ของเรา
คำจำกัดสิทธิ์ความรับผิดชอบ
ข้อมูลและบทความไม่ได้มีวัตถุประสงค์เพื่อก่อให้เกิดกิจกรรมทางการเงิน, การลงทุน, การซื้อขาย, ข้อเสนอแนะ หรือคำแนะนำประเภทอื่น ๆ ที่ให้หรือรับรองโดย TradingView อ่านเพิ่มเติมใน ข้อกำหนดการใช้งาน