Eye Divergence Engine [EyeAlgo]
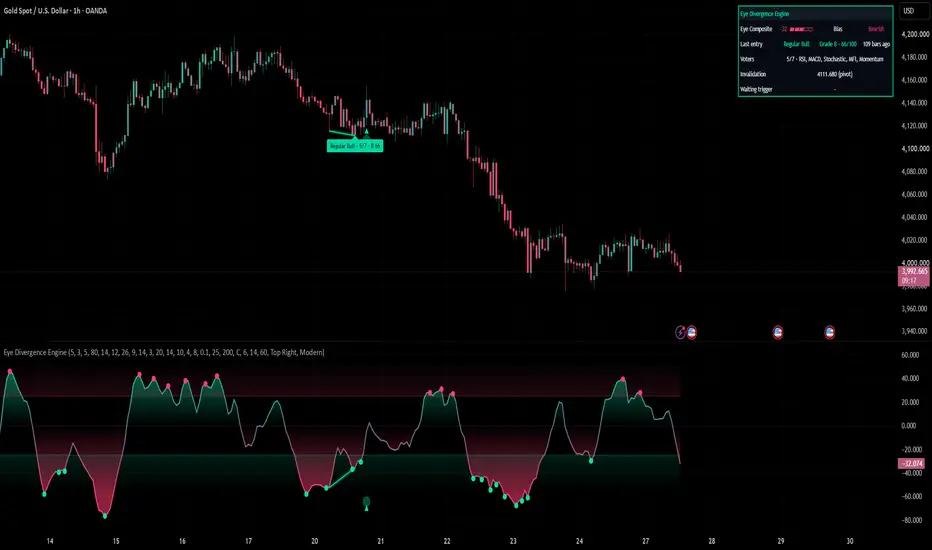
Most divergence tools draw every divergence the same way. A tiny RSI wobble and a clear break between price and momentum get the same line, so the trader cannot tell a weak divergence from a strong one. Eye Divergence Engine asks seven oscillators at once, scores each divergence from 0 to 100, and only marks an entry when a candle confirms it.

◆ The idea in one line
A divergence is only as strong as the number of oscillators that agree with it, how big the gap is, and where momentum was when it happened. This script measures all three and turns them into one score.
◆ What makes it different
▶ Seven votes, not one. RSI, MACD histogram, Stochastic %K, CCI, MFI, OBV and Momentum each check the same two price pivots. A divergence is shown only when at least "Min oscillators agreeing" of them (default 4) agree.
▶ A 0-100 quality score and an A/B/C grade on every signal, so strong and weak divergences no longer look the same.
▶ Eye Composite: all enabled oscillators scaled to the same -100 to +100 range and averaged into one line. It is the line in the pane, it decides the zones, and it colours the candles.
▶ A trigger candle. A confirmed divergence is not an entry yet. The entry mark appears only when a candle closes beyond the pivot area, and the setup is cancelled if price breaks the pivot first.
▶ An invalidation level (the pivot price) for every entry, shown in the dashboard.
◆ Reading the chart
▶ Solid line + label on price = regular divergence (possible reversal). Dashed line = hidden divergence (possible continuation).
▶ Label text: type · votes/enabled · grade score, for example "Regular Bull · 5/7 · B 74".
▶ Small triangle under / over a candle = the trigger candle (the entry mark).
▶ Pane line = Eye Composite. Green above zero, pink below, grey near zero.
▶ Shaded bands = the zones at +/- "Regular: Eye Composite zone level" (default 25).
▶ Dots on the pane line (Modern style) = turning points of the Eye Composite inside a zone (a peak above the upper zone or a trough below the lower zone).
▶ Candle colours follow the Eye Composite (can be turned off).

◆ How one signal is built (worked example: a regular bullish divergence)
1. Two pivots. A pivot low is confirmed "Pivot right bars (confirm delay)" (default 3) bars after it forms. It is compared with the previous pivot low only, and only if that pivot is between "Min bars between pivots" and "Max bars between pivots" away.
2. Price vs oscillators. Price made a lower low. Each enabled oscillator that made a higher low at the same two points is one vote. Example: 5 of 7 vote.
3. Filters. The setup must pass all of these: votes ≥ "Min oscillators agreeing" (capped at the number of enabled oscillators); the average oscillator gap of the voters ≥ "Min oscillator divergence (points)"; the price gap ≥ "Min price difference (× ATR)"; and, for a regular bull, the Eye Composite at the pivot ≤ minus the zone level.
4. Score. Votes give up to 40 points, the size of the oscillator gap up to 30 (full points at 30), how deep the Eye Composite was in the zone up to 20 (full points at 60; for hidden setups, how far beyond zero, full points at 40), and the price gap up to 10 (full points at 1 ATR). A = 75-100, B = 55-74, C = below 55.
5. Trigger. Within "Trigger window (bars)" a candle must close above the highest high from the pivot bar to the confirmation bar. That candle gets the triangle, the divergence line and label are drawn, and the alert fires. If a low breaks the pivot low first (or on the same candle), or the window ends, the setup is dropped without a mark. Only one entry is marked per bar; if several setups trigger together, the newest is used.
Bearish setups are the mirror image. Hidden divergences use the opposite pivot pattern (higher low with lower oscillator lows for bull) and need the trend filter: close above a rising "Hidden: trend EMA length" EMA for hidden bull, below a falling one for hidden bear. Hidden bull also needs the Eye Composite at the pivot at or below 0 (hidden bear: at or above 0).
◆ What the score means, and what it does not
▶ A: most oscillators agree, the gap is clear and momentum was stretched. The cleanest divergences the script finds.
▶ B: a valid divergence with one weaker part.
▶ C: it passed the filters, but only just.
The score describes how clear the divergence is. It is not a probability and not a win rate. While building the script we measured how often signals reached a target on XAUUSD, EURUSD, BTCUSD and NAS100. The results were mixed and changed from symbol to symbol, so we chose not to show a win-rate table that could look like a promise. Use the grade to rank setups, and test it on your own instrument.
◆ The dashboard
▶ Eye Composite value, a strength meter and the bias (Bullish above +20, Bearish below -20, otherwise Neutral).
▶ Last entry: type, grade, score and how many bars ago.
▶ Voters: which oscillators agreed.
▶ Invalidation: the pivot price of the last entry.
▶ Waiting trigger: the newest confirmed divergence that has not triggered yet, with the close level it needs.
◆ Repainting and delay, in plain words
▶ Divergences are built from confirmed pivots only, so every entry comes at least "Pivot right bars (confirm delay)" + 1 bars after the pivot. This is the price of not repainting.
▶ Entry marks, lines, labels and alerts are created only on closed candles and are never moved or removed afterwards (only the oldest are deleted once "Divergences kept on chart" is reached).
▶ The divergence line is drawn back to the pivot, but it appears on the trigger candle, not earlier.
▶ The turning dots on the pane are placed on the turning bar but appear only when the next candle closes and confirms the turn.
▶ The Eye Composite and the candle colours update live on the open candle like any oscillator.
◆ How to use it
1. Start with the defaults on your chart and look at the past entries and their grades.
2. Treat a regular divergence in the zone as a warning that momentum is fading, and the trigger candle as the point where price starts to agree.
3. Use the invalidation level from the dashboard as the place where the idea is wrong.
4. Prefer hidden divergences in the direction of the trend and be careful with regular divergences against a strong trend.
5. Add your own risk rules. The indicator does not place trades or give a stop or target.
◆ Settings quick guide
▶ Fewer, cleaner signals → raise "Min oscillators agreeing", "Min oscillator divergence (points)" or set "Min grade to show" to B or A.
▶ More signals → lower those values, or lower "Regular: Eye Composite zone level".
▶ Faster pivots → lower "Pivot right bars (confirm delay)" (earlier but noisier).
▶ Only reversals or only continuations → turn off "Hidden divergence (continuation)" or "Regular divergence (reversal)".
▶ Symbols without real volume → MFI and OBV switch off on their own when the chart has no volume.
▶ Look → "Style" (Modern / Classic), "Colour candles by Eye Composite", "Dashboard position", "Dashboard on price chart".
Setting groups: Pivots · Oscillators (each one is a vote) · Signal filters · Entry trigger · Visuals.
◆ Alerts
▶ Regular Bullish Divergence entry / Regular Bearish Divergence entry
▶ Hidden Bullish Divergence entry / Hidden Bearish Divergence entry
▶ Any A-grade Divergence entry
For one alert with all details, choose "Any alert() function call". It sends the type, the votes and which oscillators voted, the grade and score, the symbol, the timeframe and the close, and it already fires once per bar close. A signal exists only on a closed trigger candle, so for the five named alerts choose "Once Per Bar Close".
◆ When it struggles
▶ Strong one-way trends: regular divergences can appear again and again while price keeps going. Use the trend and the invalidation level.
▶ Tight ranges: small pivots give many small divergences. Raise the filters.
▶ Very low timeframes: more noise and more signals. Test before use.
▶ News spikes: a single bar can jump past the trigger and the pivot together.
◆ FAQ
Does it repaint? Signals, lines, labels and alerts do not. See the section on repainting and delay.
Why did a divergence I can see not get a signal? It failed a filter (votes, gap, zone, trend for hidden), it was not between the last two pivots, or it never triggered inside the window. Only one entry is marked per bar.
Which timeframe is best? There is no single best one. Test the settings and the timeframe on your own instrument.
Can I use it as a full strategy? No. It finds and ranks divergences. Entries, exits and risk are up to you.
◆ Notes
▶ Open source under MPL 2.0. All logic, the Eye Composite, the scoring and the trigger rules are written for this script; the oscillators themselves are TradingView's built-in functions.
▶ Volume-based votes (MFI, OBV) use the volume the data feed provides, which is tick volume on many forex and CFD symbols.
▶ Drawings are limited by TradingView to 500 lines and 500 labels.
◆ Disclaimer
For education and research only. This is not financial advice. Past behaviour on a chart does not guarantee future results. Test the settings and the timeframe on your own instrument before you use any idea from it.
◆ The idea in one line
A divergence is only as strong as the number of oscillators that agree with it, how big the gap is, and where momentum was when it happened. This script measures all three and turns them into one score.
◆ What makes it different
▶ Seven votes, not one. RSI, MACD histogram, Stochastic %K, CCI, MFI, OBV and Momentum each check the same two price pivots. A divergence is shown only when at least "Min oscillators agreeing" of them (default 4) agree.
▶ A 0-100 quality score and an A/B/C grade on every signal, so strong and weak divergences no longer look the same.
▶ Eye Composite: all enabled oscillators scaled to the same -100 to +100 range and averaged into one line. It is the line in the pane, it decides the zones, and it colours the candles.
▶ A trigger candle. A confirmed divergence is not an entry yet. The entry mark appears only when a candle closes beyond the pivot area, and the setup is cancelled if price breaks the pivot first.
▶ An invalidation level (the pivot price) for every entry, shown in the dashboard.
◆ Reading the chart
▶ Solid line + label on price = regular divergence (possible reversal). Dashed line = hidden divergence (possible continuation).
▶ Label text: type · votes/enabled · grade score, for example "Regular Bull · 5/7 · B 74".
▶ Small triangle under / over a candle = the trigger candle (the entry mark).
▶ Pane line = Eye Composite. Green above zero, pink below, grey near zero.
▶ Shaded bands = the zones at +/- "Regular: Eye Composite zone level" (default 25).
▶ Dots on the pane line (Modern style) = turning points of the Eye Composite inside a zone (a peak above the upper zone or a trough below the lower zone).
▶ Candle colours follow the Eye Composite (can be turned off).
◆ How one signal is built (worked example: a regular bullish divergence)
1. Two pivots. A pivot low is confirmed "Pivot right bars (confirm delay)" (default 3) bars after it forms. It is compared with the previous pivot low only, and only if that pivot is between "Min bars between pivots" and "Max bars between pivots" away.
2. Price vs oscillators. Price made a lower low. Each enabled oscillator that made a higher low at the same two points is one vote. Example: 5 of 7 vote.
3. Filters. The setup must pass all of these: votes ≥ "Min oscillators agreeing" (capped at the number of enabled oscillators); the average oscillator gap of the voters ≥ "Min oscillator divergence (points)"; the price gap ≥ "Min price difference (× ATR)"; and, for a regular bull, the Eye Composite at the pivot ≤ minus the zone level.
4. Score. Votes give up to 40 points, the size of the oscillator gap up to 30 (full points at 30), how deep the Eye Composite was in the zone up to 20 (full points at 60; for hidden setups, how far beyond zero, full points at 40), and the price gap up to 10 (full points at 1 ATR). A = 75-100, B = 55-74, C = below 55.
5. Trigger. Within "Trigger window (bars)" a candle must close above the highest high from the pivot bar to the confirmation bar. That candle gets the triangle, the divergence line and label are drawn, and the alert fires. If a low breaks the pivot low first (or on the same candle), or the window ends, the setup is dropped without a mark. Only one entry is marked per bar; if several setups trigger together, the newest is used.
Bearish setups are the mirror image. Hidden divergences use the opposite pivot pattern (higher low with lower oscillator lows for bull) and need the trend filter: close above a rising "Hidden: trend EMA length" EMA for hidden bull, below a falling one for hidden bear. Hidden bull also needs the Eye Composite at the pivot at or below 0 (hidden bear: at or above 0).
◆ What the score means, and what it does not
▶ A: most oscillators agree, the gap is clear and momentum was stretched. The cleanest divergences the script finds.
▶ B: a valid divergence with one weaker part.
▶ C: it passed the filters, but only just.
The score describes how clear the divergence is. It is not a probability and not a win rate. While building the script we measured how often signals reached a target on XAUUSD, EURUSD, BTCUSD and NAS100. The results were mixed and changed from symbol to symbol, so we chose not to show a win-rate table that could look like a promise. Use the grade to rank setups, and test it on your own instrument.
◆ The dashboard
▶ Eye Composite value, a strength meter and the bias (Bullish above +20, Bearish below -20, otherwise Neutral).
▶ Last entry: type, grade, score and how many bars ago.
▶ Voters: which oscillators agreed.
▶ Invalidation: the pivot price of the last entry.
▶ Waiting trigger: the newest confirmed divergence that has not triggered yet, with the close level it needs.
◆ Repainting and delay, in plain words
▶ Divergences are built from confirmed pivots only, so every entry comes at least "Pivot right bars (confirm delay)" + 1 bars after the pivot. This is the price of not repainting.
▶ Entry marks, lines, labels and alerts are created only on closed candles and are never moved or removed afterwards (only the oldest are deleted once "Divergences kept on chart" is reached).
▶ The divergence line is drawn back to the pivot, but it appears on the trigger candle, not earlier.
▶ The turning dots on the pane are placed on the turning bar but appear only when the next candle closes and confirms the turn.
▶ The Eye Composite and the candle colours update live on the open candle like any oscillator.
◆ How to use it
1. Start with the defaults on your chart and look at the past entries and their grades.
2. Treat a regular divergence in the zone as a warning that momentum is fading, and the trigger candle as the point where price starts to agree.
3. Use the invalidation level from the dashboard as the place where the idea is wrong.
4. Prefer hidden divergences in the direction of the trend and be careful with regular divergences against a strong trend.
5. Add your own risk rules. The indicator does not place trades or give a stop or target.
◆ Settings quick guide
▶ Fewer, cleaner signals → raise "Min oscillators agreeing", "Min oscillator divergence (points)" or set "Min grade to show" to B or A.
▶ More signals → lower those values, or lower "Regular: Eye Composite zone level".
▶ Faster pivots → lower "Pivot right bars (confirm delay)" (earlier but noisier).
▶ Only reversals or only continuations → turn off "Hidden divergence (continuation)" or "Regular divergence (reversal)".
▶ Symbols without real volume → MFI and OBV switch off on their own when the chart has no volume.
▶ Look → "Style" (Modern / Classic), "Colour candles by Eye Composite", "Dashboard position", "Dashboard on price chart".
Setting groups: Pivots · Oscillators (each one is a vote) · Signal filters · Entry trigger · Visuals.
◆ Alerts
▶ Regular Bullish Divergence entry / Regular Bearish Divergence entry
▶ Hidden Bullish Divergence entry / Hidden Bearish Divergence entry
▶ Any A-grade Divergence entry
For one alert with all details, choose "Any alert() function call". It sends the type, the votes and which oscillators voted, the grade and score, the symbol, the timeframe and the close, and it already fires once per bar close. A signal exists only on a closed trigger candle, so for the five named alerts choose "Once Per Bar Close".
◆ When it struggles
▶ Strong one-way trends: regular divergences can appear again and again while price keeps going. Use the trend and the invalidation level.
▶ Tight ranges: small pivots give many small divergences. Raise the filters.
▶ Very low timeframes: more noise and more signals. Test before use.
▶ News spikes: a single bar can jump past the trigger and the pivot together.
◆ FAQ
Does it repaint? Signals, lines, labels and alerts do not. See the section on repainting and delay.
Why did a divergence I can see not get a signal? It failed a filter (votes, gap, zone, trend for hidden), it was not between the last two pivots, or it never triggered inside the window. Only one entry is marked per bar.
Which timeframe is best? There is no single best one. Test the settings and the timeframe on your own instrument.
Can I use it as a full strategy? No. It finds and ranks divergences. Entries, exits and risk are up to you.
◆ Notes
▶ Open source under MPL 2.0. All logic, the Eye Composite, the scoring and the trigger rules are written for this script; the oscillators themselves are TradingView's built-in functions.
▶ Volume-based votes (MFI, OBV) use the volume the data feed provides, which is tick volume on many forex and CFD symbols.
▶ Drawings are limited by TradingView to 500 lines and 500 labels.
◆ Disclaimer
For education and research only. This is not financial advice. Past behaviour on a chart does not guarantee future results. Test the settings and the timeframe on your own instrument before you use any idea from it.

คำจำกัดสิทธิ์ความรับผิดชอบ
ข้อมูลและบทความไม่ได้มีวัตถุประสงค์เพื่อก่อให้เกิดกิจกรรมทางการเงิน, การลงทุน, การซื้อขาย, ข้อเสนอแนะ หรือคำแนะนำประเภทอื่น ๆ ที่ให้หรือรับรองโดย TradingView อ่านเพิ่มเติมใน ข้อกำหนดการใช้งาน
คำจำกัดสิทธิ์ความรับผิดชอบ
ข้อมูลและบทความไม่ได้มีวัตถุประสงค์เพื่อก่อให้เกิดกิจกรรมทางการเงิน, การลงทุน, การซื้อขาย, ข้อเสนอแนะ หรือคำแนะนำประเภทอื่น ๆ ที่ให้หรือรับรองโดย TradingView อ่านเพิ่มเติมใน ข้อกำหนดการใช้งาน