Futures TPO Profile - CFD Charts
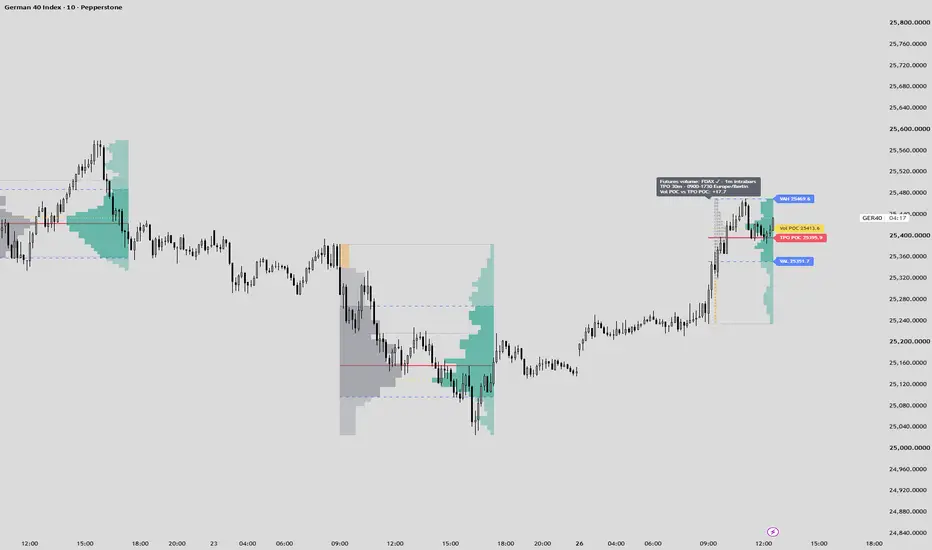
A TPO (time price opportunity) profile for CFD charts that puts time and real futures volume side by side: per session, the left histogram shows how long price traded at each level, the right histogram shows how much volume the matching futures contract traded there.
What makes it original: a TPO counts time, so on a CFD it is usually built from every bar the broker prints, including hours in which the exchange contract barely trades. This script prints a TPO only where the futures contract actually traded, and next to it draws the futures volume profile of the same session on the same rows. Time at price and volume at price rarely agree; where they split, the label tells you by how many points the volume POC sits away from the TPO POC. CFD tick volume is never used.
How it works:
Session: auto-selected from the detected future (FDAX 09:00-17:30 Berlin, FTSE 08:00-16:30 London, NQ/ES/YM 09:30-16:00 New York), or a custom session and timezone. The session needs a daily break to reset.
The futures contract is auto-detected from the chart symbol (DAX/GER40 -> FDAX, NAS100 -> NQ, US30 -> YM, UK100 -> Z, US500 -> ES), or set manually. On a native futures chart, switch the source to the chart's own volume.
TPO periods of 5 to 60 minutes (default 30). A period marks every row its high/low covered, but only on bars where the future traded. The TPO POC is the row with the most periods (ties go to the row nearest the session middle); the value area expands from it until the chosen share of TPOs is reached.
Futures volume is placed per intrabar (1-minute futures bars up to 15m charts, 5-minute above), matched by timestamp to the chart symbol's intrabar high/low and spread evenly over the rows it covers. The volume POC is the row with the most futures volume.
Initial balance: high and low of the first periods (default 2), drawn as dotted lines. Single prints: rows touched by only one period, highlighted in their own color.
The latest session shows TPO letters (A = first period) or blocks; older sessions use blocks. Up to four finished sessions stay on the chart.
The status label names the futures contract, the intrabar resolution and match rate, the session and timezone, and warns when the chart timeframe is above the TPO period or when the future delivered no data.
How to read the letters: each letter is one period of the session. With the default 30 minutes on FDAX, A is 09:00-09:30, B is 09:30-10:00, C is 10:00-10:30, and so on up to Q for the last half hour. Each row is a price band, and it lists every period whose high/low touched that band. A row reading ABCDE means price spent five consecutive periods at that level; a row reading AB DE means price was there in A and B, away during C, and back in D and E. A row with a single letter is a single print: price passed through it in one period only. The longest row is the TPO POC (red line), the price where the session spent the most time, and the range of the first periods (A and B by default) is the initial balance (dotted lines). After Z the letters continue in lowercase (a = period 27). From period 53 on, every period shows as z, so for long sessions use periods of 15 minutes or more if you want to tell the late periods apart.
How to use it: read the session's structure first, where it spent time, where it built value, where it left single prints, and then check whether the futures volume agrees. A volume POC far from the TPO POC means the heavy trading happened at a different price than the long acceptance. A thin TPO area with heavy volume points to a fast, contested move; a wide TPO area with little volume points to drifting without commitment. The script describes the session; it does not predict whether price returns to any of these levels. Use a chart timeframe at or below the TPO period (1 to 15 minutes works best); how far back 1-minute data reaches depends on your TradingView plan.
What makes it original: a TPO counts time, so on a CFD it is usually built from every bar the broker prints, including hours in which the exchange contract barely trades. This script prints a TPO only where the futures contract actually traded, and next to it draws the futures volume profile of the same session on the same rows. Time at price and volume at price rarely agree; where they split, the label tells you by how many points the volume POC sits away from the TPO POC. CFD tick volume is never used.
How it works:
Session: auto-selected from the detected future (FDAX 09:00-17:30 Berlin, FTSE 08:00-16:30 London, NQ/ES/YM 09:30-16:00 New York), or a custom session and timezone. The session needs a daily break to reset.
The futures contract is auto-detected from the chart symbol (DAX/GER40 -> FDAX, NAS100 -> NQ, US30 -> YM, UK100 -> Z, US500 -> ES), or set manually. On a native futures chart, switch the source to the chart's own volume.
TPO periods of 5 to 60 minutes (default 30). A period marks every row its high/low covered, but only on bars where the future traded. The TPO POC is the row with the most periods (ties go to the row nearest the session middle); the value area expands from it until the chosen share of TPOs is reached.
Futures volume is placed per intrabar (1-minute futures bars up to 15m charts, 5-minute above), matched by timestamp to the chart symbol's intrabar high/low and spread evenly over the rows it covers. The volume POC is the row with the most futures volume.
Initial balance: high and low of the first periods (default 2), drawn as dotted lines. Single prints: rows touched by only one period, highlighted in their own color.
The latest session shows TPO letters (A = first period) or blocks; older sessions use blocks. Up to four finished sessions stay on the chart.
The status label names the futures contract, the intrabar resolution and match rate, the session and timezone, and warns when the chart timeframe is above the TPO period or when the future delivered no data.
How to read the letters: each letter is one period of the session. With the default 30 minutes on FDAX, A is 09:00-09:30, B is 09:30-10:00, C is 10:00-10:30, and so on up to Q for the last half hour. Each row is a price band, and it lists every period whose high/low touched that band. A row reading ABCDE means price spent five consecutive periods at that level; a row reading AB DE means price was there in A and B, away during C, and back in D and E. A row with a single letter is a single print: price passed through it in one period only. The longest row is the TPO POC (red line), the price where the session spent the most time, and the range of the first periods (A and B by default) is the initial balance (dotted lines). After Z the letters continue in lowercase (a = period 27). From period 53 on, every period shows as z, so for long sessions use periods of 15 minutes or more if you want to tell the late periods apart.
How to use it: read the session's structure first, where it spent time, where it built value, where it left single prints, and then check whether the futures volume agrees. A volume POC far from the TPO POC means the heavy trading happened at a different price than the long acceptance. A thin TPO area with heavy volume points to a fast, contested move; a wide TPO area with little volume points to drifting without commitment. The script describes the session; it does not predict whether price returns to any of these levels. Use a chart timeframe at or below the TPO period (1 to 15 minutes works best); how far back 1-minute data reaches depends on your TradingView plan.

คำจำกัดสิทธิ์ความรับผิดชอบ
ข้อมูลและบทความไม่ได้มีวัตถุประสงค์เพื่อก่อให้เกิดกิจกรรมทางการเงิน, การลงทุน, การซื้อขาย, ข้อเสนอแนะ หรือคำแนะนำประเภทอื่น ๆ ที่ให้หรือรับรองโดย TradingView อ่านเพิ่มเติมใน ข้อกำหนดการใช้งาน
คำจำกัดสิทธิ์ความรับผิดชอบ
ข้อมูลและบทความไม่ได้มีวัตถุประสงค์เพื่อก่อให้เกิดกิจกรรมทางการเงิน, การลงทุน, การซื้อขาย, ข้อเสนอแนะ หรือคำแนะนำประเภทอื่น ๆ ที่ให้หรือรับรองโดย TradingView อ่านเพิ่มเติมใน ข้อกำหนดการใช้งาน