OPEN-SOURCE SCRIPT
ที่อัปเดต: Technofunda
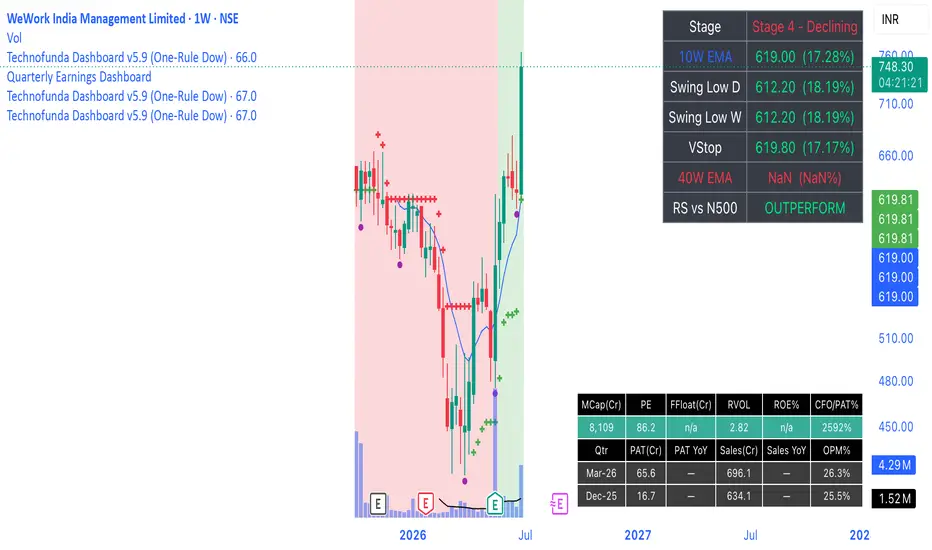
Here's what the **Technofunda Dashboard** indicator does, feature by feature:
**1. VStop (Volatility Stop) — feature 1**
ATR(20) × 2 trailing stop, plotted as dots that track price: green dots below the candles when the trend is positive (LONG), red dots above when negative (SHORT). It flips when price crosses the stop. Built with na-safe guards so it computes correctly from the start.
**2. Auto-switching moving averages — feature 5**
The indicator detects your timeframe automatically: on a daily chart it shows 21 / 50 / 200 **SMA**; on a weekly chart it switches to 10 / 20 / 40 **EMA**. Three lines — fast (aqua), medium (orange), trend (fuchsia).
**3. Distance from the MAs — feature 2**
A table (top-right) shows how far price is from each MA, measured down from price to the MA as a % of price — positive when above, negative when below, colour-coded green/red.
**4. Weinstein Stage — feature 3**
Classifies the stock into Stage 1 (Basing), 2 (Advancing), 3 (Topping) or 4 (Declining) using the long-term MA (200 DMA / 40W EMA) and its slope: price above + MA rising = Stage 2, etc. Shown in the table, colour-coded.
**5. 52-week high / low — feature 4**
Green triangle above a bar that makes a new 52-week high, red triangle below a bar that makes a new 52-week low (252 bars on daily, 52 on weekly). The table also shows current distance to the 52W high and low.
**6. Relative strength vs Nifty 500 — feature 6**
Compares the stock to a benchmark (default `NSE:CNX500`) over a lookback window. The chart background tints light green when outperforming, light red when underperforming, and the table shows OUTPERFORM / UNDERPERFORM.
**7. Per-candle letter states — feature 7**
Each candle is tagged with one letter based on its live condition:
- **A** — VStop positive (baseline / just flipped up)
- **B** — positive *and* beating Nifty 500 by ≥5%
- **C** — positive *and* beating Nifty 500 by ≥10%
- **X** — VStop negative (baseline)
- **Y** — negative *and* price below the medium MA (20W EMA / 50 DMA)
- **Z** — negative *and* price below the slow MA (40W EMA / 200 DMA)
Higher tiers win (a stock up 12% shows C, not A+B+C; one below the 40W EMA shows Z, not X+Y). The 5% / 10% thresholds are adjustable inputs.
**Extras**
A summary table consolidating MA distances, Stage, VStop status, RS status and 52W proximity; alerts for VStop flips and new 52-week highs/lows; and editable inputs for ATR length/multiplier, benchmark symbol, RS lookback, B/C thresholds, and MA slope length.
**1. VStop (Volatility Stop) — feature 1**
ATR(20) × 2 trailing stop, plotted as dots that track price: green dots below the candles when the trend is positive (LONG), red dots above when negative (SHORT). It flips when price crosses the stop. Built with na-safe guards so it computes correctly from the start.
**2. Auto-switching moving averages — feature 5**
The indicator detects your timeframe automatically: on a daily chart it shows 21 / 50 / 200 **SMA**; on a weekly chart it switches to 10 / 20 / 40 **EMA**. Three lines — fast (aqua), medium (orange), trend (fuchsia).
**3. Distance from the MAs — feature 2**
A table (top-right) shows how far price is from each MA, measured down from price to the MA as a % of price — positive when above, negative when below, colour-coded green/red.
**4. Weinstein Stage — feature 3**
Classifies the stock into Stage 1 (Basing), 2 (Advancing), 3 (Topping) or 4 (Declining) using the long-term MA (200 DMA / 40W EMA) and its slope: price above + MA rising = Stage 2, etc. Shown in the table, colour-coded.
**5. 52-week high / low — feature 4**
Green triangle above a bar that makes a new 52-week high, red triangle below a bar that makes a new 52-week low (252 bars on daily, 52 on weekly). The table also shows current distance to the 52W high and low.
**6. Relative strength vs Nifty 500 — feature 6**
Compares the stock to a benchmark (default `NSE:CNX500`) over a lookback window. The chart background tints light green when outperforming, light red when underperforming, and the table shows OUTPERFORM / UNDERPERFORM.
**7. Per-candle letter states — feature 7**
Each candle is tagged with one letter based on its live condition:
- **A** — VStop positive (baseline / just flipped up)
- **B** — positive *and* beating Nifty 500 by ≥5%
- **C** — positive *and* beating Nifty 500 by ≥10%
- **X** — VStop negative (baseline)
- **Y** — negative *and* price below the medium MA (20W EMA / 50 DMA)
- **Z** — negative *and* price below the slow MA (40W EMA / 200 DMA)
Higher tiers win (a stock up 12% shows C, not A+B+C; one below the 40W EMA shows Z, not X+Y). The 5% / 10% thresholds are adjustable inputs.
**Extras**
A summary table consolidating MA distances, Stage, VStop status, RS status and 52W proximity; alerts for VStop flips and new 52-week highs/lows; and editable inputs for ATR length/multiplier, benchmark symbol, RS lookback, B/C thresholds, and MA slope length.
Release Note
naRelease Note
naRelease Note
naสคริปต์แบบโอเพนซอร์ส
ด้วยเจตนารมณ์หลักของ TradingView ผู้สร้างสคริปต์นี้ได้ทำให้เป็นโอเพนซอร์ส เพื่อให้เทรดเดอร์สามารถตรวจสอบและยืนยันฟังก์ชันการทำงานของมันได้ ขอชื่นชมผู้เขียน! แม้ว่าคุณจะใช้งานได้ฟรี แต่โปรดจำไว้ว่าการเผยแพร่โค้ดซ้ำจะต้องเป็นไปตาม กฎระเบียบการใช้งาน ของเรา

คำจำกัดสิทธิ์ความรับผิดชอบ
ข้อมูลและบทความไม่ได้มีวัตถุประสงค์เพื่อก่อให้เกิดกิจกรรมทางการเงิน, การลงทุน, การซื้อขาย, ข้อเสนอแนะ หรือคำแนะนำประเภทอื่น ๆ ที่ให้หรือรับรองโดย TradingView อ่านเพิ่มเติมใน ข้อกำหนดการใช้งาน
สคริปต์แบบโอเพนซอร์ส
ด้วยเจตนารมณ์หลักของ TradingView ผู้สร้างสคริปต์นี้ได้ทำให้เป็นโอเพนซอร์ส เพื่อให้เทรดเดอร์สามารถตรวจสอบและยืนยันฟังก์ชันการทำงานของมันได้ ขอชื่นชมผู้เขียน! แม้ว่าคุณจะใช้งานได้ฟรี แต่โปรดจำไว้ว่าการเผยแพร่โค้ดซ้ำจะต้องเป็นไปตาม กฎระเบียบการใช้งาน ของเรา
คำจำกัดสิทธิ์ความรับผิดชอบ
ข้อมูลและบทความไม่ได้มีวัตถุประสงค์เพื่อก่อให้เกิดกิจกรรมทางการเงิน, การลงทุน, การซื้อขาย, ข้อเสนอแนะ หรือคำแนะนำประเภทอื่น ๆ ที่ให้หรือรับรองโดย TradingView อ่านเพิ่มเติมใน ข้อกำหนดการใช้งาน