OPEN-SOURCE SCRIPT
Bollinger Cluster Absorption Engine [KNN Engine]
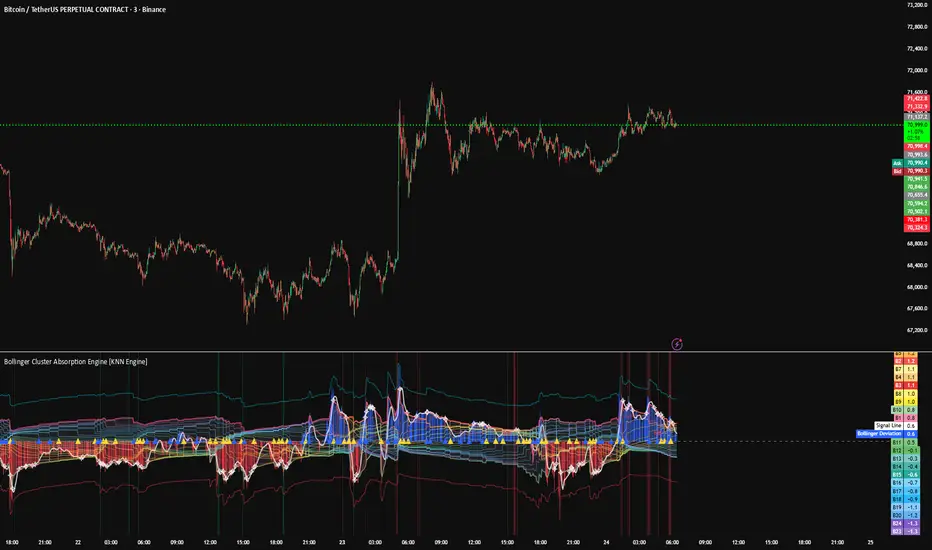
Bollinger Cluster Absorption Engine [KNN Engine]
1. What the Script Does
The Bollinger Cluster Absorption Engine is a high-order structural consensus oscillator designed to identify major trend exhaustion and mean-reversion opportunities. It moves beyond standard Bollinger Bands by evaluating price action across 24 simultaneous Simple Moving Average (SMA) time-horizons.
Furthermore, it introduces a built-in K-Nearest Neighbors (KNN) Machine Learning Algorithm to calculate the statistical probability of a structural mean-reversion bounce based on historical market data.
Rather than relying on a single, arbitrary SMA length, this indicator mathematically aggregates 24 distinct cost-basis cycles to verify if the entire institutional ecosystem is overextended. It visualizes this data through a dynamically scaling histogram, a multi-ribbon fan, and rolling volatility boundaries.
2. The Core Innovation: How it Calculates Everything
Standard moving averages rely on fixed lookback periods (e.g., a 20-SMA), which inherently drop relevant historical data simply because a fixed amount of time has passed. This script is fundamentally original because it abandons fixed lookbacks in favor of Anomaly Anchoring, Expanding SMA Recursion, and Predictive Classification.
Anomaly Anchoring: The engine constantly scans volume for statistical deviations. When it detects a volume spike exceeding a 2.5 Z-Score, it drops a mathematical "Anchor." It tracks the last 24 of these institutional liquidity events simultaneously.
Expanding SMA Recursion: From each of the 24 anchor points, the script begins calculating an independent Simple Moving Average. Unlike EMAs which decay quickly, these SMAs act as a "slow-burn" anchor, retaining the true structural memory of the original volume event.
The Consensus Meta-Mean: The script calculates the absolute average of all 24 active SMA lines. This "Meta-Basis" represents the true structural equilibrium of the market. The distance of price from this average is converted into a Z-Score, standardizing the deviation across any asset class.
The K-Nearest Neighbors (KNN) Engine: When the script detects 100% Consensus (e.g., all 24 active SMAs are simultaneously above or below price), it captures the exact numerical fingerprint of the market (Basis Deviation, Deviation Velocity, and Price Velocity). The KNN engine calculates the Euclidean Distance between the current fingerprint and the last 300 historical fingerprints. It finds the 5 nearest neighbors (the 5 times history looked mathematically identical) and checks their win/loss results to generate a live probability score.
3. Justifying the Methodology
Why combine 24 expanding SMAs with a KNN machine learning model? Because true structural "Fair Value" is rarely defined by a single moving average.
While Exponential Moving Averages (EMAs) are great for tracking fast momentum, Simple Moving Averages (SMAs) are the benchmark for long-term structural stability. By anchoring 24 separate SMAs to actual volume anomalies, we verify if the entire market ecosystem—even the slowest, most structurally sound metrics—agrees on the overextension. By passing that data through a KNN algorithm, we filter out low-quality traps by asking the data: "The last 5 times the structural basis snapped this aggressively, did price successfully reverse by at least 0.1%?"
4. How to Use the Indicator
Visual Layout:
The Structural Fan (Ribbons): 24 individual SMA lines plotted on a standardized Z-axis. When tightly compressed, the structural basis is unanimous. When fanned out, the structural basis is conflicted.
The Engine Histogram: Visualizes the standardized deviation of price from the Meta-Basis using a clean, standardized color baseline: Blue for upward deviation and Red for downward deviation.
Expansion (Bright): Bright Blue or Bright Red bars indicate that price is actively accelerating away from its structural equilibrium.
Contraction (Dark): Dark, highly transparent bars indicate that the move is decaying or cooling off back toward the zero-line.
Tactical Trade Execution:
Spot the Structural Purge: Watch the histogram expand into extreme territory (Bright Blue for bullish potential, Bright Red for bearish potential). Because this is an SMA engine, this happens when price has completely disconnected from its slow-burn institutional fair value. Do not enter yet.
Wait for the Machine Learning Confirmation: Wait for the background to flash Lime (Bullish) or Red (Bearish) with a printed percentage (e.g., 80%). This means the KNN algorithm has verified that identical historical structural snaps successfully reversed price.
The Trigger: Wait for the white Signal Line to peak (often printing an Exhaustion ✧ marker) and begin receding back toward the zero-line, ultimately "re-enveloping" the histogram bars. This confirms that the extreme directional friction has officially snapped, signaling a high-probability mean reversion.
1. What the Script Does
The Bollinger Cluster Absorption Engine is a high-order structural consensus oscillator designed to identify major trend exhaustion and mean-reversion opportunities. It moves beyond standard Bollinger Bands by evaluating price action across 24 simultaneous Simple Moving Average (SMA) time-horizons.
Furthermore, it introduces a built-in K-Nearest Neighbors (KNN) Machine Learning Algorithm to calculate the statistical probability of a structural mean-reversion bounce based on historical market data.
Rather than relying on a single, arbitrary SMA length, this indicator mathematically aggregates 24 distinct cost-basis cycles to verify if the entire institutional ecosystem is overextended. It visualizes this data through a dynamically scaling histogram, a multi-ribbon fan, and rolling volatility boundaries.
2. The Core Innovation: How it Calculates Everything
Standard moving averages rely on fixed lookback periods (e.g., a 20-SMA), which inherently drop relevant historical data simply because a fixed amount of time has passed. This script is fundamentally original because it abandons fixed lookbacks in favor of Anomaly Anchoring, Expanding SMA Recursion, and Predictive Classification.
Anomaly Anchoring: The engine constantly scans volume for statistical deviations. When it detects a volume spike exceeding a 2.5 Z-Score, it drops a mathematical "Anchor." It tracks the last 24 of these institutional liquidity events simultaneously.
Expanding SMA Recursion: From each of the 24 anchor points, the script begins calculating an independent Simple Moving Average. Unlike EMAs which decay quickly, these SMAs act as a "slow-burn" anchor, retaining the true structural memory of the original volume event.
The Consensus Meta-Mean: The script calculates the absolute average of all 24 active SMA lines. This "Meta-Basis" represents the true structural equilibrium of the market. The distance of price from this average is converted into a Z-Score, standardizing the deviation across any asset class.
The K-Nearest Neighbors (KNN) Engine: When the script detects 100% Consensus (e.g., all 24 active SMAs are simultaneously above or below price), it captures the exact numerical fingerprint of the market (Basis Deviation, Deviation Velocity, and Price Velocity). The KNN engine calculates the Euclidean Distance between the current fingerprint and the last 300 historical fingerprints. It finds the 5 nearest neighbors (the 5 times history looked mathematically identical) and checks their win/loss results to generate a live probability score.
3. Justifying the Methodology
Why combine 24 expanding SMAs with a KNN machine learning model? Because true structural "Fair Value" is rarely defined by a single moving average.
While Exponential Moving Averages (EMAs) are great for tracking fast momentum, Simple Moving Averages (SMAs) are the benchmark for long-term structural stability. By anchoring 24 separate SMAs to actual volume anomalies, we verify if the entire market ecosystem—even the slowest, most structurally sound metrics—agrees on the overextension. By passing that data through a KNN algorithm, we filter out low-quality traps by asking the data: "The last 5 times the structural basis snapped this aggressively, did price successfully reverse by at least 0.1%?"
4. How to Use the Indicator
Visual Layout:
The Structural Fan (Ribbons): 24 individual SMA lines plotted on a standardized Z-axis. When tightly compressed, the structural basis is unanimous. When fanned out, the structural basis is conflicted.
The Engine Histogram: Visualizes the standardized deviation of price from the Meta-Basis using a clean, standardized color baseline: Blue for upward deviation and Red for downward deviation.
Expansion (Bright): Bright Blue or Bright Red bars indicate that price is actively accelerating away from its structural equilibrium.
Contraction (Dark): Dark, highly transparent bars indicate that the move is decaying or cooling off back toward the zero-line.
Tactical Trade Execution:
Spot the Structural Purge: Watch the histogram expand into extreme territory (Bright Blue for bullish potential, Bright Red for bearish potential). Because this is an SMA engine, this happens when price has completely disconnected from its slow-burn institutional fair value. Do not enter yet.
Wait for the Machine Learning Confirmation: Wait for the background to flash Lime (Bullish) or Red (Bearish) with a printed percentage (e.g., 80%). This means the KNN algorithm has verified that identical historical structural snaps successfully reversed price.
The Trigger: Wait for the white Signal Line to peak (often printing an Exhaustion ✧ marker) and begin receding back toward the zero-line, ultimately "re-enveloping" the histogram bars. This confirms that the extreme directional friction has officially snapped, signaling a high-probability mean reversion.
สคริปต์แบบโอเพนซอร์ส
ด้วยเจตนารมณ์หลักของ TradingView ผู้สร้างสคริปต์นี้ได้ทำให้เป็นโอเพนซอร์ส เพื่อให้เทรดเดอร์สามารถตรวจสอบและยืนยันฟังก์ชันการทำงานของมันได้ ขอชื่นชมผู้เขียน! แม้ว่าคุณจะใช้งานได้ฟรี แต่โปรดจำไว้ว่าการเผยแพร่โค้ดซ้ำจะต้องเป็นไปตาม กฎระเบียบการใช้งาน ของเรา

คำจำกัดสิทธิ์ความรับผิดชอบ
ข้อมูลและบทความไม่ได้มีวัตถุประสงค์เพื่อก่อให้เกิดกิจกรรมทางการเงิน, การลงทุน, การซื้อขาย, ข้อเสนอแนะ หรือคำแนะนำประเภทอื่น ๆ ที่ให้หรือรับรองโดย TradingView อ่านเพิ่มเติมใน ข้อกำหนดการใช้งาน
สคริปต์แบบโอเพนซอร์ส
ด้วยเจตนารมณ์หลักของ TradingView ผู้สร้างสคริปต์นี้ได้ทำให้เป็นโอเพนซอร์ส เพื่อให้เทรดเดอร์สามารถตรวจสอบและยืนยันฟังก์ชันการทำงานของมันได้ ขอชื่นชมผู้เขียน! แม้ว่าคุณจะใช้งานได้ฟรี แต่โปรดจำไว้ว่าการเผยแพร่โค้ดซ้ำจะต้องเป็นไปตาม กฎระเบียบการใช้งาน ของเรา
คำจำกัดสิทธิ์ความรับผิดชอบ
ข้อมูลและบทความไม่ได้มีวัตถุประสงค์เพื่อก่อให้เกิดกิจกรรมทางการเงิน, การลงทุน, การซื้อขาย, ข้อเสนอแนะ หรือคำแนะนำประเภทอื่น ๆ ที่ให้หรือรับรองโดย TradingView อ่านเพิ่มเติมใน ข้อกำหนดการใช้งาน