Gyroscope CDF [SS]
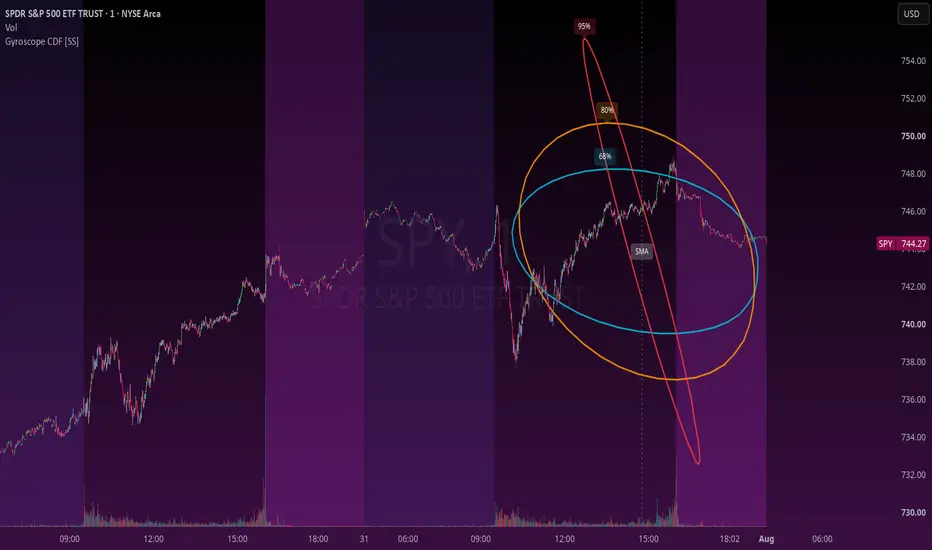
Started as a "can I actually pull off 3D on a 2D chart with an animation that syncs to an actual session" experiment, a rotating gyroscope built from real 3D math (yaw/pitch camera, rotation matrices, a projected unit ring) rendered entirely with polylines and chart points. No image, no library trick, just geometry.
Turns out the shape wasn't just decoration, it's a genuinely useful way to look at intraday range.
How it works:
Each ring is anchored to the daily SMA(14) and daily stdev(14), scaled to the standard normal CDF confidence levels: 1.00σ (~68%), 1.28σ (~80%), and 1.96σ (~95%). So instead of a flat horizontal band, you get three rotating rings that visually collapse toward the SMA as they tumble, and stretch out to their true deviation width at the widest point of the rotation. The whole thing is session-anchored (9:30–16:00), so the gyroscope's width tracks the actual regular session rather than an arbitrary bar count.
How to read it:
Center pole + "SMA" label = the daily mean price is being measured against.
Aqua / orange / red rings = 68% / 80% / 95% deviation bands off that mean.
The rotation itself isn't the signal, it's there so you can see all three bands true radius at a glance instead of three overlapping flat lines. When price pushes toward the outer (red) ring intraday, you're looking at a genuinely stretched move relative to the last two weeks of daily closes. I have also added labels that denote the range confidence levels that each band represents.
Built mostly because a static band chart is easy to glance past, and a rotating one isn't, but it held up as an actual way to gauge whether an intraday move is ordinary noise or something worth paying attention to relative to the recent daily range.
Settings let you tune camera yaw/pitch, session fill (how close the rings reach 9:30/16:00), and ring resolution.
Its currently anchored to intra-day sessions only (daily), but will likely work to expand capability to larger sessions like weekly/monthly in the future and push the update.
As always, hope you enjoy and safe trades everyone!
Turns out the shape wasn't just decoration, it's a genuinely useful way to look at intraday range.
How it works:
Each ring is anchored to the daily SMA(14) and daily stdev(14), scaled to the standard normal CDF confidence levels: 1.00σ (~68%), 1.28σ (~80%), and 1.96σ (~95%). So instead of a flat horizontal band, you get three rotating rings that visually collapse toward the SMA as they tumble, and stretch out to their true deviation width at the widest point of the rotation. The whole thing is session-anchored (9:30–16:00), so the gyroscope's width tracks the actual regular session rather than an arbitrary bar count.
How to read it:
Center pole + "SMA" label = the daily mean price is being measured against.
Aqua / orange / red rings = 68% / 80% / 95% deviation bands off that mean.
The rotation itself isn't the signal, it's there so you can see all three bands true radius at a glance instead of three overlapping flat lines. When price pushes toward the outer (red) ring intraday, you're looking at a genuinely stretched move relative to the last two weeks of daily closes. I have also added labels that denote the range confidence levels that each band represents.
Built mostly because a static band chart is easy to glance past, and a rotating one isn't, but it held up as an actual way to gauge whether an intraday move is ordinary noise or something worth paying attention to relative to the recent daily range.
Settings let you tune camera yaw/pitch, session fill (how close the rings reach 9:30/16:00), and ring resolution.
Its currently anchored to intra-day sessions only (daily), but will likely work to expand capability to larger sessions like weekly/monthly in the future and push the update.
As always, hope you enjoy and safe trades everyone!

Check out the new Website!
merlintrades.net
Get access to:
- Indicators
- Merlin Trading Software
- Discord
- Documentation
merlintrades.net
Get access to:
- Indicators
- Merlin Trading Software
- Discord
- Documentation
คำจำกัดสิทธิ์ความรับผิดชอบ
ข้อมูลและบทความไม่ได้มีวัตถุประสงค์เพื่อก่อให้เกิดกิจกรรมทางการเงิน, การลงทุน, การซื้อขาย, ข้อเสนอแนะ หรือคำแนะนำประเภทอื่น ๆ ที่ให้หรือรับรองโดย TradingView อ่านเพิ่มเติมใน ข้อกำหนดการใช้งาน
Check out the new Website!
merlintrades.net
Get access to:
- Indicators
- Merlin Trading Software
- Discord
- Documentation
merlintrades.net
Get access to:
- Indicators
- Merlin Trading Software
- Discord
- Documentation
คำจำกัดสิทธิ์ความรับผิดชอบ
ข้อมูลและบทความไม่ได้มีวัตถุประสงค์เพื่อก่อให้เกิดกิจกรรมทางการเงิน, การลงทุน, การซื้อขาย, ข้อเสนอแนะ หรือคำแนะนำประเภทอื่น ๆ ที่ให้หรือรับรองโดย TradingView อ่านเพิ่มเติมใน ข้อกำหนดการใช้งาน