Arjoo Indicator
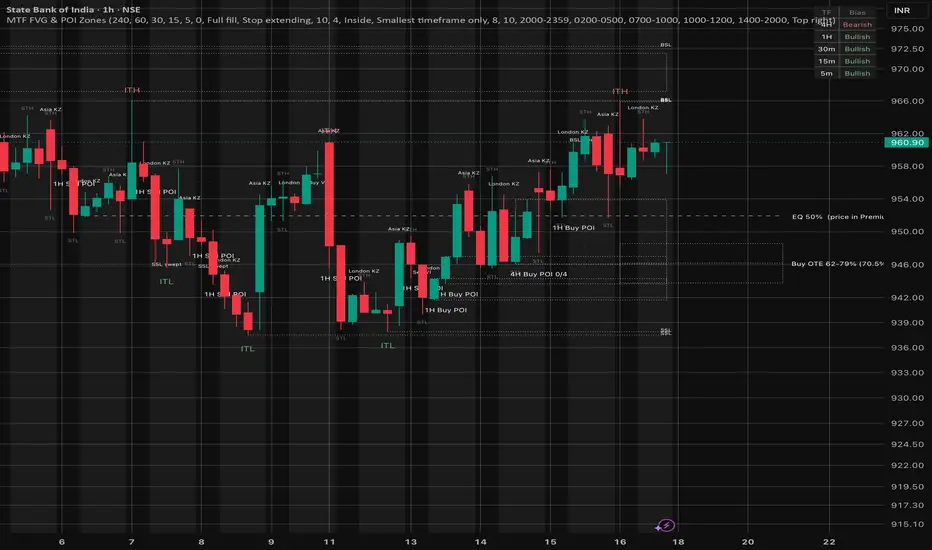
**MTF POI Zones – Multi-Timeframe Point of Interest (SMC)**
This indicator finds Points of Interest (POI) on five timeframes at once (4H, 1H, 30m, 15m and 5m) and draws them on your chart. It highlights the zones where several timeframes line up in the same price range. It also adds smart money concepts (SMC) and ICT tools such as swing structure, liquidity, volume imbalance, equilibrium, OTE, killzones and CBDR, so you can read the market from one script.
**How a POI is found**
The script checks three closed candles on each timeframe:
- Downtrend: candle 1 is a down candle, candle 2 is skipped, and the high wick of candle 3 stays below the low wick of candle 1.
- Uptrend: candle 1 is an up candle, candle 2 is skipped, and the low wick of candle 3 stays above the high wick of candle 1.
- Wicks are used, not bodies. If the wicks of candle 1 and candle 3 touch or overlap, the setup is ignored.
- When the rule holds, the full range of candle 1 is marked as the POI, and candle 2 is the fair value gap (FVG).
POIs are drawn as grey dotted zones. The label sits under the POI candle and shows the timeframe and direction (for example "1H Sell POI"). A zone extends to the right until price mitigates it.
**Multi-timeframe confirmation**
- When a smaller-timeframe POI forms inside a bigger-timeframe POI of the same direction, only the smallest one is shown. Its label lists the bigger timeframes it agrees with (for example "5m Buy POI +15m 1H 4H"). This gives you a precise zone with higher-timeframe backing.
- A 4H POI becomes a Confirmed POI when the 1H, 30m, 15m and 5m POIs all form inside it. You can choose how many lower timeframes must agree.
**Extra tools (each can be switched off)**
- STH / STL and ITH / ITL: short-term and intermediate-term swing highs and lows.
- Liquidity: BSL (buy-side) above each ITH and SSL (sell-side) below each ITL, marked "swept" when price takes them.
- Bias table: Bullish or Bearish for each timeframe, based on closes beyond the last ITH or ITL.
- Volume imbalance (VI): candle bodies that don't overlap while their wicks do.
- Equilibrium (EQ): the 50% level of the last ITH–ITL range, showing whether price is in Premium or Discount.
- OTE: the 62%–79% retracement of the last swing, with the 70.5% level marked.
- Killzones: Asia, London, New York and London close sessions (New York time, 1H charts and lower).
- CBDR: the 14:00–20:00 New York range with ±1 and ±2 range projections.
**How to use**
1. Use a 5m or 1m chart to see all five timeframes. A timeframe only shows when it is equal to or higher than the chart timeframe.
2. Use the bias table and higher-timeframe POIs to choose a direction.
3. Look for a confirmed POI, or a small POI that lines up with bigger timeframes, in Discount for buys or Premium for sells.
4. Use liquidity sweeps, killzones and OTE to time entries.
5. Set alerts for new POIs, Confirmed POIs, zone touches, liquidity sweeps and new ITH/ITL.
**Notes**
- Zones are drawn only after the candle closes, so they do not repaint.
- Killzones and CBDR are designed for markets that trade around the clock, such as forex, gold and crypto. On Indian indices, mainly the London killzone falls in market hours.
- This script is for education and chart analysis only. It is not financial advice and does not guarantee results. Always use your own risk management.
This indicator finds Points of Interest (POI) on five timeframes at once (4H, 1H, 30m, 15m and 5m) and draws them on your chart. It highlights the zones where several timeframes line up in the same price range. It also adds smart money concepts (SMC) and ICT tools such as swing structure, liquidity, volume imbalance, equilibrium, OTE, killzones and CBDR, so you can read the market from one script.
**How a POI is found**
The script checks three closed candles on each timeframe:
- Downtrend: candle 1 is a down candle, candle 2 is skipped, and the high wick of candle 3 stays below the low wick of candle 1.
- Uptrend: candle 1 is an up candle, candle 2 is skipped, and the low wick of candle 3 stays above the high wick of candle 1.
- Wicks are used, not bodies. If the wicks of candle 1 and candle 3 touch or overlap, the setup is ignored.
- When the rule holds, the full range of candle 1 is marked as the POI, and candle 2 is the fair value gap (FVG).
POIs are drawn as grey dotted zones. The label sits under the POI candle and shows the timeframe and direction (for example "1H Sell POI"). A zone extends to the right until price mitigates it.
**Multi-timeframe confirmation**
- When a smaller-timeframe POI forms inside a bigger-timeframe POI of the same direction, only the smallest one is shown. Its label lists the bigger timeframes it agrees with (for example "5m Buy POI +15m 1H 4H"). This gives you a precise zone with higher-timeframe backing.
- A 4H POI becomes a Confirmed POI when the 1H, 30m, 15m and 5m POIs all form inside it. You can choose how many lower timeframes must agree.
**Extra tools (each can be switched off)**
- STH / STL and ITH / ITL: short-term and intermediate-term swing highs and lows.
- Liquidity: BSL (buy-side) above each ITH and SSL (sell-side) below each ITL, marked "swept" when price takes them.
- Bias table: Bullish or Bearish for each timeframe, based on closes beyond the last ITH or ITL.
- Volume imbalance (VI): candle bodies that don't overlap while their wicks do.
- Equilibrium (EQ): the 50% level of the last ITH–ITL range, showing whether price is in Premium or Discount.
- OTE: the 62%–79% retracement of the last swing, with the 70.5% level marked.
- Killzones: Asia, London, New York and London close sessions (New York time, 1H charts and lower).
- CBDR: the 14:00–20:00 New York range with ±1 and ±2 range projections.
**How to use**
1. Use a 5m or 1m chart to see all five timeframes. A timeframe only shows when it is equal to or higher than the chart timeframe.
2. Use the bias table and higher-timeframe POIs to choose a direction.
3. Look for a confirmed POI, or a small POI that lines up with bigger timeframes, in Discount for buys or Premium for sells.
4. Use liquidity sweeps, killzones and OTE to time entries.
5. Set alerts for new POIs, Confirmed POIs, zone touches, liquidity sweeps and new ITH/ITL.
**Notes**
- Zones are drawn only after the candle closes, so they do not repaint.
- Killzones and CBDR are designed for markets that trade around the clock, such as forex, gold and crypto. On Indian indices, mainly the London killzone falls in market hours.
- This script is for education and chart analysis only. It is not financial advice and does not guarantee results. Always use your own risk management.

คำจำกัดสิทธิ์ความรับผิดชอบ
ข้อมูลและบทความไม่ได้มีวัตถุประสงค์เพื่อก่อให้เกิดกิจกรรมทางการเงิน, การลงทุน, การซื้อขาย, ข้อเสนอแนะ หรือคำแนะนำประเภทอื่น ๆ ที่ให้หรือรับรองโดย TradingView อ่านเพิ่มเติมใน ข้อกำหนดการใช้งาน
คำจำกัดสิทธิ์ความรับผิดชอบ
ข้อมูลและบทความไม่ได้มีวัตถุประสงค์เพื่อก่อให้เกิดกิจกรรมทางการเงิน, การลงทุน, การซื้อขาย, ข้อเสนอแนะ หรือคำแนะนำประเภทอื่น ๆ ที่ให้หรือรับรองโดย TradingView อ่านเพิ่มเติมใน ข้อกำหนดการใช้งาน