OPEN-SOURCE SCRIPT
Bar Breakout with ATR
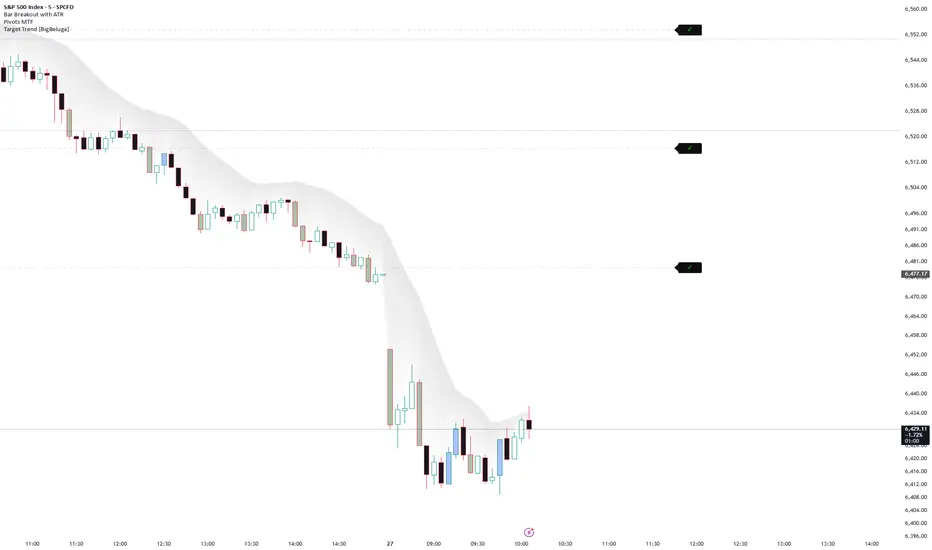
Bar Breakout with ATR — Multi-Timeframe Dashboard
Identifies high-quality breakout bars across multiple timeframes using a combination of ATR-based range filtering and IBS (Internal Bar Strength) confirmation.
How it works:
A bar is flagged as a breakout when three conditions align simultaneously — the close exceeds the prior bar's high (bull) or undercuts the prior bar's low (bear), the bar's range is at least N× the ATR, and the close quality is confirmed via IBS (top of range for bulls, bottom of range for bears). Bars that are large but fail to break are classified as POSS BULL or POSS BEAR — potential coiling setups worth watching.
Features:
Bar coloring — highlights confirmed breakout bars and large-range non-break bars in distinct colors
MTF Dashboard Table — shows the most recent breakout event (BULL BREAK, BEAR BREAK, POSS BULL, POSS BEAR) across up to 5 user-defined timeframes
Context rows — when the latest event on a timeframe is a POSS BULL/BEAR, the table optionally shows the last confirmed break for directional context
Per-bar detail — each table row displays timestamp (CST), low, high, range (with ATR multiple), midpoint, and IBS value
Fully configurable — ATR length, ATR multiplier, IBS thresholds, colors, table position, font sizes, and per-timeframe toggles
Best used on: Equity index futures (ES, NQ), ETFs, or any liquid instrument where breakout structure and range expansion are meaningful signals.
Identifies high-quality breakout bars across multiple timeframes using a combination of ATR-based range filtering and IBS (Internal Bar Strength) confirmation.
How it works:
A bar is flagged as a breakout when three conditions align simultaneously — the close exceeds the prior bar's high (bull) or undercuts the prior bar's low (bear), the bar's range is at least N× the ATR, and the close quality is confirmed via IBS (top of range for bulls, bottom of range for bears). Bars that are large but fail to break are classified as POSS BULL or POSS BEAR — potential coiling setups worth watching.
Features:
Bar coloring — highlights confirmed breakout bars and large-range non-break bars in distinct colors
MTF Dashboard Table — shows the most recent breakout event (BULL BREAK, BEAR BREAK, POSS BULL, POSS BEAR) across up to 5 user-defined timeframes
Context rows — when the latest event on a timeframe is a POSS BULL/BEAR, the table optionally shows the last confirmed break for directional context
Per-bar detail — each table row displays timestamp (CST), low, high, range (with ATR multiple), midpoint, and IBS value
Fully configurable — ATR length, ATR multiplier, IBS thresholds, colors, table position, font sizes, and per-timeframe toggles
Best used on: Equity index futures (ES, NQ), ETFs, or any liquid instrument where breakout structure and range expansion are meaningful signals.
สคริปต์แบบโอเพนซอร์ส
ด้วยเจตนารมณ์หลักของ TradingView ผู้สร้างสคริปต์นี้ได้ทำให้เป็นโอเพนซอร์ส เพื่อให้เทรดเดอร์สามารถตรวจสอบและยืนยันฟังก์ชันการทำงานของมันได้ ขอชื่นชมผู้เขียน! แม้ว่าคุณจะใช้งานได้ฟรี แต่โปรดจำไว้ว่าการเผยแพร่โค้ดซ้ำจะต้องเป็นไปตาม กฎระเบียบการใช้งาน ของเรา

คำจำกัดสิทธิ์ความรับผิดชอบ
ข้อมูลและบทความไม่ได้มีวัตถุประสงค์เพื่อก่อให้เกิดกิจกรรมทางการเงิน, การลงทุน, การซื้อขาย, ข้อเสนอแนะ หรือคำแนะนำประเภทอื่น ๆ ที่ให้หรือรับรองโดย TradingView อ่านเพิ่มเติมใน ข้อกำหนดการใช้งาน
สคริปต์แบบโอเพนซอร์ส
ด้วยเจตนารมณ์หลักของ TradingView ผู้สร้างสคริปต์นี้ได้ทำให้เป็นโอเพนซอร์ส เพื่อให้เทรดเดอร์สามารถตรวจสอบและยืนยันฟังก์ชันการทำงานของมันได้ ขอชื่นชมผู้เขียน! แม้ว่าคุณจะใช้งานได้ฟรี แต่โปรดจำไว้ว่าการเผยแพร่โค้ดซ้ำจะต้องเป็นไปตาม กฎระเบียบการใช้งาน ของเรา
คำจำกัดสิทธิ์ความรับผิดชอบ
ข้อมูลและบทความไม่ได้มีวัตถุประสงค์เพื่อก่อให้เกิดกิจกรรมทางการเงิน, การลงทุน, การซื้อขาย, ข้อเสนอแนะ หรือคำแนะนำประเภทอื่น ๆ ที่ให้หรือรับรองโดย TradingView อ่านเพิ่มเติมใน ข้อกำหนดการใช้งาน