ที่อัปเดต:
BUY SELL PLAN ORDERS
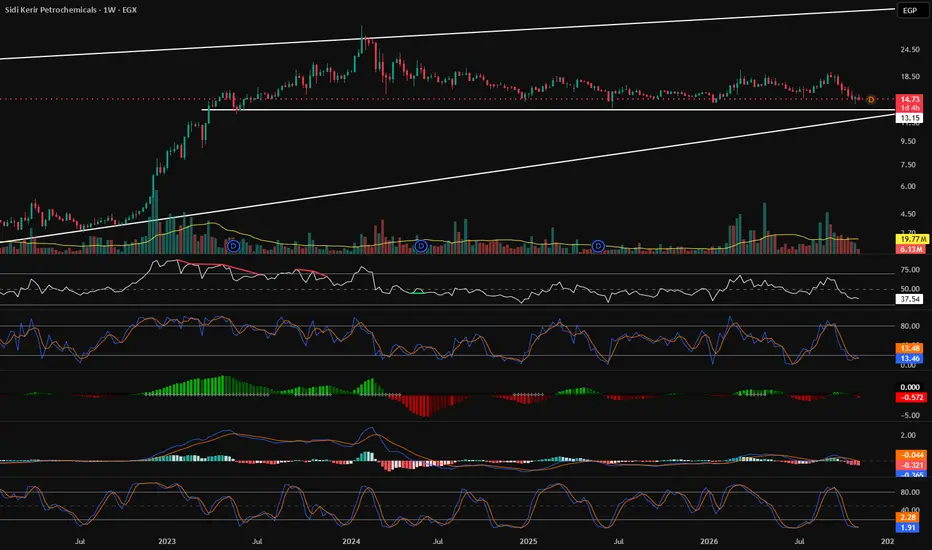
Buy Sell Plan Orders draws a personal trading plan on the chart: your average price, planned buy levels, planned sell levels, and markers for trades you already made. It does not generate signals or analyse price. It only displays the levels you type in.
How it works
The script reads three text inputs and draws each item as a labelled line or marker.
Levels: name|price|kind; where kind is a (average, dashed orange line), b (buy level, dotted blue line) or s (sell level, dotted green line). Example: Avg|128.5|a;Buy 2|115|b;Sell 1|150|s;
Trades: time|price|side; where time is a Unix timestamp in milliseconds and side is b (buy) or s (sell). Each trade shows as a small B or S marker at that price and date.
Lines: time1|price1|time2|price2|kind; where kind is t (trend line), r (ray), h (horizontal price line) or x (box).
Up to 10 levels, 12 trades and 12 lines. Labels sit to the right of the last bar so they don't cover the candles. Empty inputs draw nothing.
Use
Add the indicator, open its settings and fill the inputs. This keeps a plan visible on any symbol and timeframe without redrawing it by hand.
This script is for visualising your own plan only. It is not financial advice.
How it works
The script reads three text inputs and draws each item as a labelled line or marker.
Levels: name|price|kind; where kind is a (average, dashed orange line), b (buy level, dotted blue line) or s (sell level, dotted green line). Example: Avg|128.5|a;Buy 2|115|b;Sell 1|150|s;
Trades: time|price|side; where time is a Unix timestamp in milliseconds and side is b (buy) or s (sell). Each trade shows as a small B or S marker at that price and date.
Lines: time1|price1|time2|price2|kind; where kind is t (trend line), r (ray), h (horizontal price line) or x (box).
Up to 10 levels, 12 trades and 12 lines. Labels sit to the right of the last bar so they don't cover the candles. Empty inputs draw nothing.
Use
Add the indicator, open its settings and fill the inputs. This keeps a plan visible on any symbol and timeframe without redrawing it by hand.
This script is for visualising your own plan only. It is not financial advice.
Release Note
fix bugsRelease Note
fixRelease Note
fixRelease Note
fixRelease Note
fixRelease Note
fixRelease Note
Plan levels overlay for a personal buy and sell plan.Inputs are filled by an external app:
- Levels: list of "name|price|kind;" where kind is a (average), b (planned buy) or s (planned sell). Any other kind is drawn as a light dotted line (used for the average if all planned buys fill).
- Trades: optional past buy and sell marks.
What it draws:
- One horizontal line per level across the whole chart: average dashed yellow, buys dotted blue, sells dotted green.
- A small text label in the line colour just above each line.
- Price-scale labels on the right axis for the current average (yellow) and the average if all planned buys fill (white).
The script only displays the levels it is given. It does not generate signals and is not financial advice.
Release Note
Plan levels overlay for a personal buy and sell plan.Inputs are filled by an external app:
- Levels: list of "name|price|kind;" where kind is a (average), b (planned buy) or s (planned sell). Any other kind is drawn as a light dotted line (used for the average if all planned buys fill).
- Trades: optional past buy and sell marks.
What it draws:
- One horizontal line per level across the whole chart: average dashed yellow, buys dotted blue, sells dotted green.
- A small text label in the line colour just above each line.
- Price-scale labels on the right axis for the current average (yellow) and the average if all planned buys fill (white).
The script only displays the levels it is given. It does not generate signals and is not financial advice.
Release Note
Plan levels overlay for a personal buy and sell plan.Inputs are filled by an external app:
- Levels: list of "name|price|kind;" where kind is a (average), b (planned buy) or s (planned sell). Any other kind is drawn as a light dotted line (used for the average if all planned buys fill).
- Trades: optional past buy and sell marks.
What it draws:
- One horizontal line per level across the whole chart: average dashed yellow, buys dotted blue, sells dotted green.
- A small text label in the line colour just above each line.
- Price-scale labels on the right axis for the current average (yellow) and the average if all planned buys fill (white).
The script only displays the levels it is given. It does not generate signals and is not financial advice.
Release Note
New changesRelease Note
v4
คำจำกัดสิทธิ์ความรับผิดชอบ
ข้อมูลและบทความไม่ได้มีวัตถุประสงค์เพื่อก่อให้เกิดกิจกรรมทางการเงิน, การลงทุน, การซื้อขาย, ข้อเสนอแนะ หรือคำแนะนำประเภทอื่น ๆ ที่ให้หรือรับรองโดย TradingView อ่านเพิ่มเติมใน ข้อกำหนดการใช้งาน
คำจำกัดสิทธิ์ความรับผิดชอบ
ข้อมูลและบทความไม่ได้มีวัตถุประสงค์เพื่อก่อให้เกิดกิจกรรมทางการเงิน, การลงทุน, การซื้อขาย, ข้อเสนอแนะ หรือคำแนะนำประเภทอื่น ๆ ที่ให้หรือรับรองโดย TradingView อ่านเพิ่มเติมใน ข้อกำหนดการใช้งาน