OPEN-SOURCE SCRIPT
CTA Exhaustion Proxy with Asymmetric VIX
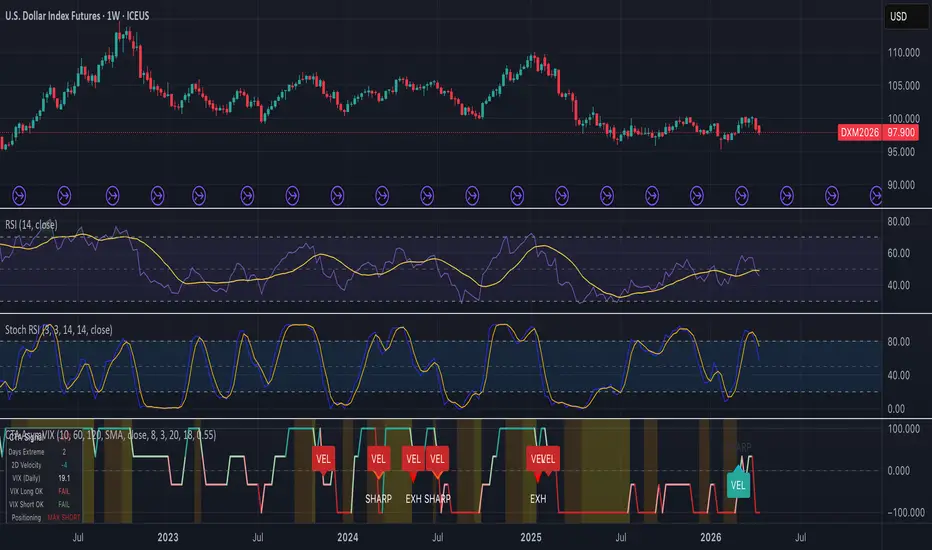
A positioning-based reversal system that tracks trend-following fund crowding and exhaustion.
This indicator estimates when systematic trend-following funds (CTAs) are trapped at maximum positioning and likely to be forced into rapid covering or liquidation. It combines three timeframes of moving-average positioning with asymmetric volatility filters to identify high-probability reversal setups.
WHAT IT TRACKS
CTAs are mechanical trend-followers. When they all align on one side of the market (max long or max short), the risk of a violent reversal increases. This proxy scores their estimated positioning on a -3 to +3 scale:
-3 = Max short — all three trend signals bearish. Forced-cover risk is highest.
+3 = Max long — all three trend signals bullish. Forced-liquidation risk is highest.
The score is derived from price relative to 10, 60, and 120-period moving averages.
THE THREE SIGNALS
VEL (Label box) — Score velocity >= 2 points in 2 days + 10 MA break. Early warning. Reduce exposure or prepare to trade.
SHARP (Diamond) — 3 to 7 days at extreme + high velocity + 10 MA reclaim/break. Primary entry. Catches V-shaped reversals.
EXH (Triangle) — 8+ days at extreme + 10 MA reclaim/break. Higher-confidence entry. Slower, but more reliable.
ASYMMETRIC VIX REGIME
The indicator uses different volatility thresholds for longs and shorts:
Long signals require VIX > 20. You need fear to create a vacuum for short-covering to explode.
Short signals require VIX < 18. You need complacency for maximum position sizing and no hedges underneath.
VIX is pulled from daily data regardless of chart timeframe.
BACKGROUND COLORS
Orange = 3+ days at +/-3 (early crowding alert)
Gold = 8+ days at +/-3 (maximum exhaustion)
HOW TO TRADE IT
For Longs (Bullish Reversal):
Wait for score to hit -3 (background turns orange).
Confirm VIX > 20 (table shows PASS).
Enter on SHARP diamond (aggressive) or EXH triangle (conservative).
Stop below the 10-period MA.
For Shorts (Bearish Reversal):
Wait for score to hit +3 (background turns orange).
Confirm VIX < 18 (table shows PASS).
Enter on SHARP diamond (aggressive) or EXH triangle (conservative).
Stop above the 10-period MA.
RECOMMENDED SETTINGS & CHARTS
Apply this to ES1! (E-mini S&P 500) for equity positioning, ZN1! (10Y Treasury futures) for bond flows, or GC1! (Gold) for commodity positioning. Use daily or 4h timeframes for cleanest signals.
Default inputs:
Fast MA: 10
Medium MA: 60
Slow MA: 120
Sharp threshold: 3 days
Slow threshold: 8 days
VIX long min: 20
VIX short max: 18
DISCLAIMER
This is a proxy model based on estimated systematic positioning, not actual CTA order flow. Signals are probabilistic, not predictive. Always use risk management and confirm with price action before trading.
This indicator estimates when systematic trend-following funds (CTAs) are trapped at maximum positioning and likely to be forced into rapid covering or liquidation. It combines three timeframes of moving-average positioning with asymmetric volatility filters to identify high-probability reversal setups.
WHAT IT TRACKS
CTAs are mechanical trend-followers. When they all align on one side of the market (max long or max short), the risk of a violent reversal increases. This proxy scores their estimated positioning on a -3 to +3 scale:
-3 = Max short — all three trend signals bearish. Forced-cover risk is highest.
+3 = Max long — all three trend signals bullish. Forced-liquidation risk is highest.
The score is derived from price relative to 10, 60, and 120-period moving averages.
THE THREE SIGNALS
VEL (Label box) — Score velocity >= 2 points in 2 days + 10 MA break. Early warning. Reduce exposure or prepare to trade.
SHARP (Diamond) — 3 to 7 days at extreme + high velocity + 10 MA reclaim/break. Primary entry. Catches V-shaped reversals.
EXH (Triangle) — 8+ days at extreme + 10 MA reclaim/break. Higher-confidence entry. Slower, but more reliable.
ASYMMETRIC VIX REGIME
The indicator uses different volatility thresholds for longs and shorts:
Long signals require VIX > 20. You need fear to create a vacuum for short-covering to explode.
Short signals require VIX < 18. You need complacency for maximum position sizing and no hedges underneath.
VIX is pulled from daily data regardless of chart timeframe.
BACKGROUND COLORS
Orange = 3+ days at +/-3 (early crowding alert)
Gold = 8+ days at +/-3 (maximum exhaustion)
HOW TO TRADE IT
For Longs (Bullish Reversal):
Wait for score to hit -3 (background turns orange).
Confirm VIX > 20 (table shows PASS).
Enter on SHARP diamond (aggressive) or EXH triangle (conservative).
Stop below the 10-period MA.
For Shorts (Bearish Reversal):
Wait for score to hit +3 (background turns orange).
Confirm VIX < 18 (table shows PASS).
Enter on SHARP diamond (aggressive) or EXH triangle (conservative).
Stop above the 10-period MA.
RECOMMENDED SETTINGS & CHARTS
Apply this to ES1! (E-mini S&P 500) for equity positioning, ZN1! (10Y Treasury futures) for bond flows, or GC1! (Gold) for commodity positioning. Use daily or 4h timeframes for cleanest signals.
Default inputs:
Fast MA: 10
Medium MA: 60
Slow MA: 120
Sharp threshold: 3 days
Slow threshold: 8 days
VIX long min: 20
VIX short max: 18
DISCLAIMER
This is a proxy model based on estimated systematic positioning, not actual CTA order flow. Signals are probabilistic, not predictive. Always use risk management and confirm with price action before trading.
สคริปต์โอเพนซอร์ซ
ด้วยเจตนารมณ์หลักของ TradingView ผู้สร้างสคริปต์นี้ได้ทำให้เป็นโอเพนซอร์ส เพื่อให้เทรดเดอร์สามารถตรวจสอบและยืนยันฟังก์ชันการทำงานของมันได้ ขอชื่นชมผู้เขียน! แม้ว่าคุณจะใช้งานได้ฟรี แต่โปรดจำไว้ว่าการเผยแพร่โค้ดซ้ำจะต้องเป็นไปตาม กฎระเบียบการใช้งาน ของเรา

คำจำกัดสิทธิ์ความรับผิดชอบ
ข้อมูลและบทความไม่ได้มีวัตถุประสงค์เพื่อก่อให้เกิดกิจกรรมทางการเงิน, การลงทุน, การซื้อขาย, ข้อเสนอแนะ หรือคำแนะนำประเภทอื่น ๆ ที่ให้หรือรับรองโดย TradingView อ่านเพิ่มเติมใน ข้อกำหนดการใช้งาน
สคริปต์โอเพนซอร์ซ
ด้วยเจตนารมณ์หลักของ TradingView ผู้สร้างสคริปต์นี้ได้ทำให้เป็นโอเพนซอร์ส เพื่อให้เทรดเดอร์สามารถตรวจสอบและยืนยันฟังก์ชันการทำงานของมันได้ ขอชื่นชมผู้เขียน! แม้ว่าคุณจะใช้งานได้ฟรี แต่โปรดจำไว้ว่าการเผยแพร่โค้ดซ้ำจะต้องเป็นไปตาม กฎระเบียบการใช้งาน ของเรา
คำจำกัดสิทธิ์ความรับผิดชอบ
ข้อมูลและบทความไม่ได้มีวัตถุประสงค์เพื่อก่อให้เกิดกิจกรรมทางการเงิน, การลงทุน, การซื้อขาย, ข้อเสนอแนะ หรือคำแนะนำประเภทอื่น ๆ ที่ให้หรือรับรองโดย TradingView อ่านเพิ่มเติมใน ข้อกำหนดการใช้งาน