Buyer vs Seller Pressure
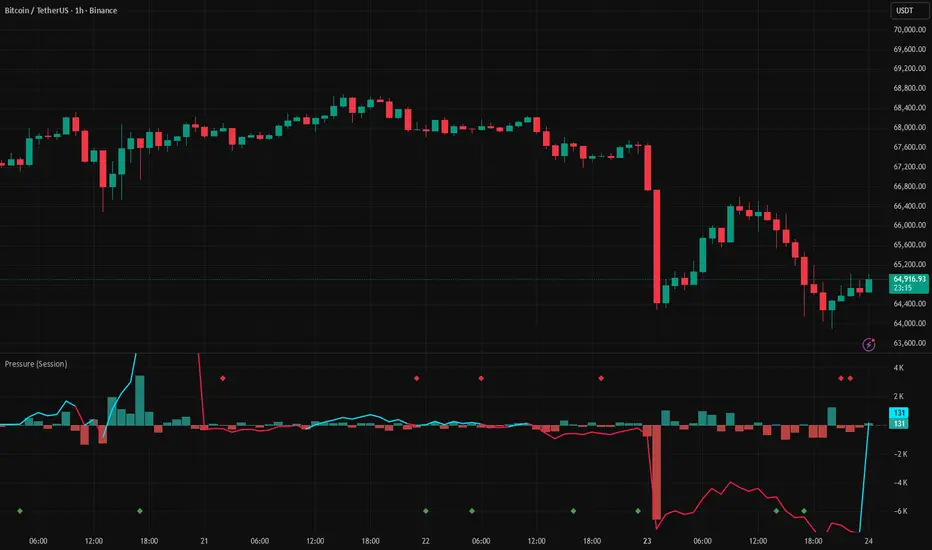
Find out who's really winning each candle — buyers or sellers.
Volume tells you how much trading happened. This indicator goes further — it estimates who won. Every candle is broken down to calculate how much of its volume was driven by buying pressure versus selling pressure. The result is shown as a histogram for each bar, plus a running score that reveals which side has been accumulating dominance over the entire session.
──── What You're Looking At ────
──── The Absorption Signal ────
The most powerful feature of this indicator is detecting absorption — moments where the price moved in one direction on the surface, but the actual volume pressure went the opposite way. This is often a sign that large participants were quietly working against the visible move:
──── How to Read It ────
──── Settings ────
Settings
Colors
──── Alerts ────
──── Tips ────
Volume tells you how much trading happened. This indicator goes further — it estimates who won. Every candle is broken down to calculate how much of its volume was driven by buying pressure versus selling pressure. The result is shown as a histogram for each bar, plus a running score that reveals which side has been accumulating dominance over the entire session.
──── What You're Looking At ────
- Green histogram bars — buyers dominated that candle. More volume was transacted at the ask (buyers lifting offers) than at the bid.
- Red histogram bars — sellers dominated that candle. More volume was transacted at the bid (sellers hitting bids).
- Teal/cyan line (rising, above zero) — cumulative buying has dominated since the last reset. Buyers are in control overall.
- Red line (falling, below zero) — cumulative selling has dominated. Sellers are in control overall.
- Diamond dots — absorption signals (see below).
──── The Absorption Signal ────
The most powerful feature of this indicator is detecting absorption — moments where the price moved in one direction on the surface, but the actual volume pressure went the opposite way. This is often a sign that large participants were quietly working against the visible move:
- Red diamond (top of panel) — the candle closed up, but sellers controlled more of the volume. Smart money may have been selling into the rally. Watch for the move to stall or reverse.
- Green diamond (bottom of panel) — the candle closed down, but buyers controlled more of the volume. Smart money may have been buying the dip quietly. Watch for the move to stall or reverse.
──── How to Read It ────
- Compare candle direction vs histogram color. A green candle with a green bar is genuine buying. A green candle with a red bar is a warning — the price went up but sellers were in control of the volume.
- Watch the cumulative line direction relative to price. If price is rising but the cumulative line is flat or falling, buying pressure is not supporting the move. This is a divergence worth watching.
- When the cumulative line crosses zero, the session has shifted from net-buying to net-selling (or vice versa) — a meaningful change in who is in control.
- Cluster of absorption diamonds at a key level (support, resistance, fair value) signals that someone large is operating there. These are the highest-quality absorption signals.
──── Settings ────
Settings
- CVD Reset Period — when to zero out the running total and start fresh:
- Session — resets daily. Best for intraday analysis.
- Week — resets every Monday.
- Month — resets at the start of each month.
- Never — accumulates continuously without resetting. Useful for spotting large structural shifts over weeks or months.
- Show Per-Bar Delta Histogram — toggle the bar-by-bar buying vs selling columns.
- Show Cumulative Delta Line — toggle the running session total line.
- Show Intrabar Divergence Dots — toggle the absorption diamond markers.
Colors
- Delta Bullish / Bearish — colors for the histogram bars (per-candle).
- CVD Bullish / Bearish — colors for the cumulative line when it is above or below zero.
──── Alerts ────
- CVD Crossed Above Zero — buying pressure is now dominant for the session
- CVD Crossed Below Zero — selling pressure is now dominant for the session
- Seller Absorption — price moved up but sellers dominated the volume
- Buyer Absorption — price moved down but buyers dominated the volume
──── Tips ────
- This indicator works best on intraday timeframes (1m–15m) with Session reset. The shorter the bar, the more meaningful individual delta readings become.
- The most powerful signal this indicator produces is cumulative line divergence from price — price making a new session high while the cumulative line is falling. This is a classic distribution pattern used by institutional traders to identify hidden selling.
- Do not act on absorption signals alone. Use them as confirmation when they appear at a key level — near the fair value line, at obvious support or resistance, or at a previous day's high or low.
- Combine with Fair Value Zones: absorption signals that appear near the fair value line carry significantly more weight than those in the middle of a range.
- Limitation to be aware of: Without direct access to exchange tick data, buying and selling volume is estimated from candle structure. The readings are a reliable guide and widely used by professional traders, but they are approximations rather than exact figures. Real tick-level data requires a specialist data provider.

คำจำกัดสิทธิ์ความรับผิดชอบ
ข้อมูลและบทความไม่ได้มีวัตถุประสงค์เพื่อก่อให้เกิดกิจกรรมทางการเงิน, การลงทุน, การซื้อขาย, ข้อเสนอแนะ หรือคำแนะนำประเภทอื่น ๆ ที่ให้หรือรับรองโดย TradingView อ่านเพิ่มเติมใน ข้อกำหนดการใช้งาน
คำจำกัดสิทธิ์ความรับผิดชอบ
ข้อมูลและบทความไม่ได้มีวัตถุประสงค์เพื่อก่อให้เกิดกิจกรรมทางการเงิน, การลงทุน, การซื้อขาย, ข้อเสนอแนะ หรือคำแนะนำประเภทอื่น ๆ ที่ให้หรือรับรองโดย TradingView อ่านเพิ่มเติมใน ข้อกำหนดการใช้งาน