ที่อัปเดต:
Smart RSI Concepts Pro [MarkitTick]
Get this and other exclusive indicators in MarkitTick
This indicator is part of MarkitTick's Paid Space. Subscribe for $43.75/month to use it on your charts along with the author's other exclusive indicators. You pay right on TradingView and get access straight away.
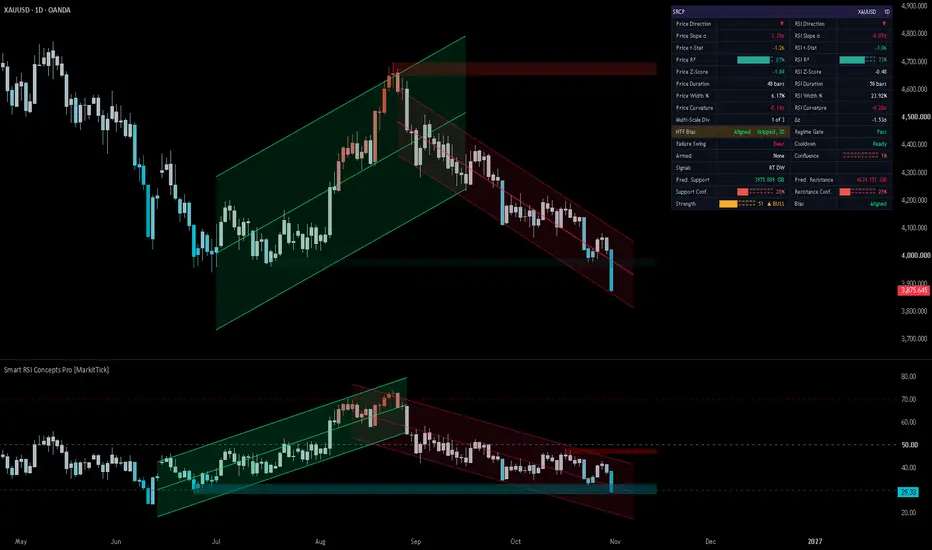
Explore MarkitTick💡 The Smart RSI Concepts Pro is a comprehensive, multi-dimensional momentum and structural analysis suite. Rather than relying on a standard single-line oscillator, this tool reimagines the Relative Strength Index (RSI) by transforming it into a fully mapped environment complete with candlesticks, dynamic regression channels, order blocks, and divergence tracking. It is designed to bridge the gap between price action and momentum, displaying advanced metrics natively on the oscillator panel while simultaneously projecting critical structural data directly onto your main price chart.
This is the professional version of the free indicator Smart RSI Candles
✨ Originality and Utility
● Bridging Price and Momentum
Standard oscillators often fail to provide structural context, leaving traders to guess where true support and resistance lie within momentum. This tool's originality stems from applying price-action concepts—specifically Order Blocks and Statistical Regression—directly to the RSI data series. By doing so, it creates a unified analytical framework where momentum has its own distinct market structure.
● Advanced Confluence
The utility of this indicator lies in its ability to synthesize multiple data points into a single "Regression Compass" dashboard. It eliminates the need for traders to manually cross-reference different indicators by computationally comparing the slope, trajectory, and statistical quality (R-Squared) of the price trend against the momentum trend in real-time.
🔬 Methodology and Concepts
● Algorithmic Core and Statistical Modeling
Due to the proprietary nature of this tool, the internal calculations are abstracted. At its foundation, the indicator utilizes a dynamic statistical engine that continuously evaluates an array of data points to form structural regression channels. Instead of static lookbacks, the algorithm identifies structural pivots in both price and momentum, anchoring its calculations to these significant turning points.
● Relative Strength Scaling
The script employs an internal scaling mechanism that intelligently maps price wicks and bodies to the constrained 0-100 RSI environment. This allows for the plotting of true "RSI Candlesticks," representing not just the close of momentum, but the intra-bar volatility of momentum relative to price.
● Structural Order Blocks
Order block logic is applied by scanning for specific volatility thresholds and structural shifts. When a significant momentum pivot is confirmed, the system projects a defensive zone (the Order Block) forward in time. This logic runs concurrently on both the price data and the RSI data, offering dual-layer support and resistance analysis.
🎨 Visual Guide
● RSI Candlesticks and Heatmap
● Order Blocks (OB)
● Regression Channels

● Regression Channels
● Divergence Markers

● Regression Compass (Dashboard)
📖 How to Use
● Identifying Trend Exhaustion
Monitor the RSI candlesticks as they approach the upper or lower regression bands. If a candlestick enters a "Hot" or "Cold" heatmap state while simultaneously touching an Order Block and the outer edge of the regression channel, it presents a high-probability mean-reversion setup.
● Trading Divergences
Use the automated divergence tags to spot hidden shifts. A Regular Bullish Divergence ("R" label) appearing at the lower boundary of an upward-sloping regression channel provides a strong foundation for a long position, as it indicates underlying strength despite price weakness.
● Slope Confluence
Consult the Regression Compass table before entering a trade. Ensure the "Alignment" badge reads "ALIGNED," meaning both the Price Channel and the RSI Channel are moving in the same mathematical direction. A divergent state warns of potential chop or an impending reversal.
⚙️ Inputs and Settings
• RSI and Benchmark Settings

Adjust the core RSI length (default is often 14). You can also toggle "Relative RSI," allowing you to compare the current asset's momentum against a macroeconomic benchmark (like the DJI).
• Regression Sensitivities
Modify the "Structural Sensitivity" and "Deviation Factor" to dictate how tightly the regression channels hug the data. A higher deviation factor creates wider bands, capturing more volatility before signaling a breakout.
• Display Toggles
The indicator is highly modular. You can independently toggle the visibility of Price Order Blocks, RSI Order Blocks, Divergence lines, and the Regression Compass dashboard to keep your workspace clean.
• Alert Conditions
Set up custom notifications for when price or momentum breaks a channel, retests a midline, forms a new structural channel, or flashes a severe slope divergence.
🔍 Deconstruction of the Underlying Scientific and Academic Framework
● Momentum Oscillator Theory
The foundation of the script rests on J. Welles Wilder's Relative Strength Index, which measures the velocity and magnitude of directional price movements. However, this tool expands on classical theory by treating the 0-100 bound range not just as a gauge, but as a spatial environment subject to its own laws of supply and demand (visualized via Order Blocks).
● Linear Regression and Ordinary Least Squares (OLS)
To determine trajectory, the algorithm utilizes a proprietary adaptation of OLS regression. This statistical method calculates the line of best fit through a series of data points by minimizing the sum of the squares of the vertical deviations. The script constantly recalculates this fit based on dynamic structural anchors rather than arbitrary time periods.
● Coefficient of Determination (R²) and Z-Scoring
The tool evaluates the reliability of its own channels using R-Squared metrics, ensuring that traders are only presented with statistically significant trends. Furthermore, Z-Scoring is applied to measure exactly how many standard deviations the current data point is from the statistical mean, providing an empirical measurement of "overbought" or "oversold" rather than relying on static 70/30 thresholds.
⚠️ Disclaimer
All provided scripts and indicators are strictly for educational exploration and must not be interpreted as financial advice or a recommendation to execute trades. I expressly disclaim all liability for any financial losses or damages that may result, directly or indirectly, from the reliance on or application of these tools. Market participation carries inherent risk where past performance never guarantees future returns, leaving all investment decisions and due diligence solely at your own discretion.
This is the professional version of the free indicator Smart RSI Candles
✨ Originality and Utility
● Bridging Price and Momentum
Standard oscillators often fail to provide structural context, leaving traders to guess where true support and resistance lie within momentum. This tool's originality stems from applying price-action concepts—specifically Order Blocks and Statistical Regression—directly to the RSI data series. By doing so, it creates a unified analytical framework where momentum has its own distinct market structure.
● Advanced Confluence
The utility of this indicator lies in its ability to synthesize multiple data points into a single "Regression Compass" dashboard. It eliminates the need for traders to manually cross-reference different indicators by computationally comparing the slope, trajectory, and statistical quality (R-Squared) of the price trend against the momentum trend in real-time.
🔬 Methodology and Concepts
● Algorithmic Core and Statistical Modeling
Due to the proprietary nature of this tool, the internal calculations are abstracted. At its foundation, the indicator utilizes a dynamic statistical engine that continuously evaluates an array of data points to form structural regression channels. Instead of static lookbacks, the algorithm identifies structural pivots in both price and momentum, anchoring its calculations to these significant turning points.
● Relative Strength Scaling
The script employs an internal scaling mechanism that intelligently maps price wicks and bodies to the constrained 0-100 RSI environment. This allows for the plotting of true "RSI Candlesticks," representing not just the close of momentum, but the intra-bar volatility of momentum relative to price.
● Structural Order Blocks
Order block logic is applied by scanning for specific volatility thresholds and structural shifts. When a significant momentum pivot is confirmed, the system projects a defensive zone (the Order Block) forward in time. This logic runs concurrently on both the price data and the RSI data, offering dual-layer support and resistance analysis.
🎨 Visual Guide
● RSI Candlesticks and Heatmap
- Candles: The traditional RSI line is replaced (or accompanied) by full candlesticks, illustrating open, high, low, and close momentum values.
- Heatmap Colors: The candles change color dynamically based on extreme readings. Cool colors (teals/blues) represent oversold or cold zones, neutral greys represent the midline, and warm/hot colors (reds/crimson) represent overbought conditions.
● Order Blocks (OB)
- Bullish OB: Displayed as green-tinted boxes extending to the right from structural lows, acting as momentum or price support.
- Bearish OB: Displayed as red-tinted boxes extending from structural highs, acting as overhead resistance.
"A structural momentum lead is identified: The RSI has successfully mitigated the 'Bullish Order Block' zone, establishing it as a firm support level. Conversely, the Price Action remains in a 'Premium' state relative to its own primary Order Block, failing to reach the equivalent structural support. This lead-lag disparity suggests a preemptive accumulation phase within the RSI oscillator ahead of a potential price reversal."
"Confirmed Accumulation Phase: The RSI successfully mitigated the Bullish Order Block (OB) ahead of Price Action, serving as a leading indicator for the current reversal. This structural disparity proves that momentum found support while Price remained in a premium discount zone, validating the strength of the move."
● Regression Channels
● Regression Channels
- Trend Lines: Solid or dashed median lines with upper and lower boundary bands. Green indicates an upward trajectory, red indicates downward, and grey denotes a sideways or statistically insignificant trend.
- Fills: Translucent shading between the upper and lower bounds to visually enclose the volatility range.
● Divergence Markers
- "R" Labels: Solid shapes indicating Regular Divergence (trend reversal signals).
- "H" Labels: Dashed lines and shapes indicating Hidden Divergence (trend continuation signals).
● Regression Compass (Dashboard)
- Table Metrics: A sophisticated table that tracks the mathematical Angle, Slope per bar, R² (trend quality), and Z-Score (standard deviation extreme) for both Price and RSI.
- Strength Score & Alignment: A composite score out of 100 rating the current setup, along with an alignment badge confirming if price and momentum agree.
📖 How to Use
● Identifying Trend Exhaustion
Monitor the RSI candlesticks as they approach the upper or lower regression bands. If a candlestick enters a "Hot" or "Cold" heatmap state while simultaneously touching an Order Block and the outer edge of the regression channel, it presents a high-probability mean-reversion setup.
● Trading Divergences
Use the automated divergence tags to spot hidden shifts. A Regular Bullish Divergence ("R" label) appearing at the lower boundary of an upward-sloping regression channel provides a strong foundation for a long position, as it indicates underlying strength despite price weakness.
● Slope Confluence
Consult the Regression Compass table before entering a trade. Ensure the "Alignment" badge reads "ALIGNED," meaning both the Price Channel and the RSI Channel are moving in the same mathematical direction. A divergent state warns of potential chop or an impending reversal.
⚙️ Inputs and Settings
• RSI and Benchmark Settings
Adjust the core RSI length (default is often 14). You can also toggle "Relative RSI," allowing you to compare the current asset's momentum against a macroeconomic benchmark (like the DJI).
• Regression Sensitivities
Modify the "Structural Sensitivity" and "Deviation Factor" to dictate how tightly the regression channels hug the data. A higher deviation factor creates wider bands, capturing more volatility before signaling a breakout.
• Display Toggles
The indicator is highly modular. You can independently toggle the visibility of Price Order Blocks, RSI Order Blocks, Divergence lines, and the Regression Compass dashboard to keep your workspace clean.
• Alert Conditions
Set up custom notifications for when price or momentum breaks a channel, retests a midline, forms a new structural channel, or flashes a severe slope divergence.
🔍 Deconstruction of the Underlying Scientific and Academic Framework
● Momentum Oscillator Theory
The foundation of the script rests on J. Welles Wilder's Relative Strength Index, which measures the velocity and magnitude of directional price movements. However, this tool expands on classical theory by treating the 0-100 bound range not just as a gauge, but as a spatial environment subject to its own laws of supply and demand (visualized via Order Blocks).
● Linear Regression and Ordinary Least Squares (OLS)
To determine trajectory, the algorithm utilizes a proprietary adaptation of OLS regression. This statistical method calculates the line of best fit through a series of data points by minimizing the sum of the squares of the vertical deviations. The script constantly recalculates this fit based on dynamic structural anchors rather than arbitrary time periods.
● Coefficient of Determination (R²) and Z-Scoring
The tool evaluates the reliability of its own channels using R-Squared metrics, ensuring that traders are only presented with statistically significant trends. Furthermore, Z-Scoring is applied to measure exactly how many standard deviations the current data point is from the statistical mean, providing an empirical measurement of "overbought" or "oversold" rather than relying on static 70/30 thresholds.
⚠️ Disclaimer
All provided scripts and indicators are strictly for educational exploration and must not be interpreted as financial advice or a recommendation to execute trades. I expressly disclaim all liability for any financial losses or damages that may result, directly or indirectly, from the reliance on or application of these tools. Market participation carries inherent risk where past performance never guarantees future returns, leaving all investment decisions and due diligence solely at your own discretion.
Release Note
🎨Refined the primary chart visualization by transitioning from overlapping candle layers to a direct bar coloring method for a more seamless and professional heatmap integration.Release Note
Upgraded the regression channel pipeline with an advanced, dual-state rendering architecture to maximize execution efficiency and deliver institutional-grade graphical performance.Release Note
Format and optimize user settingsRelease Note
Optimizing indicator performance and execution speedRelease Note
● Version Update Summary:-• New Analytical Engines
- Added a full statistical regression upgrade, giving the regression channel the option to run on log-price data, apply outlier-resistant (robust) fitting, and weight the fit by volume for more reliable trend channels.
- Introduced a recursive statistical model that continuously updates its trend estimate bar-by-bar, improving responsiveness without sacrificing stability.
- Added a statistical significance filter for trend slope, so weak or noisy trends can be distinguished from statistically meaningful ones.
- Introduced multi-scale trend agreement tracking, comparing short-, medium-, and long-term trend direction to gauge overall market alignment.
- Added an optional detrended RSI mode for more accurate divergence detection in trending conditions.
• New Reversal Detection System
- Added a complete composite reversal signal engine that combines momentum extremes, structural conditions, and confirmation filters into a single high-confidence reversal signal.
- Added a higher-timeframe confirmation filter, allowing signals to be cross-checked against a user-selected higher timeframe before being considered valid.
- Added a market regime filter, which can require minimum trend quality, trend duration, and momentum extremity before allowing a signal.
- Added an optional failure-swing confirmation requirement to reduce premature signals.
- Added a signal cooldown control to prevent repeated signals from firing too close together.
- Introduced an early "lead" signal that can flag potential momentum shifts before the main reversal confirms.
- Added a distribution/width-ratio warning that flags unusual divergence between price and momentum channel behavior.
• New Support & Resistance Prediction
- Added a new module that projects potential support and resistance levels based on prior structural zones, incorporating volume strength, zone freshness (time decay), and proximity clustering to merge overlapping levels intelligently.
• Enhanced Order Block Logic
- Order block detection was upgraded with a scoring and ranking system, factoring in volume, freshness, and structural significance, so only the most relevant zones are displayed.
- Added a configurable maximum lookback limit for RSI order blocks, matching the control already available for price order blocks.
• New Dashboard
- Added an entirely new on-chart statistics dashboard with configurable position, presenting a consolidated, visual summary of trend direction, statistical confidence, momentum alignment, structural duration, and signal strength using intuitive bar indicators and color coding.
• Expanded Alert System
- Added several new alert types covering the new reversal engine, the early lead signal, and the distribution warning.
- Added customizable trade-action labels for alerts (e.g., long/short tagging), allowing alerts to be adapted for automated or semi-automated workflows.
• Refinements & Quality-of-Life Improvements
- Reorganized all input settings into clearer, icon-labeled groups for easier navigation.
- Adjusted default sensitivity thresholds for improved out-of-the-box signal quality.
- Refined internal stability and consistency safeguards to ensure smoother rendering and more reliable long-term performance across different symbols and timeframes.
- General visual polish and label/table refinements for improved readability.
Release Note
Code error fixed Release Note
● New Elements • On-Chart Signal Markers
- REV (orange label, up/down) — Reversal signal: the indicator's proprietary reversal-detection engine has flagged a potential turning point in price
- ▲ / ▼ tiny purple triangle (Lead Signal) — Early/"lead" warning that a reversal condition may be forming, ahead of the full REV confirmation
- ◆ SUP [price] [confidence %] (green dashed line) — Predicted support level projected forward from current price, with a confidence score
- ◆ RES [price] [confidence %] (red dashed line) — Predicted resistance level projected forward from current price, with a confidence score
• New Dashboard Rows (in the existing "Regression Compass" table)
- Multi-Scale — Shows trend agreement/alignment across three different lookback speeds (fast/mid/slow), indicating whether short and longer-term structure agree
- Δz (Delta-Z) — A statistical "shock" reading; measures how unusually large the most recent change is relative to normal volatility, used to time reversals
- HTF Bias — Shows the higher-timeframe trend direction, used to confirm whether a signal aligns with the bigger picture
- Confluence — A combined score showing how many independent conditions (statistical, structural, momentum) agree at once
- Signals — Summary cell showing which signal(s) are currently active
- Pred. S/R — Displays the nearest predicted support/resistance level and distance to it
- ⚡ [Reversal] [arrow] — Highlighted alert row that lights up specifically when a Reversal signal fires, with directional arrow
• New Settings Groups (visible in the Inputs panel)
- 📐 Stat Engine — Advanced statistical regression settings (fit type, significance filtering, multi-timescale trend comparison)
- 🌊 Reversal Engine — Controls for the new reversal-detection system (sensitivity, cooldown, confirmation filters, HTF confirmation)
- 🧱 Support Prediction — Toggles and tuning for the predicted Support/Resistance projection feature
- 📊 Dashboard — Table position and row visibility controls
• New Color Inputs
- Predicted Support Line, Predicted Resistance Line, Reversal Gauge/Signal, Lead Signal color
- Added an option to adjust the fill transparency of the regression channels (both RSI and Price).
Release Note
NEW FEATURES1. Scale-Aware Price Regression Channel
- The price regression channel can now be fitted to match the scale you are actually viewing the chart on.
- A new "Straight Channel" control lets you choose between a channel that renders perfectly straight on a linear-scale chart, or one aligned to a logarithmic-scale chart instead.
- When aligned to log scale, the channel is drawn as a true continuous curve rather than forced into straight segments, so the midline and both bands follow the correct path across the full span of the channel.
- This removes the distortion that previously appeared on instruments with large percentage ranges.
How to Use
- A straight channel and a curved channel carry the same meaning — midline is fair value, the outer bands mark the stretched edges of the move.
- A smooth curve tells you the trend is proportional rather than linear: each step is a similar percentage move, not a similar point move.
- A curve bending upward and away shows an accelerating percentage trend; a curve flattening shows the rate of change cooling even while price still rises.
2. Adjustable Overbought and Oversold Levels
- Both reference levels are now fully user-adjustable instead of being locked to fixed values.
- Lets you widen them on strongly trending assets where conventional levels are reached too often to be meaningful, or tighten them on slower ranging instruments for earlier warning.
3. Channel Length Boundaries
- Both the RSI structural channel and the price regression channel now respect an adjustable minimum and maximum length.
- The minimum prevents an unstable, noise-tilted micro-channel forming immediately after a structural break, when too little data exists to define a reliable trend.
- The maximum prevents the channel and its bands expanding without limit during very long trends, keeping them responsive to current conditions.
4. Quality-Ranked Order Block Zone Selection
- Displayed price order block zones are now chosen by overall zone quality rather than by age alone.
- Selection weighs how recently the zone formed, whether it has already been tested or partially consumed, how close it sits to current price, the participation behind it, and whether it formed with genuine displacement.
- The zone shown is now the one most likely to matter right now, instead of simply the most recent one.
- Confidence readings on the projected support and resistance levels are taken directly from the zone actually being displayed, so the number and the zone always agree.
5. Signal Integrity Guards
- The regime filter and the divergence measurement engine now require valid underlying statistics before passing or blocking a signal, instead of treating missing values as neutral.
- The dashboard reversal score now displays a clear unavailable state, with neutral colouring and a neutral direction marker, whenever the statistics behind it are not yet ready.
- Net effect: fewer signals during warm-up or on thin history, and no confident-looking scores built on data that does not exist yet.
How to Use
- When the reversal score row shows an unavailable state, read it as "no reading" rather than "no reversal" — the engine does not yet have enough established channel history to judge.
- Its neutral background and neutral direction marker mean the row should be ignored for now, not read as a weak bullish or bearish tilt.
- The row populates on its own once the channels mature; wait for a live score before using it as confluence.
6. Validated Risk Levels in Alerts
- Every alert carrying entry, stop, and target information now validates the stop before sending.
- If a structural stop reference is unavailable, or would sit on the wrong side of the entry, a volatility-based fallback distance is applied automatically.
- Outgoing payloads always contain a stop positioned correctly relative to entry and a target derived consistently from it — relevant for automated and webhook-driven workflows.
MINOR IMPROVEMENTS
Per-Zone Projection Anchoring
- Support and resistance levels projected from RSI order blocks now use each zone's own reference conditions captured at the moment it formed, instead of a single shared current reference.
- Projections are more faithful to where the originating zone actually sat, and remain available in situations where they were previously suppressed.
Cleaner Structural Break Handling
- Once a structural level is broken and the trend state flips, that level is now retired rather than left active, preventing the same broken level from re-triggering structure changes on later bars.
More Comparable Channel Statistics
- With participation weighting enabled, weights are now measured against a rolling reference that moves with the data, and the overall weighting is normalised.
- Quality and deviation readings are now directly comparable whether weighting is on or off, and across instruments with very different activity profiles.
REFINEMENTS AND ADJUSTMENTS
- The dashboard multi-scale row has been relabelled to state explicitly that it measures divergence across scales.
- The projected endpoint of both channels now aligns exactly with the confirmed bar, correcting a small one-bar offset in the drawn midline and bands.
- Candles on the price chart are no longer tinted on bars where no RSI reading exists, eliminating stray colouring at the start of history.
- Chart drawing for channels, zones, projected levels, and the relative-mode badge is consolidated to the current bar, sharply reducing redraw load on long histories.
- Structural pivot scanning now exits as soon as a result is determined, and weighting data is prepared once and reused instead of rebuilt for every channel evaluation.
- Benchmark, detrended, and relative-mode calculations run only when the features depending on them are active.
- The internal fit behind slope and acceleration readings is periodically re-referenced to maintain accuracy over very long histories, and stored zone histories are capped to keep memory bounded on deep intraday charts.
Release Note
A precision and reliability release. Signals fire once and only when the underlying structure supports them, automation messages are always valid, and the indicator now protects you from chart settings that would make its levels untrustworthy.Major Enhancements
- One signal per event. Band breakouts and RSI lead signals fire at the moment the condition is first met instead of repeating every bar. No more duplicate entries for a single move.
- Conflict suppression. Bullish and bearish conditions resolving on the same bar now cancel each other, so you never receive contradictory instructions from one event.
- Synthetic-price chart protection. The indicator stops with a clear message on Heikin Ashi, Renko, Kagi, Point and Figure, Line Break and Range charts, where prices that never traded would invalidate every level and target.
- Higher-timeframe safeguard. A confirmation timeframe set below the chart's own is automatically raised to the chart timeframe, and the dashboard reports the adjustment.
- Relative RSI accuracy. Benchmark comparison is taken from the matching bar, removing the benchmark's own move from the relative-strength reading. Invalid benchmark symbols are handled cleanly.
- Reliable automation payloads. Custom action text is safely encoded and undefined values transmitted correctly, so every outgoing message is accepted by your webhook receiver.
- Alert list respects your toggles. Disabling an alert type in the settings panel now genuinely disables it everywhere.
Signal Quality
- Reversal engine recalibrated. The core divergence measure now waits for genuinely valid history, so it no longer triggers earlier than its sensitivity setting implies.
- Directional confluence. The reversal score's support and resistance component is matched to the direction being scored: bullish readings confirmed by support, bearish by resistance.
- True structure maturity. The maturity requirement measures how long the current structure has actually held since its anchoring shift, so fresh structures are correctly treated as immature.
- Full coverage in ranges. Consolidation structures now publish complete band and midline data, keeping retest and lead signals available while a market is sideways.
- Stricter confirmation. Structural pivots are never declared on incomplete data, and channel geometry is rebuilt each bar so signals are never judged against stale band levels.
- Cleaner divergence. Minimum pivot separation is enforced consistently, and the detrended series used for divergence is now correctly aligned.
Refinements
- Honest dashboard values. Metrics without enough history display as unavailable instead of showing numbers derived from incomplete data.
- Faster load, lighter footprint. Internal buffers are maintained incrementally and drawing budgets tightened; divergence lines retire on a predictable schedule.
- Work tied to visibility. Drawing work is skipped when the matching display option is off, with no effect on signals.
- Safer settings. All length and lookback inputs carry sensible upper limits, and inverted minimum/maximum pairs are resolved automatically.
How to Use
- Higher-timeframe status cell. Alongside aligned and divergent, this row now has a clamped state showing a timeframe. It means your confirmation timeframe was below the chart's and has been raised to it — treat confirmation as measured on the chart timeframe, and raise the setting for genuine higher-timeframe confirmation.
- Unavailable metric cells. A cell reading as unavailable means the measurement lacks confirmed history, not that the market is neutral. Wait for it to populate before weighting it.
Release Note
Smart RSI Concepts Pro [MarkitTick] — Version UpdateNew Features
- Complete Risk Levels on Every Alert — Breakout and lead-signal alerts now include entry, stop and target, so every alert type is automation-ready.
- Lead Signals Anchored to Projected Levels — Lead-signal risk levels now reference the indicator's projected support and resistance.
- Reversal Label Toggle — Show or hide the composite reversal label independently, without affecting its alerts.
Improvements
- Structure Shifts Reset Channel Bias — No stale directional readings carried across a confirmed structure break.
- Zone Projections Follow Live Scaling — Projected zones stay aligned to price on any symbol or zoom level.
- Divergence Waits for a Full Sample — Early-chart and post-reload readings are no longer inflated.
- Continuous Breakout Tracking — Retest sequences survive a channel rebuild instead of being cancelled.
- Reliable Zones on Low-Volume Symbols — Neutral fallback weighting when volume data is missing.
- Readable Timeframe on Dashboard — Clean timeframe label replaces the raw platform code.
- Hardened Alert Formatting — Payloads parse cleanly in bots and webhook receivers.
- Tighter Pivot Confirmation — Cleaner structure points, fewer marginal swing detections.
Performance
- Faster chart load and lighter runtime on long history.
- Streamlined zone selection with no change to displayed output.
- Extended historical reach for deep-history charts.
Compatibility
- All settings, colours and alerts are preserved — no re-setup required.
- Existing webhooks keep working; payloads simply gain extra fields.
Release Note
Smart RSI Concepts Pro — Update SummaryMajor Improvements
- Signals aligned to the bar they describe — Channel breakouts, retests, failure swings, lead band breaks, structure shifts and slope readings now evaluate on the bar itself instead of trailing it, so markers, dashboard values and alerts line up with the candle that triggered them.
- More accurate pivot detection — Pivot confirmation now checks every neighbouring bar, removing false pivots that could seed order blocks, channel anchors and divergences.
- Corrected channel alignment — RSI and price regression channels now start and end on the correct bars and respect your minimum channel length, so midlines, bands and Z-scores match what is drawn.
- Fairer Strength score during warm-up — Components that are not yet available are left out of the score instead of counting as zero, so early readings are no longer dragged down.
- Smarter volume handling — Volume weighting and order block ranking now ignore bars with no volume instead of treating them as low volume, and symbols without volume data are fitted neutrally.
New Features
- Redesigned dashboard — A compact layout with the symbol and timeframe in the header, separate Price and RSI rows, progress bars for channel duration, and a hover tooltip on every row explaining what it shows.
- Reversal engine status rows — New Regime Gate, Failure Swing, Cooldown and Armed rows show which reversal conditions are met and how long an armed setup remains valid.
- Split support and resistance readout — Predicted Support and Predicted Resistance now have their own rows, each with its contributing sources tagged and a dedicated confidence bar.
- Div Zone row — Shows where RSI stands against the divergence overbought and oversold zones when zone filtering is on.
- RSI channel retest alerts — RSI midline retests are now their own signal with dedicated bullish and bearish alerts, separate from price channel retests.
- Directional alert conditions — Every alert is now split into bullish and bearish (or upper and lower) conditions, so you can subscribe to one side only.
- New alert switches — RSI Divergence and Distribution Warning alerts can now be turned on or off individually, and the distribution warning fires once when it starts instead of on every bar.
- Show Dashboard toggle — Hide or show the dashboard independently of the channels.
- Settings tooltips — Nearly every setting now carries a tooltip describing what it controls.
Refinements
- Alert message format — Webhook messages now carry a fixed event name in the action field, the symbol and entry fields were renamed, and stop and target levels were removed. Review any webhook parser before relying on these alerts.
- Divergence markers — D markers now sit directly on the pivot bar and are kept together with their divergence lines, and the Signals row now also flags RSI divergence.
- Lead signal markers — Lead band breaks are now shown as labelled LEAD markers instead of small triangles.
- Order block boxes — RSI and price order blocks now end just beyond the current bar instead of stretching to the chart edge.
- Relative mode — RSI candle wicks now follow the relative range, and the badge warns when the benchmark returns no data.
- HTF Bias — Shows the timeframe in use and highlights when a timeframe below the chart was skipped.
- Warm-up display — Values that are not ready show a dash consistently, and the RSI candle waits for valid data instead of estimating its open.
- Δz colouring — Bullish and bearish Δz extremes now use distinct colours.
- Label readability — Text colour on retest and reversal labels updated for clearer contrast.
- Input limits — Upper limits added to several numeric settings to prevent out-of-range entries.
- Log-Price Regression — Non-positive prices are now left out rather than forced to a minimum value.
- Settings layout — Display-related settings are consolidated under Visuals, and the middle positions were removed from Dashboard Position.
How to Use
- Regime Gate — Pass means current structure qualifies for reversal signals; Blocked means it does not.
- Failure Swing — The direction whose recent return inside the price channel is still valid for a reversal.
- Cooldown — Ready, or the number of bars left before a new reversal can arm.
- Armed — The direction set up and waiting for confirmation, with the bars left in its window.
- Div Zone — Overbought, Oversold or Outside for the current bar.
- Pred. Support and Pred. Resistance tags — OB marks a price order block, RSI a projected RSI order block, CH the price channel band; more tags means more sources agree.
- Support Conf. and Resistance Conf. — A fuller, greener bar indicates a stronger predicted level.
- Duration bars — How mature the current channel is relative to its maximum length.
- Volume Weighting row — Appears only when the symbol reports no volume, confirming the channels are fitted without it.
- LEAD label — RSI has left its channel while price is still inside its own.
- Benchmark warning — A highlighted badge line in relative mode means the benchmark delivered no data.
Settings Reset Notice
Your saved settings for this indicator will return to their defaults after updating; please re-enter any custom values.
- Every setting is affected, because settings were added, removed and reordered throughout the panel.
- Moved to Visuals — Show RSI Line, Overbought Level, Oversold Level, Fill Transparency, Price Fill Transparency, RSI OB Max Lookback, Price OB Max Lookback.
- Group headers updated — All settings under Relative RSI, RSI Regression, Price Regression and Stat Engine.
- Renamed — Show Lead Signal Label, Support Label Text.
- New defaults — Table Header Bg, Table Cell Bg, Table Border, Table Frame.
- Changed options — Dashboard Position.
- New — Show Dashboard, Alert: RSI Divergence, Alert: Distribution Warning, Dash Warning.
- Removed — The per-signal Action fields in Alerts, and the Table Label Bg, Table Dim Text, Strength Bg and Badge Bg colors.
Release Note
Smart RSI Concepts Pro — Update SummaryMajor Improvements
- Confirmed, Non-Repainting Signals — Pivots, RSI divergences, structure breaks and the SD, RT, REV and LEAD markers now form only on a closed bar. A signal you see on the chart stays where it was printed, and the dashboard Signals row now reports the last closed bar.
- Rebuilt Higher-Timeframe Confirmation — The HTF filter for reversals now reads the same price and RSI direction shown in the dashboard Direction rows, measured on the higher timeframe and taken from its last closed bar. Setting the HTF timeframe equal to the chart timeframe is now valid, so the filter stays consistent with what the dashboard tells you.
- Clear Notice on Unsupported Chart Types — On Heikin Ashi, Renko, Kagi, Point & Figure, Range or Line Break charts the indicator no longer stops with an error. It shows a clear on-chart notice explaining that these charts use synthetic prices and asking you to switch to Candles.
New Features
- Dashboard on the Price Chart — A new option draws the dashboard directly on the price chart, or keeps it in the indicator pane. The chosen position applies on either one.
- Warnings Stay Visible With the Dashboard Off — When the dashboard is hidden, any active warning still appears on its own in the same corner, so an important condition is never missed.
- Swapped Inputs Protection — If a minimum length is set above its matching maximum, the indicator now uses the pair in the correct order and flags it on the dashboard instead of producing distorted channels.
- Fade Channel by Slope Toggles — Separate switches for the RSI and price channels let you keep the active channel fading as its trend weakens, or draw it at a fixed look.
- Full Control of Channel Fills — New colour settings for the historical channel fills (up, down and sideways) and for the active sideways channel fill, on both the RSI and price channels.
Refinements
- Colours Drawn as You Set Them — Channel lines, RSI candles and order blocks now respect the exact colour and transparency you choose; order blocks fade from your chosen shade as price touches and enters them.
- Extended Reference Levels — The Overbought, Oversold and Midline levels are now dashed lines that extend to the right edge of the pane.
- Channel Alerts Work With Channels Hidden — The New Channel alert and the Distribution Warning now keep working even when the channels themselves are not drawn.
- Consistent Slope Readings in Alerts — Slope divergence alerts now send the same slope readings shown on the dashboard.
- More Robust Webhook Messages — Alert messages stay valid for symbols and timeframes that contain special characters.
- Cleaner Dashboard Values — Duration rows show a plain bar count, the multi-scale row reads as a count out of three, the reversal strength shows a plain score, and decimal values display consistently.
- Support / Resistance Naming — The support and resistance setting and colour labels are simplified.
Performance
- Historical channels are now drawn once on the latest bar, reducing redraw work on long histories.
- Signal markers are managed so older ones are cleared automatically, keeping the chart responsive.
How to Use
- Swapped Inputs row — Appears highlighted as a warning and names which pair (RSI, Price or Div) was entered with its minimum above its maximum. Correct those settings to clear it.
- Chart type notice — A centred red message on the price chart means the current chart type is not supported; switch to standard Candles to restore the indicator.
Settings Reset Notice
Saved settings for this indicator will return to their defaults after this update, so please re-enter your preferred values once updated.

💡 Proprietary indicators. Original research. Built by analysts who trade.
📢 Free Telegram: t.me/MarkitTick_Updates
👑 Premium: TradingView Marketplace
📘 Guides: markittick.com
📢 Free Telegram: t.me/MarkitTick_Updates
👑 Premium: TradingView Marketplace
📘 Guides: markittick.com
คำจำกัดสิทธิ์ความรับผิดชอบ
ข้อมูลและบทความไม่ได้มีวัตถุประสงค์เพื่อก่อให้เกิดกิจกรรมทางการเงิน, การลงทุน, การซื้อขาย, ข้อเสนอแนะ หรือคำแนะนำประเภทอื่น ๆ ที่ให้หรือรับรองโดย TradingView อ่านเพิ่มเติมใน ข้อกำหนดการใช้งาน
💡 Proprietary indicators. Original research. Built by analysts who trade.
📢 Free Telegram: t.me/MarkitTick_Updates
👑 Premium: TradingView Marketplace
📘 Guides: markittick.com
📢 Free Telegram: t.me/MarkitTick_Updates
👑 Premium: TradingView Marketplace
📘 Guides: markittick.com
คำจำกัดสิทธิ์ความรับผิดชอบ
ข้อมูลและบทความไม่ได้มีวัตถุประสงค์เพื่อก่อให้เกิดกิจกรรมทางการเงิน, การลงทุน, การซื้อขาย, ข้อเสนอแนะ หรือคำแนะนำประเภทอื่น ๆ ที่ให้หรือรับรองโดย TradingView อ่านเพิ่มเติมใน ข้อกำหนดการใช้งาน