Linear Regression Channel Visible Range Volume Profile
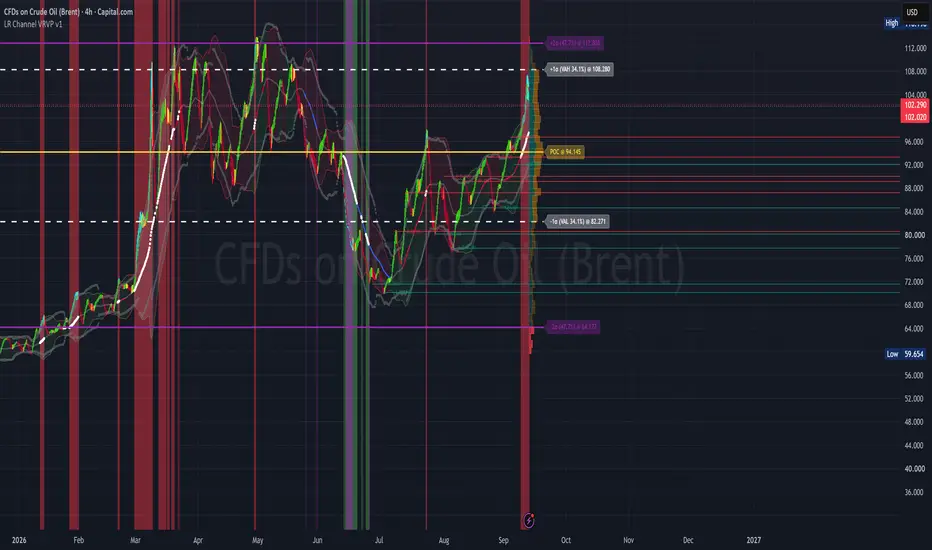
LR Channel VRVP — Linear Regression Channel + Visible Range Volume Profile
A multi-factor overlay that blends Linear-Regression-smoothed candles with a true Visible-Range Volume Profile, a statistical mean channel, Bollinger Band %, adaptive percentile bands, and auto-merging pivot Support/Resistance. Designed for traders who want a single clean visual that answers four questions at once: (1) Where is price relative to its statistical envelope? (2) Where has volume actually traded? (3) Where has the market accepted or rejected value? (4) Where are the extremes that are outside the standard deviation?
⚠️ Important note on the Volume Profile zone labels
The 68.2% and 95.45% Volume Profile zones are volume-coverage thresholds inspired by the 1σ/2σ probabilities of a normal distribution; they are not calculated standard deviations of the volume distribution. They are just shown as an analog representation of standard deviation.
The Volume Profile is not assumed to be normally distributed. The "±1σ" and "±2σ" labels are used as convenient shorthand because the 68.2% and 95.45% coverage percentages correspond to the familiar 1σ and 2σ bands of a Gaussian or Bell Curve. The actual values are computed by expanding outward from the POC until the specified percentage of traded volume is captured — a purely empirical calculation that makes no distributional assumption.
🔹 What's on the chart
Linear Regression Candles
The candles you see are not raw OHLC. Each of the four price points (open, high, low, close) is independently smoothed by a rolling linear regression over N bars (default 20). This removes intrabar noise while preserving the underlying trend slope, and produces candles whose shape reflects the smoothed market rather than the last tick.
Doji detection runs on the smoothed values: a candle is a doji when its body is ≤ 8% of its range and both upper and lower wicks are larger than the body. Dojis frequently appear at regression inflection points. On the chart, they are represented as yellow candles.
Static Mean Channel
A simple SMA(length) ± 2 × stdev(length) envelope (default 50). This is your statistical "normal" range. Price inside the channel = rotation. Price outside = extension. The channel fill is colored by regime (see below).
Visible-Range Volume Profile (right edge)
On every realtime tick the script rebuilds a volume profile across the currently visible bars. Each bar's volume is split into an up-volume / down-volume proxy based on whether the bar closed above or below its open, then distributed into price bins proportionally to the overlap between the bar's range and each bin. This is a proxy, not a true bid/ask tape read — it uses candle direction as a stand-in for aggressive buying vs. selling.
Three nested volume-coverage zones are drawn:
POC — Point of Control, the single bin with the highest traded volume. Solid yellow line extending left. The POC is a highest-volume price / acceptance reference, not a "fair value" in any valuation sense.
68.2% Value Area (VAH / VAL 34.1%) — dashed white lines. The volume-weighted band that captures 68.2% of traded volume around the POC. Comparable to a ±1σ analogy.
95.45% Extended Value Area (±47.7%) — solid purple lines. The band that captures 95.45% of traded volume around the POC. Comparable to a ±2σ analogy. I personally like to enter my trades at or outside of this area.
Bars outside the 95.45% zone are painted red to mark thinly traded / low-acceptance areas — price levels where the market spent little time and may be more prone to fast traversal. This is a low-acceptance highlight, not a proof of rejection.
Percentile Nearest Rank Bands
Symmetric grey dotted lines at mean ± PNR(|close − mean|, N). Unlike stdev bands, PNR uses the actual empirical distribution of price deviations, so it does not assume normality. On trending instruments this gives a much more honest "extreme" reading of price moves.
Support / Resistance (pivot-based, auto-merging)
Swing highs and lows are detected with a configurable lookback. When a new pivot lands within 0.5 × ATR of an existing level, the two are averaged into a single line instead of drawing a redundant one. Oldest levels are trimmed past the configured cap so the chart stays readable.
🔹 Candle colors — what each one means
🟢 Green (default bull) - Smoothed close > smoothed open, and LinReg close is inside the mean channel. Indicates a normal bullish bar in a neutral/slightly-bullish regime.
🔴 Red (default bear) - Smoothed close ≤ smoothed open and LinReg close is inside the mean channel. Indicates a normal bearish bar in a neutral/slightly-bearish regime.
🔵 Blue - LinReg close > upper band (bull bar) or LinReg close < lower band (bear bar). Indicates price has extended beyond the mean channel — early warning of a stretched move.
🟡 Yellow - Doji (body ≤ 8% of range with wicks on both sides) indecision. Often marks regression inflection points. Overrides all other colors.
🟦 Cyan (customizable) - Bollinger %B > 1, RSI overbought and price is outside both outer bands of the channels — or the mirror condition on the downside. These fully align three extreme conditions: oscillator stretched, price outside mean channel, price outside empirical PNR band. This is the strongest "everything is stretched" state. Dojis still override it.
Color priority (highest wins):
Doji → yellow
Extreme override enabled & condition met → cyan
LinReg close outside mean channel → blue
Otherwise → green / red
🔹 Background colors — what each one means:
🟩 Green vertical band ("Buy Zone BG") = Bollinger %B < 0 AND RSI < oversold threshold (30/40 depending on channel length). Price is trading below the lower Bollinger band and RSI confirms oversold. A classic mean-reversion / accumulation context.
🟥 Red vertical band ("Sell Zone BG") = Bollinger %B > 1 and RSI > overbought threshold (60/70 depending on channel length). Price is trading above the upper Bollinger band and RSI confirms overbought. Classic distribution / exhaustion context.
🟪 Purple vertical band ("Prime Accumulation Zone") where the BB% and RSI are both oversold threshold = Rare triple-confirmation zone: trend momentum is elevated in both directions, %B is depressed, and RSI is oversold. Marks high-conviction accumulation setups.
🟥 Dark red vertical band ("Prime Distribution Zone") = Percentile, Bollinger %B and RSI overbought threshold (Mirror of the above). High-conviction distribution / exhaustion setups.
The red and green backgrounds are frequent — they mark every overbought/oversold reading. The purple and dark-red backgrounds are rare and should be treated as elevated-conviction signals.
🔹 Channel fill color
The area between the upper and lower mean-channel bands is filled, and the fill changes color to reflect the current regime:
Channel Fill color
🟢 Green (translucent) = Price above mean and %B above its own average. Bullish regime — buyers in control.
🔴 Red (translucent) = Price below mean or %B below its own average. Bearish / neutral regime — sellers in control.
⚪ White (translucent) = Bollinger %B > 1 or %B < 0. Extreme regime — oscillator has broken out of its own band.
🔹 Volume Profile colors
Up-volume bars (inside VA) - Teal = Volume from bars closing above open — up-volume proxy
Down-volume bars (inside VA) - Orange = Volume from bars closing below open — down-volume proxy.
Bars outside 95.45% zone - Red = Thinly traded / low-acceptance area — possible rejection zone.
POC line - Yellow = Point of Control — highest-volume price / acceptance reference.
±1σ analogy (68.2% VA) - White dashed = 68.2% volume-coverage boundary.
±2σ analogy (95.45% EVA) - Purple solid = 95.45% volume-coverage boundary.
PNR bands - Grey dotted = Empirical percentile envelope around the mean.
🔹 How to read it
Start with the profile. POC = highest-volume price / acceptance reference. The 68.2% zone = normal rotation area. The 95.45% zone = the wider coverage band. Red bars = low-acceptance areas where price moved quickly and may do so again.
Check the fill. Green fill = bullish regime; red = bearish; white = stretched oscillator.
Look for candle confluence. A cyan candle appearing at or beyond the 95.45% VP boundary, near a pivot S/R level, and inside a purple background is the highest-probability reversal context this script identifies.
Use the backgrounds as context, not triggers. Green/red bands fire frequently and are noisy alone. Purple/dark-red bands are rare and pair well with a cyan candle and a structural level.
Trend direction comes from the slope of the smoothed candles and their position relative to the mean channel — not from any single bar.
🔹 Inputs reference and controls
Linear Regression Candles - LinReg period, doji sensitivity
Static Mean Channel - SMA length (also drives RSI and PNR length)
Percentile Nearest Rank - Sensitivity threshold (default 85)
Volume Profile - Rows, width, VA %, history depth, up/down colors, outside-95.45% color, label toggle, line-extension toggle.
Support & Resistance - Pivot lookback, max levels per side, ATR merge tolerance, line width, color, label toggle.
Extreme Oscillator - Candle Color, Enable toggle, custom color.
🔹 Notes & caveats
The Volume Profile reflects the currently visible chart range. Scroll or zoom and it redraws.
The profile recomputes on every realtime tick. Initial load on long-history charts may take a moment.
The 68.2% and 95.45% zones are volume-coverage thresholds, not calculated standard deviations of the volume distribution. The ±1σ / ±2σ labels are an analogy only.
Up-volume / down-volume is a candle-direction proxy, not a true bid/ask tape classification.
"Rejected" / "low-acceptance" areas are potential rejection zones, not confirmed ones — the profile shows where volume was thin, and thin areas are prone to fast traversal, not guaranteed to reverse.
Alerts are provided for the extreme-oscillator conditions (upper and lower).
This indicator is a contextual / analytical tool. It does not generate buy/sell signals.
Pair with a separate momentum oscillator pane if you want confirmation timing.
🔹 Credits
Built with Pine Script v6 using built-in ta.* functions. Logic is original. Feedback welcome.
A multi-factor overlay that blends Linear-Regression-smoothed candles with a true Visible-Range Volume Profile, a statistical mean channel, Bollinger Band %, adaptive percentile bands, and auto-merging pivot Support/Resistance. Designed for traders who want a single clean visual that answers four questions at once: (1) Where is price relative to its statistical envelope? (2) Where has volume actually traded? (3) Where has the market accepted or rejected value? (4) Where are the extremes that are outside the standard deviation?
⚠️ Important note on the Volume Profile zone labels
The 68.2% and 95.45% Volume Profile zones are volume-coverage thresholds inspired by the 1σ/2σ probabilities of a normal distribution; they are not calculated standard deviations of the volume distribution. They are just shown as an analog representation of standard deviation.
The Volume Profile is not assumed to be normally distributed. The "±1σ" and "±2σ" labels are used as convenient shorthand because the 68.2% and 95.45% coverage percentages correspond to the familiar 1σ and 2σ bands of a Gaussian or Bell Curve. The actual values are computed by expanding outward from the POC until the specified percentage of traded volume is captured — a purely empirical calculation that makes no distributional assumption.
🔹 What's on the chart
Linear Regression Candles
The candles you see are not raw OHLC. Each of the four price points (open, high, low, close) is independently smoothed by a rolling linear regression over N bars (default 20). This removes intrabar noise while preserving the underlying trend slope, and produces candles whose shape reflects the smoothed market rather than the last tick.
Doji detection runs on the smoothed values: a candle is a doji when its body is ≤ 8% of its range and both upper and lower wicks are larger than the body. Dojis frequently appear at regression inflection points. On the chart, they are represented as yellow candles.
Static Mean Channel
A simple SMA(length) ± 2 × stdev(length) envelope (default 50). This is your statistical "normal" range. Price inside the channel = rotation. Price outside = extension. The channel fill is colored by regime (see below).
Visible-Range Volume Profile (right edge)
On every realtime tick the script rebuilds a volume profile across the currently visible bars. Each bar's volume is split into an up-volume / down-volume proxy based on whether the bar closed above or below its open, then distributed into price bins proportionally to the overlap between the bar's range and each bin. This is a proxy, not a true bid/ask tape read — it uses candle direction as a stand-in for aggressive buying vs. selling.
Three nested volume-coverage zones are drawn:
POC — Point of Control, the single bin with the highest traded volume. Solid yellow line extending left. The POC is a highest-volume price / acceptance reference, not a "fair value" in any valuation sense.
68.2% Value Area (VAH / VAL 34.1%) — dashed white lines. The volume-weighted band that captures 68.2% of traded volume around the POC. Comparable to a ±1σ analogy.
95.45% Extended Value Area (±47.7%) — solid purple lines. The band that captures 95.45% of traded volume around the POC. Comparable to a ±2σ analogy. I personally like to enter my trades at or outside of this area.
Bars outside the 95.45% zone are painted red to mark thinly traded / low-acceptance areas — price levels where the market spent little time and may be more prone to fast traversal. This is a low-acceptance highlight, not a proof of rejection.
Percentile Nearest Rank Bands
Symmetric grey dotted lines at mean ± PNR(|close − mean|, N). Unlike stdev bands, PNR uses the actual empirical distribution of price deviations, so it does not assume normality. On trending instruments this gives a much more honest "extreme" reading of price moves.
Support / Resistance (pivot-based, auto-merging)
Swing highs and lows are detected with a configurable lookback. When a new pivot lands within 0.5 × ATR of an existing level, the two are averaged into a single line instead of drawing a redundant one. Oldest levels are trimmed past the configured cap so the chart stays readable.
🔹 Candle colors — what each one means
🟢 Green (default bull) - Smoothed close > smoothed open, and LinReg close is inside the mean channel. Indicates a normal bullish bar in a neutral/slightly-bullish regime.
🔴 Red (default bear) - Smoothed close ≤ smoothed open and LinReg close is inside the mean channel. Indicates a normal bearish bar in a neutral/slightly-bearish regime.
🔵 Blue - LinReg close > upper band (bull bar) or LinReg close < lower band (bear bar). Indicates price has extended beyond the mean channel — early warning of a stretched move.
🟡 Yellow - Doji (body ≤ 8% of range with wicks on both sides) indecision. Often marks regression inflection points. Overrides all other colors.
🟦 Cyan (customizable) - Bollinger %B > 1, RSI overbought and price is outside both outer bands of the channels — or the mirror condition on the downside. These fully align three extreme conditions: oscillator stretched, price outside mean channel, price outside empirical PNR band. This is the strongest "everything is stretched" state. Dojis still override it.
Color priority (highest wins):
Doji → yellow
Extreme override enabled & condition met → cyan
LinReg close outside mean channel → blue
Otherwise → green / red
🔹 Background colors — what each one means:
🟩 Green vertical band ("Buy Zone BG") = Bollinger %B < 0 AND RSI < oversold threshold (30/40 depending on channel length). Price is trading below the lower Bollinger band and RSI confirms oversold. A classic mean-reversion / accumulation context.
🟥 Red vertical band ("Sell Zone BG") = Bollinger %B > 1 and RSI > overbought threshold (60/70 depending on channel length). Price is trading above the upper Bollinger band and RSI confirms overbought. Classic distribution / exhaustion context.
🟪 Purple vertical band ("Prime Accumulation Zone") where the BB% and RSI are both oversold threshold = Rare triple-confirmation zone: trend momentum is elevated in both directions, %B is depressed, and RSI is oversold. Marks high-conviction accumulation setups.
🟥 Dark red vertical band ("Prime Distribution Zone") = Percentile, Bollinger %B and RSI overbought threshold (Mirror of the above). High-conviction distribution / exhaustion setups.
The red and green backgrounds are frequent — they mark every overbought/oversold reading. The purple and dark-red backgrounds are rare and should be treated as elevated-conviction signals.
🔹 Channel fill color
The area between the upper and lower mean-channel bands is filled, and the fill changes color to reflect the current regime:
Channel Fill color
🟢 Green (translucent) = Price above mean and %B above its own average. Bullish regime — buyers in control.
🔴 Red (translucent) = Price below mean or %B below its own average. Bearish / neutral regime — sellers in control.
⚪ White (translucent) = Bollinger %B > 1 or %B < 0. Extreme regime — oscillator has broken out of its own band.
🔹 Volume Profile colors
Up-volume bars (inside VA) - Teal = Volume from bars closing above open — up-volume proxy
Down-volume bars (inside VA) - Orange = Volume from bars closing below open — down-volume proxy.
Bars outside 95.45% zone - Red = Thinly traded / low-acceptance area — possible rejection zone.
POC line - Yellow = Point of Control — highest-volume price / acceptance reference.
±1σ analogy (68.2% VA) - White dashed = 68.2% volume-coverage boundary.
±2σ analogy (95.45% EVA) - Purple solid = 95.45% volume-coverage boundary.
PNR bands - Grey dotted = Empirical percentile envelope around the mean.
🔹 How to read it
Start with the profile. POC = highest-volume price / acceptance reference. The 68.2% zone = normal rotation area. The 95.45% zone = the wider coverage band. Red bars = low-acceptance areas where price moved quickly and may do so again.
Check the fill. Green fill = bullish regime; red = bearish; white = stretched oscillator.
Look for candle confluence. A cyan candle appearing at or beyond the 95.45% VP boundary, near a pivot S/R level, and inside a purple background is the highest-probability reversal context this script identifies.
Use the backgrounds as context, not triggers. Green/red bands fire frequently and are noisy alone. Purple/dark-red bands are rare and pair well with a cyan candle and a structural level.
Trend direction comes from the slope of the smoothed candles and their position relative to the mean channel — not from any single bar.
🔹 Inputs reference and controls
Linear Regression Candles - LinReg period, doji sensitivity
Static Mean Channel - SMA length (also drives RSI and PNR length)
Percentile Nearest Rank - Sensitivity threshold (default 85)
Volume Profile - Rows, width, VA %, history depth, up/down colors, outside-95.45% color, label toggle, line-extension toggle.
Support & Resistance - Pivot lookback, max levels per side, ATR merge tolerance, line width, color, label toggle.
Extreme Oscillator - Candle Color, Enable toggle, custom color.
🔹 Notes & caveats
The Volume Profile reflects the currently visible chart range. Scroll or zoom and it redraws.
The profile recomputes on every realtime tick. Initial load on long-history charts may take a moment.
The 68.2% and 95.45% zones are volume-coverage thresholds, not calculated standard deviations of the volume distribution. The ±1σ / ±2σ labels are an analogy only.
Up-volume / down-volume is a candle-direction proxy, not a true bid/ask tape classification.
"Rejected" / "low-acceptance" areas are potential rejection zones, not confirmed ones — the profile shows where volume was thin, and thin areas are prone to fast traversal, not guaranteed to reverse.
Alerts are provided for the extreme-oscillator conditions (upper and lower).
This indicator is a contextual / analytical tool. It does not generate buy/sell signals.
Pair with a separate momentum oscillator pane if you want confirmation timing.
🔹 Credits
Built with Pine Script v6 using built-in ta.* functions. Logic is original. Feedback welcome.

คำจำกัดสิทธิ์ความรับผิดชอบ
ข้อมูลและบทความไม่ได้มีวัตถุประสงค์เพื่อก่อให้เกิดกิจกรรมทางการเงิน, การลงทุน, การซื้อขาย, ข้อเสนอแนะ หรือคำแนะนำประเภทอื่น ๆ ที่ให้หรือรับรองโดย TradingView อ่านเพิ่มเติมใน ข้อกำหนดการใช้งาน
คำจำกัดสิทธิ์ความรับผิดชอบ
ข้อมูลและบทความไม่ได้มีวัตถุประสงค์เพื่อก่อให้เกิดกิจกรรมทางการเงิน, การลงทุน, การซื้อขาย, ข้อเสนอแนะ หรือคำแนะนำประเภทอื่น ๆ ที่ให้หรือรับรองโดย TradingView อ่านเพิ่มเติมใน ข้อกำหนดการใช้งาน