OPEN-SOURCE SCRIPT
PMH / PML Each Day
# PMH / PML Each Day Levels
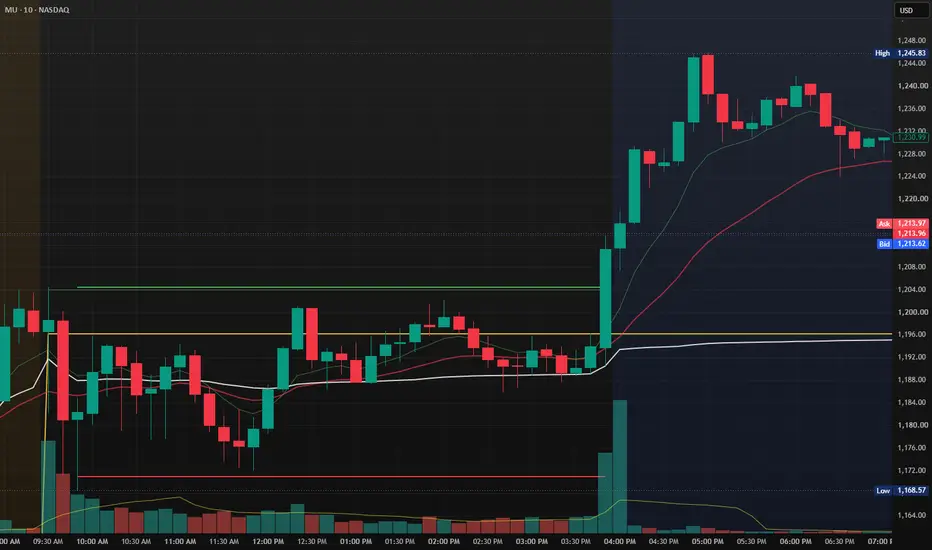
This indicator automatically plots the **Previous Market High (PMH)** and **Previous Market Low (PML)** for every trading day using **Regular Trading Hours (RTH)** only.
### Features
* Plots the Previous Market High (PMH) and Previous Market Low (PML) for every trading session.
* Uses only **9:30 AM – 4:00 PM (Regular Market Hours)**.
* Draws historical PMH/PML levels for every day, making it ideal for backtesting.
* Each day's levels are displayed independently and do not overwrite previous sessions.
* Clean horizontal lines help identify important support and resistance levels.
* Works across all intraday timeframes.
* Perfect for price action, ORB, liquidity sweeps, and breakout/reversal strategies.
### Ideal For
* Intraday traders
* Opening Range Breakout (ORB) traders
* Support & Resistance analysis
* Historical chart review and backtesting
* Liquidity and market structure traders
This indicator provides a simple and reliable way to visualize the previous day's key market levels, allowing traders to quickly identify areas where price may react during the current trading session.
This indicator automatically plots the **Previous Market High (PMH)** and **Previous Market Low (PML)** for every trading day using **Regular Trading Hours (RTH)** only.
### Features
* Plots the Previous Market High (PMH) and Previous Market Low (PML) for every trading session.
* Uses only **9:30 AM – 4:00 PM (Regular Market Hours)**.
* Draws historical PMH/PML levels for every day, making it ideal for backtesting.
* Each day's levels are displayed independently and do not overwrite previous sessions.
* Clean horizontal lines help identify important support and resistance levels.
* Works across all intraday timeframes.
* Perfect for price action, ORB, liquidity sweeps, and breakout/reversal strategies.
### Ideal For
* Intraday traders
* Opening Range Breakout (ORB) traders
* Support & Resistance analysis
* Historical chart review and backtesting
* Liquidity and market structure traders
This indicator provides a simple and reliable way to visualize the previous day's key market levels, allowing traders to quickly identify areas where price may react during the current trading session.
สคริปต์แบบโอเพนซอร์ส
ด้วยเจตนารมณ์หลักของ TradingView ผู้สร้างสคริปต์นี้ได้ทำให้เป็นโอเพนซอร์ส เพื่อให้เทรดเดอร์สามารถตรวจสอบและยืนยันฟังก์ชันการทำงานของมันได้ ขอชื่นชมผู้เขียน! แม้ว่าคุณจะใช้งานได้ฟรี แต่โปรดจำไว้ว่าการเผยแพร่โค้ดซ้ำจะต้องเป็นไปตาม กฎระเบียบการใช้งาน ของเรา

คำจำกัดสิทธิ์ความรับผิดชอบ
ข้อมูลและบทความไม่ได้มีวัตถุประสงค์เพื่อก่อให้เกิดกิจกรรมทางการเงิน, การลงทุน, การซื้อขาย, ข้อเสนอแนะ หรือคำแนะนำประเภทอื่น ๆ ที่ให้หรือรับรองโดย TradingView อ่านเพิ่มเติมใน ข้อกำหนดการใช้งาน
สคริปต์แบบโอเพนซอร์ส
ด้วยเจตนารมณ์หลักของ TradingView ผู้สร้างสคริปต์นี้ได้ทำให้เป็นโอเพนซอร์ส เพื่อให้เทรดเดอร์สามารถตรวจสอบและยืนยันฟังก์ชันการทำงานของมันได้ ขอชื่นชมผู้เขียน! แม้ว่าคุณจะใช้งานได้ฟรี แต่โปรดจำไว้ว่าการเผยแพร่โค้ดซ้ำจะต้องเป็นไปตาม กฎระเบียบการใช้งาน ของเรา
คำจำกัดสิทธิ์ความรับผิดชอบ
ข้อมูลและบทความไม่ได้มีวัตถุประสงค์เพื่อก่อให้เกิดกิจกรรมทางการเงิน, การลงทุน, การซื้อขาย, ข้อเสนอแนะ หรือคำแนะนำประเภทอื่น ๆ ที่ให้หรือรับรองโดย TradingView อ่านเพิ่มเติมใน ข้อกำหนดการใช้งาน