OPEN-SOURCE SCRIPT
ที่อัปเดต: Double Top / Bottom Quality [AGPro Series]
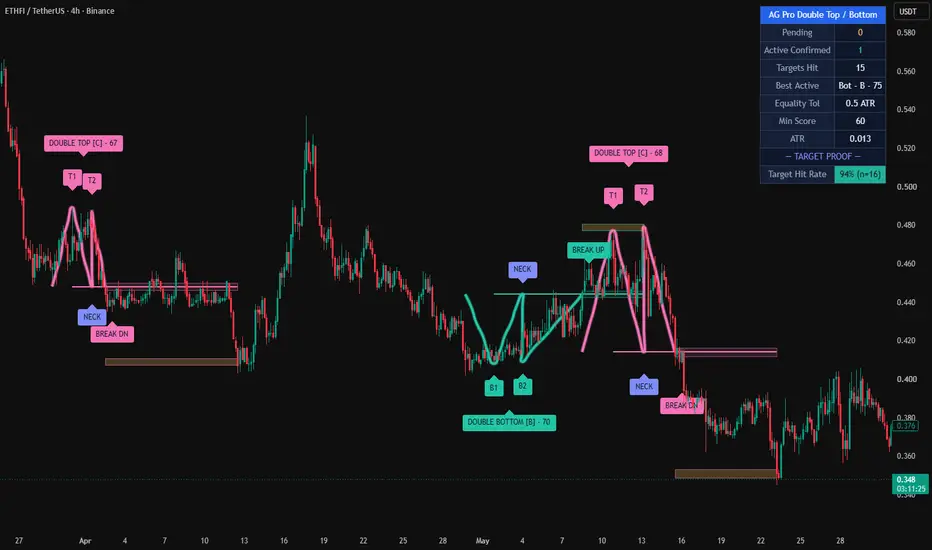
Double Top / Bottom Quality [AGPro Series]
Double Top / Bottom Quality [AGPro Series] is a disciplined, rules-based detector for the two most iconic reversal chart patterns: the Double Top (M-shape) and the Double Bottom (W-shape). Unlike basic pattern finders that fire on any two similar swings, this indicator scores every candidate pattern on a transparent 0–100 Quality Score across four independent factors — and only confirms patterns that pass a user-defined minimum. The result is a cleaner chart with fewer, higher-conviction setups.
Every confirmed pattern delivers a full trading lifecycle: a neckline flip S/R zone (resistance → support on a Double Bottom; support → resistance on a Double Top) and a measured-move target projection band. Pending, confirmed, target-hit and invalidated states are all tracked with disciplined cleanup, so the chart never becomes cluttered.
🔹 WHAT THE INDICATOR DOES
It detects classic Double Top and Double Bottom reversal structures using pivot-based swing analysis with ATR-normalised equality, depth and time-window filters. Each valid candidate is then scored on four independent quality factors. Only candidates that exceed the user-defined minimum score and break the neckline on close are confirmed. Once confirmed, the pattern draws its neckline flip zone and target projection band, labels the setup with its letter grade and score, and tracks the outcome until target hit or invalidation.
🔹 UNIQUE EDGE — WHY IT IS DIFFERENT
Most Double Top / Double Bottom scripts simply connect two similar swings and draw a line. This indicator adds a transparent 4-component Quality Score so every setup is rated before confirmation, not just flagged. Three factors that most scripts ignore are treated as first-class inputs here:
• Pattern Symmetry — the left leg and the right leg of the M / W must be comparable in time, or the pattern is penalised
• Break Volume Confirmation — the neckline break bar is compared to its rolling volume average, and thin breaks score lower
• Depth Quality — shallow, flat patterns are filtered out in favour of deep, decisive reversals
The full lifecycle visualisation (pending → confirmed → target hit) and same-region deduplication are also uncommon in this pattern category, and together they produce a chart that reads cleanly even on long history.
🔹 METHODOLOGY
• Pivot detection via ta.pivothigh / ta.pivotlow with user-configurable length
• Equality check: the two peaks (or troughs) must be within a configurable ATR tolerance
• Time-window filter: minimum and maximum bars allowed between the two pivots
• Depth filter: the vertical distance from peaks to neckline must exceed a minimum ATR threshold
• Neckline: lowest low between the two peaks for a Double Top, or highest high between the two troughs for a Double Bottom
• Confirmation trigger: daily close beyond the neckline
• Invalidation: price exceeds the pattern extreme before the neckline break
• Cooldown: after confirmation, new patterns in the same price region are suppressed for N bars to prevent clustering
🔹 QUALITY SCORE (0–100)
Each confirmed pattern receives a transparent score based on four equally-weighted factors (25 points each):
1. Peak / Trough Equality — how close the two extremes are to each other, measured in ATR units
2. Break Volume Confirmation — break-bar volume relative to the 20-bar average
3. Pattern Symmetry — ratio of the shorter leg to the longer leg (time-based)
4. Depth Quality — pattern height relative to ATR (deeper = higher score)
Score → Grade mapping:
• 85–100 = A
• 70–84 = B
• 55–69 = C
• <55 = D
🔹 SIGNALS, ZONES & ALERTS
Once a pattern confirms, the indicator renders:
• A solid neckline that extends to the right edge
• A neckline flip zone (rectangular S/R band at the neckline level)
• A target projection zone at the measured-move price (pattern height projected from neckline)
• A grade label (A / B / C) and numeric score on the pattern
Two alert types are available: "Confirmed Pattern" fires on confirmation, and "Target Hit" fires when the measured-move target is reached.
🔹 KEY INPUTS
• Pivot Length, ATR Length
• Peak / Trough Equality tolerance (ATR)
• Min / Max bars between peaks
• Minimum Pattern Depth (ATR)
• Break Volume Multiplier
• Cooldown bars
• Minimum Quality Score filter
• Show Pending Patterns toggle
• Show Neckline Flip Zone / Target Zone toggles
• Zone Width (ATR)
• Stale Cleanup Distance, Max Active Zones
• Label size, Panel position / theme / size
• Alert toggles
🔹 HOW TO USE
• Choose a liquid market and a timeframe that matches your trading style (4H and 1D are particularly well-suited to classic reversal patterns)
• Watch for Pending patterns (dashed lines) — these mark candidates awaiting a neckline break
• A Confirmed pattern with grade B or higher is the typical entry signal; aggressive traders may use C-grade while conservative traders may filter to A-grade only
• Use the neckline flip zone as a logical stop-loss reference (above it for Double Tops, below for Double Bottoms)
• Use the target projection zone as a take-profit reference based on the classical measured-move rule
• Combine with higher-timeframe trend, volume profile or an independent confluence tool for best results
🔹 LIMITATIONS & TRANSPARENCY
• Pivot-based detection means patterns confirm with a natural lag equal to the pivot length
• No strategy is 100% reliable — Quality Score filters improve average conviction but do not guarantee outcomes
• Very low-liquidity markets may produce unstable pivots; a longer pivot length helps
• Measured-move targets are a classical reference, not a prediction
• Historical statistics shown in the panel are pattern-completion counts on the loaded chart; they are not a guaranteed forward performance estimate
🔹 RISK DISCLOSURE
This script is provided for educational and analytical purposes only. It is not financial advice and does not constitute a recommendation to buy, sell or hold any asset. Trading involves substantial risk of loss; past pattern performance is not indicative of future results. Always perform your own research and use appropriate risk management.
Open-source under the Mozilla Public License 2.0 — contributions and feedback are welcome.
Double Top / Bottom Quality [AGPro Series] is a disciplined, rules-based detector for the two most iconic reversal chart patterns: the Double Top (M-shape) and the Double Bottom (W-shape). Unlike basic pattern finders that fire on any two similar swings, this indicator scores every candidate pattern on a transparent 0–100 Quality Score across four independent factors — and only confirms patterns that pass a user-defined minimum. The result is a cleaner chart with fewer, higher-conviction setups.
Every confirmed pattern delivers a full trading lifecycle: a neckline flip S/R zone (resistance → support on a Double Bottom; support → resistance on a Double Top) and a measured-move target projection band. Pending, confirmed, target-hit and invalidated states are all tracked with disciplined cleanup, so the chart never becomes cluttered.
🔹 WHAT THE INDICATOR DOES
It detects classic Double Top and Double Bottom reversal structures using pivot-based swing analysis with ATR-normalised equality, depth and time-window filters. Each valid candidate is then scored on four independent quality factors. Only candidates that exceed the user-defined minimum score and break the neckline on close are confirmed. Once confirmed, the pattern draws its neckline flip zone and target projection band, labels the setup with its letter grade and score, and tracks the outcome until target hit or invalidation.
🔹 UNIQUE EDGE — WHY IT IS DIFFERENT
Most Double Top / Double Bottom scripts simply connect two similar swings and draw a line. This indicator adds a transparent 4-component Quality Score so every setup is rated before confirmation, not just flagged. Three factors that most scripts ignore are treated as first-class inputs here:
• Pattern Symmetry — the left leg and the right leg of the M / W must be comparable in time, or the pattern is penalised
• Break Volume Confirmation — the neckline break bar is compared to its rolling volume average, and thin breaks score lower
• Depth Quality — shallow, flat patterns are filtered out in favour of deep, decisive reversals
The full lifecycle visualisation (pending → confirmed → target hit) and same-region deduplication are also uncommon in this pattern category, and together they produce a chart that reads cleanly even on long history.
🔹 METHODOLOGY
• Pivot detection via ta.pivothigh / ta.pivotlow with user-configurable length
• Equality check: the two peaks (or troughs) must be within a configurable ATR tolerance
• Time-window filter: minimum and maximum bars allowed between the two pivots
• Depth filter: the vertical distance from peaks to neckline must exceed a minimum ATR threshold
• Neckline: lowest low between the two peaks for a Double Top, or highest high between the two troughs for a Double Bottom
• Confirmation trigger: daily close beyond the neckline
• Invalidation: price exceeds the pattern extreme before the neckline break
• Cooldown: after confirmation, new patterns in the same price region are suppressed for N bars to prevent clustering
🔹 QUALITY SCORE (0–100)
Each confirmed pattern receives a transparent score based on four equally-weighted factors (25 points each):
1. Peak / Trough Equality — how close the two extremes are to each other, measured in ATR units
2. Break Volume Confirmation — break-bar volume relative to the 20-bar average
3. Pattern Symmetry — ratio of the shorter leg to the longer leg (time-based)
4. Depth Quality — pattern height relative to ATR (deeper = higher score)
Score → Grade mapping:
• 85–100 = A
• 70–84 = B
• 55–69 = C
• <55 = D
🔹 SIGNALS, ZONES & ALERTS
Once a pattern confirms, the indicator renders:
• A solid neckline that extends to the right edge
• A neckline flip zone (rectangular S/R band at the neckline level)
• A target projection zone at the measured-move price (pattern height projected from neckline)
• A grade label (A / B / C) and numeric score on the pattern
Two alert types are available: "Confirmed Pattern" fires on confirmation, and "Target Hit" fires when the measured-move target is reached.
🔹 KEY INPUTS
• Pivot Length, ATR Length
• Peak / Trough Equality tolerance (ATR)
• Min / Max bars between peaks
• Minimum Pattern Depth (ATR)
• Break Volume Multiplier
• Cooldown bars
• Minimum Quality Score filter
• Show Pending Patterns toggle
• Show Neckline Flip Zone / Target Zone toggles
• Zone Width (ATR)
• Stale Cleanup Distance, Max Active Zones
• Label size, Panel position / theme / size
• Alert toggles
🔹 HOW TO USE
• Choose a liquid market and a timeframe that matches your trading style (4H and 1D are particularly well-suited to classic reversal patterns)
• Watch for Pending patterns (dashed lines) — these mark candidates awaiting a neckline break
• A Confirmed pattern with grade B or higher is the typical entry signal; aggressive traders may use C-grade while conservative traders may filter to A-grade only
• Use the neckline flip zone as a logical stop-loss reference (above it for Double Tops, below for Double Bottoms)
• Use the target projection zone as a take-profit reference based on the classical measured-move rule
• Combine with higher-timeframe trend, volume profile or an independent confluence tool for best results
🔹 LIMITATIONS & TRANSPARENCY
• Pivot-based detection means patterns confirm with a natural lag equal to the pivot length
• No strategy is 100% reliable — Quality Score filters improve average conviction but do not guarantee outcomes
• Very low-liquidity markets may produce unstable pivots; a longer pivot length helps
• Measured-move targets are a classical reference, not a prediction
• Historical statistics shown in the panel are pattern-completion counts on the loaded chart; they are not a guaranteed forward performance estimate
🔹 RISK DISCLOSURE
This script is provided for educational and analytical purposes only. It is not financial advice and does not constitute a recommendation to buy, sell or hold any asset. Trading involves substantial risk of loss; past pattern performance is not indicative of future results. Always perform your own research and use appropriate risk management.
Open-source under the Mozilla Public License 2.0 — contributions and feedback are welcome.
Release Note
🔧 UPDATE NOTES - V1.9This update focuses on final visual polish, educational pattern geometry, and label spacing.
The core purpose of the script remains unchanged.
This release improves how the Double Top / Double Bottom skeleton begins, how point labels are spaced, and how break labels sit on the chart.
This script continues to function as an analytical and visualization tool.
It does not attempt to predict price direction or provide guaranteed outcomes.
------------------------
What Changed
------------------------
• Added an entry leg to the educational skeleton.
The M/W drawing now starts before B1 or T1 from the approximate neckline side of the structure, making the formation shape fuller and easier to understand.
• Improved B1 / B2 / T1 / T2 label spacing.
Point labels now use compact tiny tags and sit farther away from the candles and main pattern label.
• Improved break label placement.
BREAK UP and BREAK DN labels are shifted forward and farther away from the neckline to reduce collision with skeleton lines and candles.
• Increased main pattern label breathing room.
The main Double Top / Double Bottom label is offset farther from the structure so point labels and the main label do not crowd each other.
------------------------
Visual Improvements
------------------------
• The educational W/M drawing now begins from the first formation leg rather than only from the first bottom or top.
• Thick skeleton lines remain visible and instructional.
• B1/B2 and T1/T2 labels remain available across historical structures.
• Overall chart spacing is cleaner while preserving the premium educational map style.
------------------------
Interface & Usability
------------------------
• Preserved "Keep Educational History" as default-on.
• Preserved "Pattern Skeleton Width" for user-controlled visual strength.
• Kept "Show Pattern Skeleton" and "Show Pattern Point Labels" default-on.
• Preserved panel location, panel theme, panel show/hide, label size, and panel font-size controls.
------------------------
Behavior Notes
------------------------
This update does not change the core analytical logic of the script.
The goal is to improve visual structure and chart education, not to introduce new predictive behavior.
Users should interpret outputs the same way as before, but with a clearer formation map.
------------------------
Limitations Reminder
------------------------
The script remains a rule-based analytical tool.
Market conditions such as volatility, liquidity, and timeframe differences may affect how patterns appear.
Outputs should always be interpreted within broader market context.
------------------------
Risk Reminder
------------------------
This script is for educational and analytical purposes only.
It does not provide financial advice or guaranteed trading outcomes.
Users remain responsible for their own decisions.
Release Note
🔧 UPDATE NOTES - v2.0This update focuses on visual clarity and presentation.
The core purpose of the script remains unchanged.
This release improves how the existing Double Top and Double Bottom logic is
presented on the chart. Detection, the 4-component Quality Score, neckline flip
zones, measured-move target bands, and lifecycle tracking all behave exactly as
before.
This script continues to function as an analytical and visualization tool.
It does not attempt to predict price direction or provide guaranteed outcomes.
------------------------
What Changed
------------------------
• Smooth, hand-drawn curved M/W skeleton
The Double Top (M) and Double Bottom (W) structure is now drawn as one
continuous, corner-less curve that flows through the entry, first top/bottom,
neckline, second top/bottom, and the confirmed break leg — replacing the
previous straight, angular segments. The curve is tuned to hug the actual tops,
bottoms, and neckline so it reads like a clean, hand-drawn annotation without
overshooting the structure. The same anchor points and detection logic are used;
only the way the skeleton is rendered changed.
• High-contrast label ink
All on-chart badges (point tags, neckline tag, break tag, zone badges, and
pattern labels) now use a luminance-based ink rule, so text stays sharp and
readable on both bright and dark badge fills across every theme.
• Brand-consistent TARGET PROOF panel section
The panel now carries a dedicated "— TARGET PROOF —" section showing the
Target Hit Rate with its sample size, matching the AGPro proof presentation used
across the series. It shows "Building" until enough confirmed patterns exist.
• Consistent label sizing
Pattern point tags now follow the script's Label Size setting for a uniform,
controllable look.
------------------------
Visual Improvements
------------------------
• Improved chart readability with a smooth, continuous pattern skeleton that
reads cleanly at a glance instead of as angular segments.
• Reduced visual clutter to enhance first-glance interpretation.
• Refined visual hierarchy so the structure, the neckline, and the projected
target read as one connected story.
• Adjusted label ink so text stays clearly legible against candles and badge
fills on every theme.
------------------------
Interface & Usability
------------------------
• Optimized panel layout for clearer information flow, with the target proof
presented in its own section.
• Improved label readability for better chart interaction.
• Adjusted default visual settings for a more balanced appearance.
• Enhanced overall user experience without changing core logic.
------------------------
Behavior Notes
------------------------
This update does not change the core analytical logic of the script.
The goal is to improve clarity and usability, not to introduce new predictive
behavior. Users should interpret outputs the same way as before, but with
improved visual structure.
------------------------
Limitations Reminder
------------------------
The script remains a rule-based analytical tool.
Market conditions such as volatility, liquidity, and timeframe differences may
affect how patterns and signals appear.
Outputs should always be interpreted within broader market context.
------------------------
Risk Reminder
------------------------
This script is for educational and analytical purposes only.
It does not provide financial advice or guaranteed trading outcomes.
Users remain responsible for their own decisions.
สคริปต์โอเพนซอร์ซ
ด้วยเจตนารมณ์หลักของ TradingView ผู้สร้างสคริปต์นี้ได้ทำให้เป็นโอเพนซอร์ส เพื่อให้เทรดเดอร์สามารถตรวจสอบและยืนยันฟังก์ชันการทำงานของมันได้ ขอชื่นชมผู้เขียน! แม้ว่าคุณจะใช้งานได้ฟรี แต่โปรดจำไว้ว่าการเผยแพร่โค้ดซ้ำจะต้องเป็นไปตาม กฎระเบียบการใช้งาน ของเรา

Public-free scripts + invite-only AGPro workflows for market analysis, liquidity context, risk planning and execution review.
Rules-based. No hype. No guesswork.
Library & access: agprolabs.com/
Telegram: t.me/agprolabs
Rules-based. No hype. No guesswork.
Library & access: agprolabs.com/
Telegram: t.me/agprolabs
คำจำกัดสิทธิ์ความรับผิดชอบ
ข้อมูลและบทความไม่ได้มีวัตถุประสงค์เพื่อก่อให้เกิดกิจกรรมทางการเงิน, การลงทุน, การซื้อขาย, ข้อเสนอแนะ หรือคำแนะนำประเภทอื่น ๆ ที่ให้หรือรับรองโดย TradingView อ่านเพิ่มเติมใน ข้อกำหนดการใช้งาน
สคริปต์โอเพนซอร์ซ
ด้วยเจตนารมณ์หลักของ TradingView ผู้สร้างสคริปต์นี้ได้ทำให้เป็นโอเพนซอร์ส เพื่อให้เทรดเดอร์สามารถตรวจสอบและยืนยันฟังก์ชันการทำงานของมันได้ ขอชื่นชมผู้เขียน! แม้ว่าคุณจะใช้งานได้ฟรี แต่โปรดจำไว้ว่าการเผยแพร่โค้ดซ้ำจะต้องเป็นไปตาม กฎระเบียบการใช้งาน ของเรา
Public-free scripts + invite-only AGPro workflows for market analysis, liquidity context, risk planning and execution review.
Rules-based. No hype. No guesswork.
Library & access: agprolabs.com/
Telegram: t.me/agprolabs
Rules-based. No hype. No guesswork.
Library & access: agprolabs.com/
Telegram: t.me/agprolabs
คำจำกัดสิทธิ์ความรับผิดชอบ
ข้อมูลและบทความไม่ได้มีวัตถุประสงค์เพื่อก่อให้เกิดกิจกรรมทางการเงิน, การลงทุน, การซื้อขาย, ข้อเสนอแนะ หรือคำแนะนำประเภทอื่น ๆ ที่ให้หรือรับรองโดย TradingView อ่านเพิ่มเติมใน ข้อกำหนดการใช้งาน