PulseRank NomadaScalper
PulseRank NomadaScalper
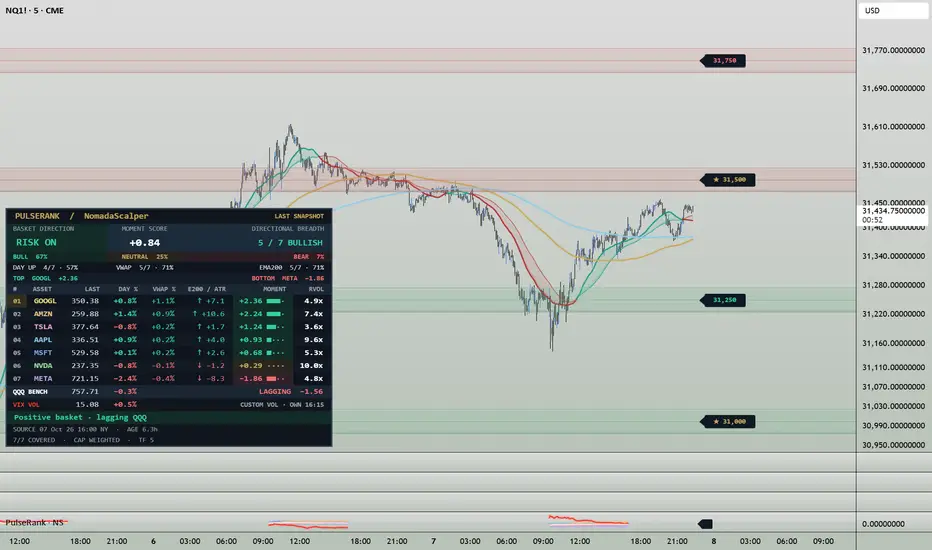
PulseRank is a market leadership dashboard that compares seven stocks using momentum, volatility and trend positioning. Its purpose is to help traders distinguish broad participation from strength concentrated in a few names.
The default basket contains NVIDIA, Microsoft, Apple, Amazon, Meta, Alphabet and Tesla. QQQ provides benchmark context, while VIX adds a separate view of volatility conditions. The basket symbols, benchmark and volatility source are configurable.
Each stock is evaluated using three components:
• Recent price movement, measured relative to its own Average True Range.
• Price positioning relative to session VWAP.
• Price positioning relative to its 200-period EMA.
These components are normalized and combined into a bounded score. This allows stocks with different prices and volatility profiles to be compared within the same framework. Daily percentage change is displayed separately and does not determine the ranking.
Scores range from −3 to +3. Values above +0.30 are classified as bullish, values below −0.30 as bearish, and readings between those thresholds as neutral. These classifications describe the model’s current reading. They are not probabilities or measures of trade accuracy.
The dashboard brings together:
• A ranked list of the selected stocks.
• The aggregate basket score and directional state.
• Bullish, neutral and bearish basket composition.
• Participation above the previous close, VWAP and EMA.
• Relative volume and individual price performance.
• Benchmark comparison and volatility context.
• Source timestamps, data coverage and the active weighting method.
Directional breadth counts how many eligible stocks fall into each category. Basket composition uses their assigned weights. These readings can differ because a small number of heavily weighted stocks can influence the aggregate score more than the remaining members.
The default Auto cap mode estimates weights using price and reported quarterly shares outstanding. It uses those estimates only when every eligible member has valid information in the same currency. Otherwise, the entire eligible basket switches to equal weighting. Equal weighting can also be selected manually. These estimates are not official Nasdaq or QQQ index weights.
Performance lines appear in a separate pane and show each instrument’s percentage change from its own previous daily close. Compact labels identify the individual series. The dashboard offers multiple sizes and positions, with an optional research view for additional detail.
An optional SMA cloud appears on the main price chart. Unlike the stock basket calculations, this cloud uses the chart instrument itself.
Optional BUY and SELL markers identify transitions in which the volatility index’s daily percentage change moves below or above all seven basket members. A chart trend filter can require price to be above or below both cloud averages. Optional pullback dots identify cloud reclaims or rejections while the volatility condition remains at a configured extreme.
Signal events require a confirmed chart close, complete basket coverage and matching source closing times. Comparing VIX percentage changes with stock percentage changes is a heuristic; it does not imply that their movements have equivalent statistical meaning.
For interpretation, start with the basket state, then check participation and individual rankings. A positive basket with limited bullish participation describes a different condition from one supported by most members. Benchmark comparison helps identify whether the basket’s normalized score is leading or lagging QQQ. The highest-ranked stock can still have a negative score when the entire basket is weak.
The source timeframe defaults to five minutes and is independent of the chart timeframe. Developing source readings can change before their bars close. Higher chart timeframes sample available source observations and do not reconstruct every intermediate crossing, so signal histories may differ across chart timeframes.
The default configuration is designed around US equity market context. Displaying it on another asset does not change the underlying basket or establish predictive validity for that asset. Signal markers require standard intraday charts.
Missing or stale data are identified rather than counted as directional agreement. Outside regular trading hours, a retained reading represents the last available snapshot. Data availability and delays depend on the selected feeds and subscriptions.
PulseRank combines normalized leadership ranking, weighted composition, participation and source validation in one workflow. It is an analytical indicator, not an automated trading strategy. Its scores and markers do not establish a win rate or guarantee future performance.
PulseRank is a market leadership dashboard that compares seven stocks using momentum, volatility and trend positioning. Its purpose is to help traders distinguish broad participation from strength concentrated in a few names.
The default basket contains NVIDIA, Microsoft, Apple, Amazon, Meta, Alphabet and Tesla. QQQ provides benchmark context, while VIX adds a separate view of volatility conditions. The basket symbols, benchmark and volatility source are configurable.
Each stock is evaluated using three components:
• Recent price movement, measured relative to its own Average True Range.
• Price positioning relative to session VWAP.
• Price positioning relative to its 200-period EMA.
These components are normalized and combined into a bounded score. This allows stocks with different prices and volatility profiles to be compared within the same framework. Daily percentage change is displayed separately and does not determine the ranking.
Scores range from −3 to +3. Values above +0.30 are classified as bullish, values below −0.30 as bearish, and readings between those thresholds as neutral. These classifications describe the model’s current reading. They are not probabilities or measures of trade accuracy.
The dashboard brings together:
• A ranked list of the selected stocks.
• The aggregate basket score and directional state.
• Bullish, neutral and bearish basket composition.
• Participation above the previous close, VWAP and EMA.
• Relative volume and individual price performance.
• Benchmark comparison and volatility context.
• Source timestamps, data coverage and the active weighting method.
Directional breadth counts how many eligible stocks fall into each category. Basket composition uses their assigned weights. These readings can differ because a small number of heavily weighted stocks can influence the aggregate score more than the remaining members.
The default Auto cap mode estimates weights using price and reported quarterly shares outstanding. It uses those estimates only when every eligible member has valid information in the same currency. Otherwise, the entire eligible basket switches to equal weighting. Equal weighting can also be selected manually. These estimates are not official Nasdaq or QQQ index weights.
Performance lines appear in a separate pane and show each instrument’s percentage change from its own previous daily close. Compact labels identify the individual series. The dashboard offers multiple sizes and positions, with an optional research view for additional detail.
An optional SMA cloud appears on the main price chart. Unlike the stock basket calculations, this cloud uses the chart instrument itself.
Optional BUY and SELL markers identify transitions in which the volatility index’s daily percentage change moves below or above all seven basket members. A chart trend filter can require price to be above or below both cloud averages. Optional pullback dots identify cloud reclaims or rejections while the volatility condition remains at a configured extreme.
Signal events require a confirmed chart close, complete basket coverage and matching source closing times. Comparing VIX percentage changes with stock percentage changes is a heuristic; it does not imply that their movements have equivalent statistical meaning.
For interpretation, start with the basket state, then check participation and individual rankings. A positive basket with limited bullish participation describes a different condition from one supported by most members. Benchmark comparison helps identify whether the basket’s normalized score is leading or lagging QQQ. The highest-ranked stock can still have a negative score when the entire basket is weak.
The source timeframe defaults to five minutes and is independent of the chart timeframe. Developing source readings can change before their bars close. Higher chart timeframes sample available source observations and do not reconstruct every intermediate crossing, so signal histories may differ across chart timeframes.
The default configuration is designed around US equity market context. Displaying it on another asset does not change the underlying basket or establish predictive validity for that asset. Signal markers require standard intraday charts.
Missing or stale data are identified rather than counted as directional agreement. Outside regular trading hours, a retained reading represents the last available snapshot. Data availability and delays depend on the selected feeds and subscriptions.
PulseRank combines normalized leadership ranking, weighted composition, participation and source validation in one workflow. It is an analytical indicator, not an automated trading strategy. Its scores and markers do not establish a win rate or guarantee future performance.

NomadaScalper
คำจำกัดสิทธิ์ความรับผิดชอบ
ข้อมูลและบทความไม่ได้มีวัตถุประสงค์เพื่อก่อให้เกิดกิจกรรมทางการเงิน, การลงทุน, การซื้อขาย, ข้อเสนอแนะ หรือคำแนะนำประเภทอื่น ๆ ที่ให้หรือรับรองโดย TradingView อ่านเพิ่มเติมใน ข้อกำหนดการใช้งาน
NomadaScalper
คำจำกัดสิทธิ์ความรับผิดชอบ
ข้อมูลและบทความไม่ได้มีวัตถุประสงค์เพื่อก่อให้เกิดกิจกรรมทางการเงิน, การลงทุน, การซื้อขาย, ข้อเสนอแนะ หรือคำแนะนำประเภทอื่น ๆ ที่ให้หรือรับรองโดย TradingView อ่านเพิ่มเติมใน ข้อกำหนดการใช้งาน