OPEN-SOURCE SCRIPT
ที่อัปเดต: Volatility Stop Run Planner [AGPro Series]
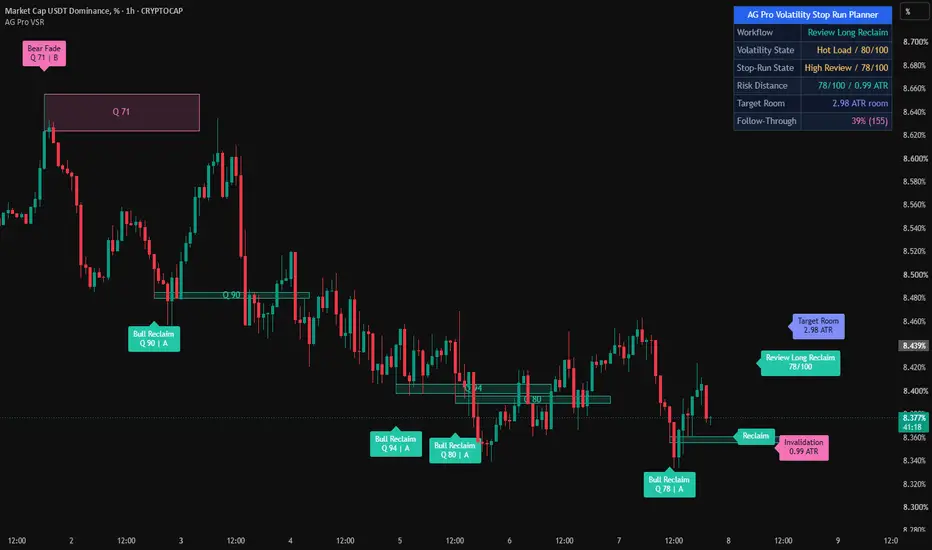
Volatility Stop Run Planner [AGPro Series]
🧠 Core Idea
Is the current volatility spike a stop-run review context, or is it behaving more like real expansion?
📌 Overview / What it does
Volatility Stop Run Planner [AGPro Series] is a chart-first volatility risk and execution-readiness tool designed to evaluate sharp ATR expansion around recent range edges.
The script studies wick expansion, ATR load, close recovery, range-edge penetration, reclaim quality, and early follow-through. It then converts qualified events into a 0-100 planner score, a clear next-action state, reclaim guides, invalidation guides, target-room references, stop-run review zones, expansion review zones, and a clean AGPro planning panel.
It does not predict where price must go next. It does not automate entries or exits. It is built to organize volatile stop-run and expansion contexts so traders can evaluate the event with more structure.
🎯 Purpose & Design Philosophy
This script was built for traders who need a practical decision framework during fast volatility spikes.
Many charts look most confusing exactly when volatility expands: wicks stretch, stops may be triggered, range edges are breached, and the candle can either reclaim or continue. This planner fills that gap by asking whether the spike is showing stop-run characteristics, real expansion behavior, or a cooldown state that still needs confirmation.
The design supports a planning mindset: identify the event, evaluate quality, locate the reclaim level, define invalidation context, estimate target room, and decide what deserves attention next.
⚡ Why This Script Is Different
Most stop-run tools focus on liquidity sweeps, stop-hunt zones, or level raids.
This script does NOT try to become another liquidity grab detector, stop-hunt map, order block map, or generic sweep marker.
Instead, it focuses on the volatility event itself. It evaluates whether a spike around a recent range edge is recovering, rejecting, expanding, or entering a cooldown window. The core output is not a buy or sell signal. It is a planner state that helps the user decide whether the current volatility context deserves review, patience, or no action.
⚙️ Methodology
1. Context Detection
The script measures ATR load, candle range relative to ATR, wick dominance, body efficiency, and recent range-edge interaction.
2. Reference Mapping
It maps the recent high / low reference range, the reclaim level, the spike extreme, the invalidation guide, and the target-room reference.
3. Reaction Evaluation
The model scores stop-run risk, reclaim quality, volatility load, range-edge penetration, and expansion quality. These components are blended into a 0-100 planner score.
4. Visual Output
Qualified events are displayed through stop-run review zones, expansion review zones, reclaim lines, active risk / target guides, optional volatility cooldown boxes, premium labels, alerts, and a compact AGPro panel.
🗺️ How to Read the Chart
Zones = stop-run or expansion review areas created around qualified volatility spike events.
Labels = compact event markers showing the detected context, planner score, score tier, and next-action state.
Colors = bullish reclaim contexts use AGPro teal, bearish reclaim contexts use AGPro pink, and expansion / neutral review contexts use controlled accent tones.
Panel = the panel summarizes Spike State, Planner Score, Stop-Run Risk, Reclaim Quality, Risk / Target, Volatility Load, and Action.
🚦 Signals & States
• Bull Stop-Run → downside spike below the recent range edge followed by reclaim-quality behavior.
• Bear Stop-Run → upside spike above the recent range edge followed by rejection-quality behavior.
• Expansion Up → volatility spike closes cleanly above the recent range edge with stronger body efficiency.
• Expansion Down → volatility spike closes cleanly below the recent range edge with stronger body efficiency.
• Spike Watch → volatility is elevated, but the candle has not yet produced enough reclaim or expansion evidence.
• Normal Load → no qualified volatility event is currently detected.
🔔 Alerts Logic
Alerts trigger when the planner detects a qualified Bull Stop-Run Review, Bear Stop-Run Review, Expansion Up Review, Expansion Down Review, or Spike Watch context.
These alerts are attention markers. They are not trade instructions, entry signals, exit signals, or automated strategy commands.
🧩 Confluence Logic
The strongest planner states appear when multiple conditions align:
ATR spike + wick expansion + range-edge penetration + reclaim quality + clean risk / target context.
When the spike reclaims the reference level with strong wick rejection, the stop-run review context becomes stronger. When the candle closes beyond the range edge with strong body efficiency, the expansion review context becomes stronger.
📊 When to Use
• Around sudden volatility spikes
• Near recent range highs or lows
• During breakout or breakdown attempts
• After large wick candles that need structured interpretation
• When deciding whether a fast move deserves review, patience, or no action
⚠️ When NOT to Use
• Extremely low-liquidity symbols
• Very noisy micro-timeframes
• News-driven candles with abnormal gaps
• Markets where ATR is distorted by isolated historical spikes
• Situations where the user expects a simple signal-only entry tool
🎛️ Key Inputs
• Sensitivity → controls how selective the spike and stop-run planner should be.
• Reference Lookback → defines the recent range edge used for spike evaluation.
• ATR Length → normalizes volatility, invalidation, target room, and label spacing.
• Minimum Planner Score → sets the score required before events are drawn.
• Confirmation Mode → controls how strict reclaim or expansion confirmation should be.
• Cooldown Bars → defines the post-spike visual review window.
• Visual settings → control zones, labels, guides, panel theme, panel location, and font sizes.
🖥️ Interface & Visual Design
The interface is designed to stay chart-first.
The panel provides the decision summary. The chart zones show where the volatility event happened. The reclaim line identifies the reference level. The risk / target guides frame the active review context without turning the script into a trade command system.
The visual hierarchy is intentionally compact, premium, and readable.
🧪 Practical Usage Workflow
1. Read the panel to identify the current Spike State and Planner Score.
2. Check whether the chart is showing a stop-run review, expansion review, or spike watch context.
3. Compare the reclaim line with the candle close and wick behavior.
4. Review the invalidation and target-room guides.
5. Interpret the event within broader market structure and volatility conditions.
🔍 Interpretation Guidelines
A high stop-run risk score means the spike has stronger rejection and reclaim characteristics.
A high expansion score means the spike is behaving more like continuation through the range edge.
A cooldown window means the event needs follow-through review rather than immediate interpretation.
No single score should be read in isolation. The strongest use case is to combine the planner state with structure, liquidity, trend, and timeframe context.
🚫 What This Script Is NOT
• Not a prediction engine
• Not financial advice
• Not an auto trading system
• Not a guaranteed signal tool
• Not a liquidity grab detector
• Not a stop-hunt zone map
• Not an order block or FVG map
⚠️ Limitations & Transparency
Volatility behavior changes across symbols, sessions, and timeframes.
ATR can expand sharply during news, low-liquidity gaps, or abnormal market conditions.
Some stop-run-looking candles can still continue in the same direction. Some expansion-looking candles can fail quickly. The script provides structured context, not certainty.
🧠 Market Context Notes
Stop-run behavior often appears when price briefly trades through visible reference areas and then reclaims them.
Expansion behavior often appears when price accepts beyond the reference with stronger body efficiency and less rejection.
The planner is designed to help users separate these contexts with a consistent rule-based framework.
🧾 Use Case Examples
When price spikes below a recent low, leaves a large lower wick, and closes back above the reference, the script may classify the event as a Bull Stop-Run Review.
When price expands above a recent high with a strong body close and limited upper rejection, the script may classify the event as Expansion Up.
When volatility spikes but reclaim or expansion evidence is incomplete, the script may show Spike Watch or keep the event in cooldown.
🧱 System Philosophy
Volatility Stop Run Planner follows the AGPro Series decision-engine approach:
Context first.
Risk before reaction.
Reclaim before assumption.
Expansion quality before excitement.
Attention markers instead of promises.
🔐 Non-Promise Statement
No indicator can remove uncertainty.
No state, score, label, alert, line, or zone should be interpreted as guaranteed market direction.
📉 Risk Disclosure
Trading involves risk.
Users remain responsible for their own analysis, risk management, and decisions.
This script is for educational and analytical purposes only and does not provide financial advice.
📚 Educational Note
The script is designed to make volatile candles easier to review by separating stop-run behavior, expansion behavior, and cooldown context into a clean visual planning workflow.
🧠 Core Idea
Is the current volatility spike a stop-run review context, or is it behaving more like real expansion?
📌 Overview / What it does
Volatility Stop Run Planner [AGPro Series] is a chart-first volatility risk and execution-readiness tool designed to evaluate sharp ATR expansion around recent range edges.
The script studies wick expansion, ATR load, close recovery, range-edge penetration, reclaim quality, and early follow-through. It then converts qualified events into a 0-100 planner score, a clear next-action state, reclaim guides, invalidation guides, target-room references, stop-run review zones, expansion review zones, and a clean AGPro planning panel.
It does not predict where price must go next. It does not automate entries or exits. It is built to organize volatile stop-run and expansion contexts so traders can evaluate the event with more structure.
🎯 Purpose & Design Philosophy
This script was built for traders who need a practical decision framework during fast volatility spikes.
Many charts look most confusing exactly when volatility expands: wicks stretch, stops may be triggered, range edges are breached, and the candle can either reclaim or continue. This planner fills that gap by asking whether the spike is showing stop-run characteristics, real expansion behavior, or a cooldown state that still needs confirmation.
The design supports a planning mindset: identify the event, evaluate quality, locate the reclaim level, define invalidation context, estimate target room, and decide what deserves attention next.
⚡ Why This Script Is Different
Most stop-run tools focus on liquidity sweeps, stop-hunt zones, or level raids.
This script does NOT try to become another liquidity grab detector, stop-hunt map, order block map, or generic sweep marker.
Instead, it focuses on the volatility event itself. It evaluates whether a spike around a recent range edge is recovering, rejecting, expanding, or entering a cooldown window. The core output is not a buy or sell signal. It is a planner state that helps the user decide whether the current volatility context deserves review, patience, or no action.
⚙️ Methodology
1. Context Detection
The script measures ATR load, candle range relative to ATR, wick dominance, body efficiency, and recent range-edge interaction.
2. Reference Mapping
It maps the recent high / low reference range, the reclaim level, the spike extreme, the invalidation guide, and the target-room reference.
3. Reaction Evaluation
The model scores stop-run risk, reclaim quality, volatility load, range-edge penetration, and expansion quality. These components are blended into a 0-100 planner score.
4. Visual Output
Qualified events are displayed through stop-run review zones, expansion review zones, reclaim lines, active risk / target guides, optional volatility cooldown boxes, premium labels, alerts, and a compact AGPro panel.
🗺️ How to Read the Chart
Zones = stop-run or expansion review areas created around qualified volatility spike events.
Labels = compact event markers showing the detected context, planner score, score tier, and next-action state.
Colors = bullish reclaim contexts use AGPro teal, bearish reclaim contexts use AGPro pink, and expansion / neutral review contexts use controlled accent tones.
Panel = the panel summarizes Spike State, Planner Score, Stop-Run Risk, Reclaim Quality, Risk / Target, Volatility Load, and Action.
🚦 Signals & States
• Bull Stop-Run → downside spike below the recent range edge followed by reclaim-quality behavior.
• Bear Stop-Run → upside spike above the recent range edge followed by rejection-quality behavior.
• Expansion Up → volatility spike closes cleanly above the recent range edge with stronger body efficiency.
• Expansion Down → volatility spike closes cleanly below the recent range edge with stronger body efficiency.
• Spike Watch → volatility is elevated, but the candle has not yet produced enough reclaim or expansion evidence.
• Normal Load → no qualified volatility event is currently detected.
🔔 Alerts Logic
Alerts trigger when the planner detects a qualified Bull Stop-Run Review, Bear Stop-Run Review, Expansion Up Review, Expansion Down Review, or Spike Watch context.
These alerts are attention markers. They are not trade instructions, entry signals, exit signals, or automated strategy commands.
🧩 Confluence Logic
The strongest planner states appear when multiple conditions align:
ATR spike + wick expansion + range-edge penetration + reclaim quality + clean risk / target context.
When the spike reclaims the reference level with strong wick rejection, the stop-run review context becomes stronger. When the candle closes beyond the range edge with strong body efficiency, the expansion review context becomes stronger.
📊 When to Use
• Around sudden volatility spikes
• Near recent range highs or lows
• During breakout or breakdown attempts
• After large wick candles that need structured interpretation
• When deciding whether a fast move deserves review, patience, or no action
⚠️ When NOT to Use
• Extremely low-liquidity symbols
• Very noisy micro-timeframes
• News-driven candles with abnormal gaps
• Markets where ATR is distorted by isolated historical spikes
• Situations where the user expects a simple signal-only entry tool
🎛️ Key Inputs
• Sensitivity → controls how selective the spike and stop-run planner should be.
• Reference Lookback → defines the recent range edge used for spike evaluation.
• ATR Length → normalizes volatility, invalidation, target room, and label spacing.
• Minimum Planner Score → sets the score required before events are drawn.
• Confirmation Mode → controls how strict reclaim or expansion confirmation should be.
• Cooldown Bars → defines the post-spike visual review window.
• Visual settings → control zones, labels, guides, panel theme, panel location, and font sizes.
🖥️ Interface & Visual Design
The interface is designed to stay chart-first.
The panel provides the decision summary. The chart zones show where the volatility event happened. The reclaim line identifies the reference level. The risk / target guides frame the active review context without turning the script into a trade command system.
The visual hierarchy is intentionally compact, premium, and readable.
🧪 Practical Usage Workflow
1. Read the panel to identify the current Spike State and Planner Score.
2. Check whether the chart is showing a stop-run review, expansion review, or spike watch context.
3. Compare the reclaim line with the candle close and wick behavior.
4. Review the invalidation and target-room guides.
5. Interpret the event within broader market structure and volatility conditions.
🔍 Interpretation Guidelines
A high stop-run risk score means the spike has stronger rejection and reclaim characteristics.
A high expansion score means the spike is behaving more like continuation through the range edge.
A cooldown window means the event needs follow-through review rather than immediate interpretation.
No single score should be read in isolation. The strongest use case is to combine the planner state with structure, liquidity, trend, and timeframe context.
🚫 What This Script Is NOT
• Not a prediction engine
• Not financial advice
• Not an auto trading system
• Not a guaranteed signal tool
• Not a liquidity grab detector
• Not a stop-hunt zone map
• Not an order block or FVG map
⚠️ Limitations & Transparency
Volatility behavior changes across symbols, sessions, and timeframes.
ATR can expand sharply during news, low-liquidity gaps, or abnormal market conditions.
Some stop-run-looking candles can still continue in the same direction. Some expansion-looking candles can fail quickly. The script provides structured context, not certainty.
🧠 Market Context Notes
Stop-run behavior often appears when price briefly trades through visible reference areas and then reclaims them.
Expansion behavior often appears when price accepts beyond the reference with stronger body efficiency and less rejection.
The planner is designed to help users separate these contexts with a consistent rule-based framework.
🧾 Use Case Examples
When price spikes below a recent low, leaves a large lower wick, and closes back above the reference, the script may classify the event as a Bull Stop-Run Review.
When price expands above a recent high with a strong body close and limited upper rejection, the script may classify the event as Expansion Up.
When volatility spikes but reclaim or expansion evidence is incomplete, the script may show Spike Watch or keep the event in cooldown.
🧱 System Philosophy
Volatility Stop Run Planner follows the AGPro Series decision-engine approach:
Context first.
Risk before reaction.
Reclaim before assumption.
Expansion quality before excitement.
Attention markers instead of promises.
🔐 Non-Promise Statement
No indicator can remove uncertainty.
No state, score, label, alert, line, or zone should be interpreted as guaranteed market direction.
📉 Risk Disclosure
Trading involves risk.
Users remain responsible for their own analysis, risk management, and decisions.
This script is for educational and analytical purposes only and does not provide financial advice.
📚 Educational Note
The script is designed to make volatile candles easier to review by separating stop-run behavior, expansion behavior, and cooldown context into a clean visual planning workflow.
Release Note
UPDATE NOTES - Version 1.5This update focuses on publication readability, stronger default visual hierarchy, light-theme-safe labels, and cleaner risk / target interpretation.
The core purpose of the script remains unchanged.
This release improves how the existing volatility spike, stop-run review, reclaim quality, invalidation, and target-room logic is presented on the chart.
This script continues to function as an analytical and visualization tool.
It does not attempt to predict price direction or provide guaranteed outcomes.
------------------------
What Changed
------------------------
* Reduced default chart crowding further.
Balanced label density now keeps a tighter visual story with fewer historical zones and fewer duplicate event labels.
* Disabled extra historical guide lines by default.
Risk, target, and reclaim guide plots remain available in settings, but the public default now relies on premium badges, zone context, and the panel instead of repeated line clutter.
* Refined event label selection.
Balanced mode now prioritizes stop-run reclaim / fade story labels and keeps release context inside centered zone badges instead of printing duplicate labels over candles.
* Improved zone label placement.
Centered zone badges are shifted into the forward part of each projected zone, helping labels stay readable and less embedded in candle bodies.
* Reduced right-edge tag pressure.
Balanced mode focuses on workflow and target-room context by default. Invalidation distance is shown only when it is close enough to matter visually, or when Detailed mode is selected.
* Preserved contrast-safe label behavior.
Transparent boxes do not carry pale text. Important text remains inside solid contrast-aware badges for dark and light chart themes.
------------------------
Visual Improvements
------------------------
* Improved chart readability by reducing repeated release-review labels and historical guide lines.
* Reduced visual clutter while keeping enough meaningful labels and zones for a premium public screenshot.
* Refined visual hierarchy so stop-run zones, release zones, risk distance, and target room stand out more clearly.
* Adjusted zone label positioning and projection defaults to reduce overlap with candles and right-edge price labels.
* Maintained light-theme safety by avoiding white or pale text directly on transparent chart objects.
------------------------
Interface & Usability
------------------------
* Preserved the dashboard-style panel flow: Workflow, Volatility State, Stop-Run State, Risk Distance, Target Room, and Review.
* Preserved the merged AGPro blue header row with the script name only.
* Kept complete panel controls for show/hide, location, theme, and font size.
* Kept complete chart controls for label density, label detail, label font size, offsets, projections, and right-edge tags.
------------------------
Behavior Notes
------------------------
This update does not change the core analytical logic of the script.
The goal is to improve clarity, readability, and usability, not to introduce predictive behavior.
Users should interpret outputs the same way as before, but with a cleaner visual structure and a more selective default story.
------------------------
Limitations Reminder
------------------------
The script remains a rule-based analytical tool.
Market conditions such as volatility, liquidity, symbol behavior, and timeframe differences may affect how events appear.
Outputs should always be interpreted within broader market context.
------------------------
Risk Reminder
------------------------
This script is for educational and analytical purposes only.
It does not provide financial advice or guaranteed trading outcomes.
Users remain responsible for their own decisions.
Release Note
🔧 UPDATE NOTES - 1.6This update adds a follow-through proof layer and sharper target planning to the
Volatility Stop Run Planner. The core volatility, stop-run and expansion logic
remains unchanged. This script continues to function as an analytical and
visualization tool. It does not predict price direction or guarantee outcomes.
------------------------
What Changed
------------------------
- Follow-Through Proof Layer
The panel now tracks how often a qualified planner event reaches its projected
target before invalidation, shown as a rate with sample size.
- Practical Target Room
A new Max Target Room (ATR) cap keeps projected targets at a usable distance from
price, even when the opposite range edge is far away.
- Cleaner Panel
The redundant Review row was replaced by the Follow-Through proof row, removing
duplicate workflow information.
- Honest Statistics
The proof layer is confirmed-bar gated, resolves same-bar target / invalidation
ambiguity conservatively, and uses a configurable follow-through window.
------------------------
Visual Improvements
------------------------
- Fixed oversized target-room readings on the panel and right-edge tag
- Reduced panel duplication for a clearer information flow
- Kept zones, labels and right-edge tags focused and readable
- Preserved the contrast-safe label and badge text styling
------------------------
Interface & Usability
------------------------
- Added a Follow-Through Window input for transparent proof tuning
- Added a Max Target Room (ATR) input for practical target framing
- Improved first-glance interpretation through the proof row
- Enhanced overall experience without changing the core planner logic
------------------------
Behavior Notes
------------------------
This update does not change how volatility spikes, stop-runs or expansions are
detected. The goal is added proof context and more practical targets. Outputs
should be interpreted the same way as before.
------------------------
Limitations Reminder
------------------------
The script remains a rule-based analytical tool. Volatility, liquidity and
timeframe differences can affect how events, zones and statistics appear. Always
interpret outputs within broader market context.
------------------------
Risk Reminder
------------------------
This script is for educational and analytical purposes only. It does not provide
financial advice or guaranteed trading outcomes. Users remain responsible for
their own decisions.
Release Note
Version 1.10 - Expanded Balanced ContextThis update adds one more compact historical reference to the default Balanced view while preserving the clean label hierarchy and candle-safe presentation.
• Increased Balanced zone history from three compact zones to four.
• Extended the visible stop-run narrative farther back on the chart without adding another full-size event label.
• Preserved compact quality text inside each zone so the additional context remains lightweight.
• Kept the latest ATR-offset event label and active right-edge workflow and target tags unchanged.
• Updated the Label Density tooltip to describe the richer Balanced visual history accurately.
• Preserved volatility scoring, event qualification, stop-run logic, alerts, panel behavior, and follow-through proof accounting without analytical changes.
สคริปต์แบบโอเพนซอร์ส
ด้วยเจตนารมณ์หลักของ TradingView ผู้สร้างสคริปต์นี้ได้ทำให้เป็นโอเพนซอร์ส เพื่อให้เทรดเดอร์สามารถตรวจสอบและยืนยันฟังก์ชันการทำงานของมันได้ ขอชื่นชมผู้เขียน! แม้ว่าคุณจะใช้งานได้ฟรี แต่โปรดจำไว้ว่าการเผยแพร่โค้ดซ้ำจะต้องเป็นไปตาม กฎระเบียบการใช้งาน ของเรา

🧠 Trading Suite - Flagship Workflow
tradingview.com/script/XJmX3p98-Trading-Suite-AGPro-Series/
🔷 Crypto Setup Planner - Multi-Symbol Planner
tradingview.com/script/LgVRo7Ql-Crypto-Setup-Planner-AGPro-Series/
tradingview.com/script/XJmX3p98-Trading-Suite-AGPro-Series/
🔷 Crypto Setup Planner - Multi-Symbol Planner
tradingview.com/script/LgVRo7Ql-Crypto-Setup-Planner-AGPro-Series/
คำจำกัดสิทธิ์ความรับผิดชอบ
ข้อมูลและบทความไม่ได้มีวัตถุประสงค์เพื่อก่อให้เกิดกิจกรรมทางการเงิน, การลงทุน, การซื้อขาย, ข้อเสนอแนะ หรือคำแนะนำประเภทอื่น ๆ ที่ให้หรือรับรองโดย TradingView อ่านเพิ่มเติมใน ข้อกำหนดการใช้งาน
สคริปต์แบบโอเพนซอร์ส
ด้วยเจตนารมณ์หลักของ TradingView ผู้สร้างสคริปต์นี้ได้ทำให้เป็นโอเพนซอร์ส เพื่อให้เทรดเดอร์สามารถตรวจสอบและยืนยันฟังก์ชันการทำงานของมันได้ ขอชื่นชมผู้เขียน! แม้ว่าคุณจะใช้งานได้ฟรี แต่โปรดจำไว้ว่าการเผยแพร่โค้ดซ้ำจะต้องเป็นไปตาม กฎระเบียบการใช้งาน ของเรา
🧠 Trading Suite - Flagship Workflow
tradingview.com/script/XJmX3p98-Trading-Suite-AGPro-Series/
🔷 Crypto Setup Planner - Multi-Symbol Planner
tradingview.com/script/LgVRo7Ql-Crypto-Setup-Planner-AGPro-Series/
tradingview.com/script/XJmX3p98-Trading-Suite-AGPro-Series/
🔷 Crypto Setup Planner - Multi-Symbol Planner
tradingview.com/script/LgVRo7Ql-Crypto-Setup-Planner-AGPro-Series/
คำจำกัดสิทธิ์ความรับผิดชอบ
ข้อมูลและบทความไม่ได้มีวัตถุประสงค์เพื่อก่อให้เกิดกิจกรรมทางการเงิน, การลงทุน, การซื้อขาย, ข้อเสนอแนะ หรือคำแนะนำประเภทอื่น ๆ ที่ให้หรือรับรองโดย TradingView อ่านเพิ่มเติมใน ข้อกำหนดการใช้งาน