Mag7 vs RSP Rotation Intensity Z-Score
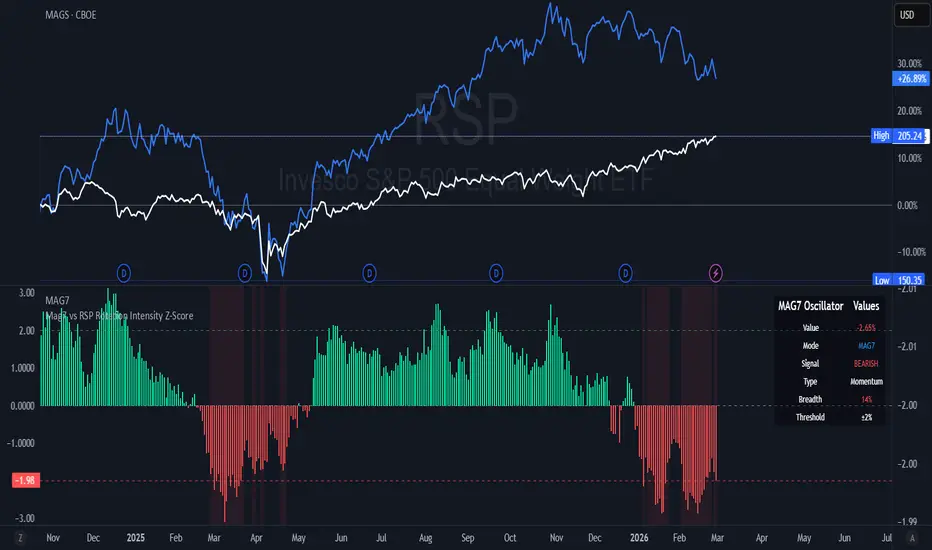
Calculates how extreme the current Mag7 underperformance is compared to the last 63 trading days (~3 months).
Formula (standard statistical Z-score): ratio = log(Mag7 price / RSP price)
mean = average of that ratio over the last 63 days
stdev = standard deviation of that ratio over the last 63 days
Z = (today’s ratio – mean) / stdev
Result plotted as colored columns (green = Mag7 outperforming, red = underperforming).
Horizontal lines at +2 and –2 mark the “extreme” zones.
Formula (standard statistical Z-score): ratio = log(Mag7 price / RSP price)
mean = average of that ratio over the last 63 days
stdev = standard deviation of that ratio over the last 63 days
Z = (today’s ratio – mean) / stdev
Result plotted as colored columns (green = Mag7 outperforming, red = underperforming).
Horizontal lines at +2 and –2 mark the “extreme” zones.

คำจำกัดสิทธิ์ความรับผิดชอบ
ข้อมูลและบทความไม่ได้มีวัตถุประสงค์เพื่อก่อให้เกิดกิจกรรมทางการเงิน, การลงทุน, การซื้อขาย, ข้อเสนอแนะ หรือคำแนะนำประเภทอื่น ๆ ที่ให้หรือรับรองโดย TradingView อ่านเพิ่มเติมใน ข้อกำหนดการใช้งาน
คำจำกัดสิทธิ์ความรับผิดชอบ
ข้อมูลและบทความไม่ได้มีวัตถุประสงค์เพื่อก่อให้เกิดกิจกรรมทางการเงิน, การลงทุน, การซื้อขาย, ข้อเสนอแนะ หรือคำแนะนำประเภทอื่น ๆ ที่ให้หรือรับรองโดย TradingView อ่านเพิ่มเติมใน ข้อกำหนดการใช้งาน