ที่อัปเดต:
Volume Quantile Profile [Drizzle_Algo56]
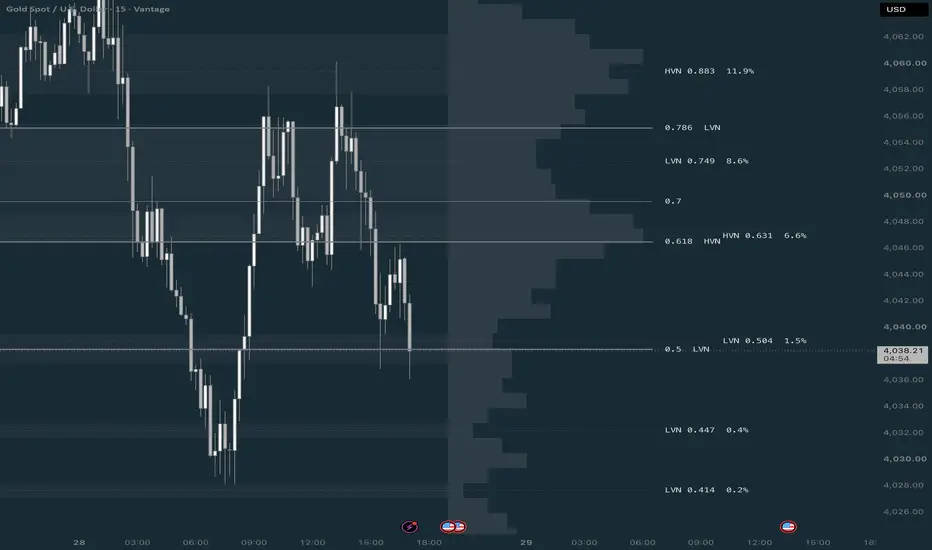
Volume Quantile Profile (VQP)
█ OVERVIEW
Volume Quantile Profile is a session based volume analysis framework that connects a selected price range, cumulative volume levels, and nested profiles in one chart overlay.
The main profile reveals how participation is distributed across your chosen range. Two nested profiles, N1 and N2, allow you to examine selected regions in greater detail, moving from the broader distribution into its internal structure.
█ HOW IT WORKS
⚪ The Price Lens
Two adjustable price anchors define the analysis range. VQP aggregates footprint row volume overlapping this range across a single session, several combined sessions, or all loaded chart history.
Only volume inside the selected price range contributes to the volume level calculations.
⚪ Volume Quantile Levels
VQP applies configurable ratios, including familiar Fibonacci values, to cumulative volume.
Starting from the selected upper or lower boundary, the indicator locates the price where each requested share of range volume has accumulated.
For example, 0.700 marks 70% of the volume inside the selected range, counted from the chosen side. It represents a volume quantile rather than a conventional price retracement or a value area calculated around the Point of Control.
The spacing between levels reflects the underlying volume distribution. Concentrated volume produces closely spaced quantiles, while regions containing less volume produce wider spacing.
⚪ Nested Profiles
N1 creates a local profile between two volume levels of the main profile.
N2 can examine another region of the main profile or a region within N1, supporting both parallel and cascading analysis.
Each nested profile measures its own volume as 100%. An N1 0.700 level therefore refers specifically to 70% of N1 volume. N2 can also use N1 as its mathematical parent while the N1 drawing is hidden.
Both nested profiles use a shared fine analysis grid aggregated directly from footprint rows. Their boundaries develop with their parent distribution.
⚪ Volume Zones and Profile Nodes
Two configurable ratio bands highlight selected portions of each profile’s volume distribution.
The main profile, N1 and N2 have independent zone visibility, fill colors and transparency. Nested histogram palettes and level colors are configured separately from zone fills.
The main profile also identifies qualifying low volume valleys and high volume peaks using adjustable smoothing, prominence and width filters. Detection can cover the entire price lens or focus near enabled volume levels.
Optional annotations distinguish levels inside a detected zone from levels merely near one. These annotations preserve the original volume level prices.
⚪ Session Timing
Chart session is the default reset mode. Each new trading session starts a fresh daily profile using the chart feed’s session boundaries.
Overnight sessions remain grouped by trading session. Premarket and postmarket activity is included when those bars are enabled on the chart.
An optional custom daily reset provides an hour, minute and exchange or IANA time zone. This creates consecutive daily windows without filtering trading hours. Candles crossing a custom reset are flagged rather than divided into estimated time segments.
⚪ Comparison Tools
Optional preceding session levels show how the distribution has shifted using the same price anchors and ratios.
A separate price and volume comparison overlays geometric Fibonacci levels. The P=V annotation identifies proximity between a price level and its corresponding volume level within the selected tolerance.
█ HOW TO USE
⚪ Define Your Range
Position the two price anchors around the area you want to study, then select the profile window and accumulation direction.
⚪ Examine the Distribution
Observe the spacing between volume levels and the location of qualifying volume nodes to understand where participation is concentrated or sparse.
⚪ Refine the Analysis
Define N1’s parent ratios and enable N2 when additional detail is useful. Customize the independent palettes, zone fills and labels to suit your chart.
⚪ Add Context
Compare preceding session levels or geometric Fibonacci levels to study changes in distribution and the relationship between price distance and accumulated volume.
█ DATA AND LIMITATIONS
VQP requires standard time based intraday candles and access to TradingView footprint data.
Resolution depends on the source footprint rows, analysis grid and loaded history. Volume is allocated proportionally within footprint rows, and level prices are interpolated within analysis bins. Additional nesting cannot create detail absent from the underlying data.
Developing levels and zones can change as volume arrives. Missing history or footprint coverage can produce incomplete profiles; default data checks hide affected profiles.
Results may differ from TradingView’s built in volume profiles because the data pipeline, selected price range and calculations differ.
VQP is a visual analysis indicator. It does not generate entry signals, alerts or backtest results. Proximity between levels does not establish a trading edge.
█ DISCLAIMER
For educational and informational purposes only. This indicator does not constitute investment advice or guarantee future results. Trading involves risk.
█ OVERVIEW
Volume Quantile Profile is a session based volume analysis framework that connects a selected price range, cumulative volume levels, and nested profiles in one chart overlay.
The main profile reveals how participation is distributed across your chosen range. Two nested profiles, N1 and N2, allow you to examine selected regions in greater detail, moving from the broader distribution into its internal structure.
█ HOW IT WORKS
⚪ The Price Lens
Two adjustable price anchors define the analysis range. VQP aggregates footprint row volume overlapping this range across a single session, several combined sessions, or all loaded chart history.
Only volume inside the selected price range contributes to the volume level calculations.
⚪ Volume Quantile Levels
VQP applies configurable ratios, including familiar Fibonacci values, to cumulative volume.
Starting from the selected upper or lower boundary, the indicator locates the price where each requested share of range volume has accumulated.
For example, 0.700 marks 70% of the volume inside the selected range, counted from the chosen side. It represents a volume quantile rather than a conventional price retracement or a value area calculated around the Point of Control.
The spacing between levels reflects the underlying volume distribution. Concentrated volume produces closely spaced quantiles, while regions containing less volume produce wider spacing.
⚪ Nested Profiles
N1 creates a local profile between two volume levels of the main profile.
N2 can examine another region of the main profile or a region within N1, supporting both parallel and cascading analysis.
Each nested profile measures its own volume as 100%. An N1 0.700 level therefore refers specifically to 70% of N1 volume. N2 can also use N1 as its mathematical parent while the N1 drawing is hidden.
Both nested profiles use a shared fine analysis grid aggregated directly from footprint rows. Their boundaries develop with their parent distribution.
⚪ Volume Zones and Profile Nodes
Two configurable ratio bands highlight selected portions of each profile’s volume distribution.
The main profile, N1 and N2 have independent zone visibility, fill colors and transparency. Nested histogram palettes and level colors are configured separately from zone fills.
The main profile also identifies qualifying low volume valleys and high volume peaks using adjustable smoothing, prominence and width filters. Detection can cover the entire price lens or focus near enabled volume levels.
Optional annotations distinguish levels inside a detected zone from levels merely near one. These annotations preserve the original volume level prices.
⚪ Session Timing
Chart session is the default reset mode. Each new trading session starts a fresh daily profile using the chart feed’s session boundaries.
Overnight sessions remain grouped by trading session. Premarket and postmarket activity is included when those bars are enabled on the chart.
An optional custom daily reset provides an hour, minute and exchange or IANA time zone. This creates consecutive daily windows without filtering trading hours. Candles crossing a custom reset are flagged rather than divided into estimated time segments.
⚪ Comparison Tools
Optional preceding session levels show how the distribution has shifted using the same price anchors and ratios.
A separate price and volume comparison overlays geometric Fibonacci levels. The P=V annotation identifies proximity between a price level and its corresponding volume level within the selected tolerance.
█ HOW TO USE
⚪ Define Your Range
Position the two price anchors around the area you want to study, then select the profile window and accumulation direction.
⚪ Examine the Distribution
Observe the spacing between volume levels and the location of qualifying volume nodes to understand where participation is concentrated or sparse.
⚪ Refine the Analysis
Define N1’s parent ratios and enable N2 when additional detail is useful. Customize the independent palettes, zone fills and labels to suit your chart.
⚪ Add Context
Compare preceding session levels or geometric Fibonacci levels to study changes in distribution and the relationship between price distance and accumulated volume.
█ DATA AND LIMITATIONS
VQP requires standard time based intraday candles and access to TradingView footprint data.
Resolution depends on the source footprint rows, analysis grid and loaded history. Volume is allocated proportionally within footprint rows, and level prices are interpolated within analysis bins. Additional nesting cannot create detail absent from the underlying data.
Developing levels and zones can change as volume arrives. Missing history or footprint coverage can produce incomplete profiles; default data checks hide affected profiles.
Results may differ from TradingView’s built in volume profiles because the data pipeline, selected price range and calculations differ.
VQP is a visual analysis indicator. It does not generate entry signals, alerts or backtest results. Proximity between levels does not establish a trading edge.
█ DISCLAIMER
For educational and informational purposes only. This indicator does not constitute investment advice or guarantee future results. Trading involves risk.
Release Note
updated defaults and better settings ui
คำจำกัดสิทธิ์ความรับผิดชอบ
ข้อมูลและบทความไม่ได้มีวัตถุประสงค์เพื่อก่อให้เกิดกิจกรรมทางการเงิน, การลงทุน, การซื้อขาย, ข้อเสนอแนะ หรือคำแนะนำประเภทอื่น ๆ ที่ให้หรือรับรองโดย TradingView อ่านเพิ่มเติมใน ข้อกำหนดการใช้งาน
คำจำกัดสิทธิ์ความรับผิดชอบ
ข้อมูลและบทความไม่ได้มีวัตถุประสงค์เพื่อก่อให้เกิดกิจกรรมทางการเงิน, การลงทุน, การซื้อขาย, ข้อเสนอแนะ หรือคำแนะนำประเภทอื่น ๆ ที่ให้หรือรับรองโดย TradingView อ่านเพิ่มเติมใน ข้อกำหนดการใช้งาน