ที่อัปเดต:
Market Fear Meter
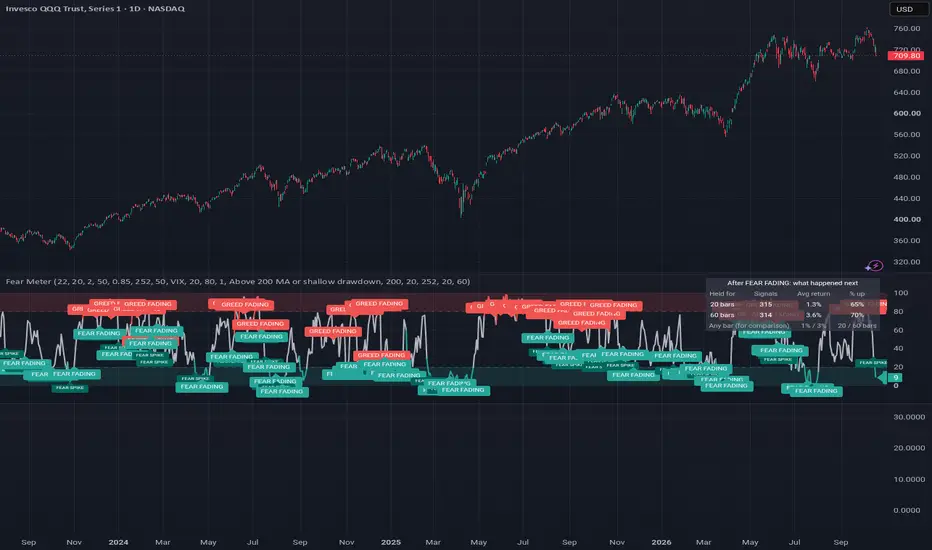
Market Fear Meter shows the market mood as one line from 0 to 100.
Low = fear. High = greed. It is built on the Williams VIX Fix.
HOW TO READ IT
- Green band at the bottom (0-20) = FEAR zone. Panic is high compared with the last year.
- Red band at the top (80-100) = GREED zone. The market is calm and stretched above its average.
- FEAR SPIKE (small dark green label): panic just started. These are the same bars the original Williams VIX Fix highlights.
- FEAR FADING (green label): panic is cooling and the trend filter is OK. This is the main "watch for a buy" moment.
- fear fading (filtered) (grey label): the same, but the trend is weak, so be careful.
- GREED FADING (red label at the top): the meter just left the greed zone. This is a caution sign, not a fear signal.
- "Now: ..." at the right edge shows today's reading in words.
- The table shows what happened after past FEAR FADING signals on this chart, next to "any bar" for comparison.
WHAT IS NEW COMPARED WITH THE ORIGINAL
The original script highlights Williams VIX Fix spikes with a histogram. This version keeps that calculation and its default settings, and adds:
1. A 0-100 fear/greed scale. The fear side ranks the Williams VIX Fix against the last 252 bars (optionally blended with the CBOE VIX on US index/ETF charts). The greed side ranks how far price is above its 50-bar average.
2. Text labels in plain words instead of colored bars.
3. A FEAR FADING signal: the spike has just ended, so panic is starting to cool.
4. An optional trend filter: FEAR FADING is kept only above the 200-bar average, or when the drop from the 1-year high is less than 20%. Removed signals stay visible in grey, so nothing is hidden.
5. A live status label.
6. A forward-return table: average move and % of times up after 20 and 60 bars, next to the same numbers for any bar. If the signal row is not better than the "any bar" row, the signal has no edge on that symbol.
7. Alerts: FEAR SPIKE, FEAR FADING, enters FEAR zone, GREED FADING.
SETTINGS
- Williams VIX Fix: lookback 22, Bollinger 20 / 2.0, percentile lookback 50 / 0.85 (original defaults).
- Ranking window: 252 bars (about one year on a daily chart).
- FEAR zone at or below 20, GREED zone at or above 80.
- Trend filter: Off / Above 200 MA / Above 200 MA or shallow drawdown (default).
- Labels on the meter, optional labels on the price chart, stats horizons 20 and 60 bars.
NOTES AND LIMITS
- Made for daily charts of broad indexes and ETFs.
- The meter ranks today against the past year. It does not predict what happens next.
- In real bear markets, fear can stay high for a long time and early signals can fail.
- The table uses close-to-close moves and ignores costs.
- No repainting: it uses closed bars on the chart timeframe and no lookahead. The live bar updates until it closes.
CREDIT
The Williams VIX Fix formula is by Larry Williams. The base code and spike logic come from the open-source "CM_Williams_Vix_Fix Finds Market Bottoms" by @ChrisMoody. Thank you to both. This is a Pine v6 rewrite with new features on top.
DISCLAIMER
For education only. This is not financial advice. Past results and backtests do not guarantee future results.
Low = fear. High = greed. It is built on the Williams VIX Fix.
HOW TO READ IT
- Green band at the bottom (0-20) = FEAR zone. Panic is high compared with the last year.
- Red band at the top (80-100) = GREED zone. The market is calm and stretched above its average.
- FEAR SPIKE (small dark green label): panic just started. These are the same bars the original Williams VIX Fix highlights.
- FEAR FADING (green label): panic is cooling and the trend filter is OK. This is the main "watch for a buy" moment.
- fear fading (filtered) (grey label): the same, but the trend is weak, so be careful.
- GREED FADING (red label at the top): the meter just left the greed zone. This is a caution sign, not a fear signal.
- "Now: ..." at the right edge shows today's reading in words.
- The table shows what happened after past FEAR FADING signals on this chart, next to "any bar" for comparison.
WHAT IS NEW COMPARED WITH THE ORIGINAL
The original script highlights Williams VIX Fix spikes with a histogram. This version keeps that calculation and its default settings, and adds:
1. A 0-100 fear/greed scale. The fear side ranks the Williams VIX Fix against the last 252 bars (optionally blended with the CBOE VIX on US index/ETF charts). The greed side ranks how far price is above its 50-bar average.
2. Text labels in plain words instead of colored bars.
3. A FEAR FADING signal: the spike has just ended, so panic is starting to cool.
4. An optional trend filter: FEAR FADING is kept only above the 200-bar average, or when the drop from the 1-year high is less than 20%. Removed signals stay visible in grey, so nothing is hidden.
5. A live status label.
6. A forward-return table: average move and % of times up after 20 and 60 bars, next to the same numbers for any bar. If the signal row is not better than the "any bar" row, the signal has no edge on that symbol.
7. Alerts: FEAR SPIKE, FEAR FADING, enters FEAR zone, GREED FADING.
SETTINGS
- Williams VIX Fix: lookback 22, Bollinger 20 / 2.0, percentile lookback 50 / 0.85 (original defaults).
- Ranking window: 252 bars (about one year on a daily chart).
- FEAR zone at or below 20, GREED zone at or above 80.
- Trend filter: Off / Above 200 MA / Above 200 MA or shallow drawdown (default).
- Labels on the meter, optional labels on the price chart, stats horizons 20 and 60 bars.
NOTES AND LIMITS
- Made for daily charts of broad indexes and ETFs.
- The meter ranks today against the past year. It does not predict what happens next.
- In real bear markets, fear can stay high for a long time and early signals can fail.
- The table uses close-to-close moves and ignores costs.
- No repainting: it uses closed bars on the chart timeframe and no lookahead. The live bar updates until it closes.
CREDIT
The Williams VIX Fix formula is by Larry Williams. The base code and spike logic come from the open-source "CM_Williams_Vix_Fix Finds Market Bottoms" by @ChrisMoody. Thank you to both. This is a Pine v6 rewrite with new features on top.
DISCLAIMER
For education only. This is not financial advice. Past results and backtests do not guarantee future results.
Release Note
v1.1- Fixed: FEAR FADING signals did not print, so the stats table showed 0 signals. The bars-since-spike count now updates on every bar, and signals and the table count the full chart history.
- Nothing else changed: same inputs, defaults, zones and alerts.
- Reminder: the table shows past results only. It is not a forecast and not financial advice.

คำจำกัดสิทธิ์ความรับผิดชอบ
ข้อมูลและบทความไม่ได้มีวัตถุประสงค์เพื่อก่อให้เกิดกิจกรรมทางการเงิน, การลงทุน, การซื้อขาย, ข้อเสนอแนะ หรือคำแนะนำประเภทอื่น ๆ ที่ให้หรือรับรองโดย TradingView อ่านเพิ่มเติมใน ข้อกำหนดการใช้งาน
คำจำกัดสิทธิ์ความรับผิดชอบ
ข้อมูลและบทความไม่ได้มีวัตถุประสงค์เพื่อก่อให้เกิดกิจกรรมทางการเงิน, การลงทุน, การซื้อขาย, ข้อเสนอแนะ หรือคำแนะนำประเภทอื่น ๆ ที่ให้หรือรับรองโดย TradingView อ่านเพิ่มเติมใน ข้อกำหนดการใช้งาน