Sweep Cancel Tracker [Zen]
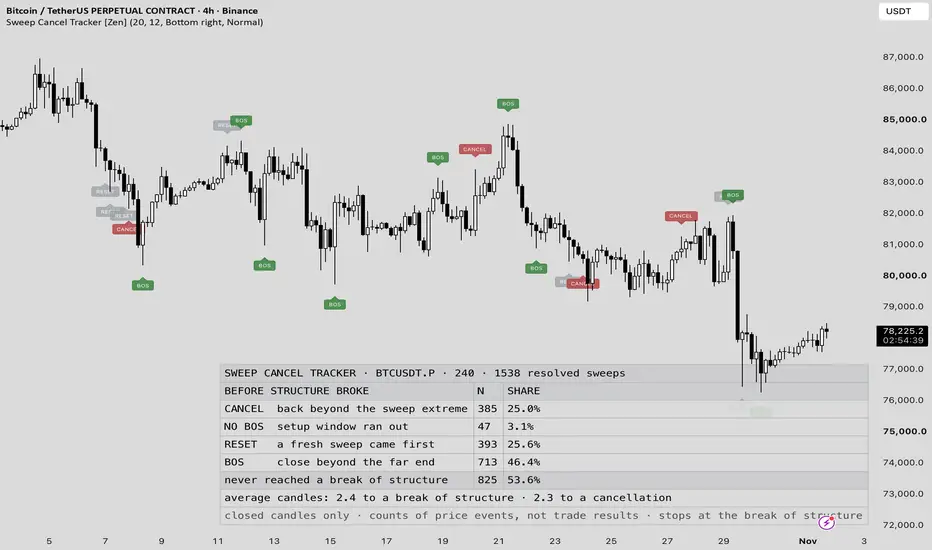
Sweep Cancel Tracker [Zen] answers one question about every liquidity sweep: did it ever produce a break of structure, or did it die first? Most sweep tools start their work at the break of structure. This one stops there. It watches the stretch between the sweep candle and the break, counts the four ways that stretch can end, and labels every one of them on the chart.
The outcome of each observation is one of four, and every sweep gets exactly one:
- CANCEL — price went back beyond the extreme of the sweep candle before structure broke.
- NO BOS — the setup window ran out with nothing decided.
- RESET — a fresh sweep arrived and replaced the one being watched.
- BOS — a candle closed beyond the far end of the sweep candle.
Nothing is dropped silently. A sweep that is replaced is counted as RESET rather than removed, so the four counts always add up to the number of resolved sweeps in the header.
WHAT IS DIFFERENT HERE
Pools and sweeps are standard building blocks, and the same 20-candle pool and the same sweep rule as in Sweep Target Hit [Zen] are used here. What this script adds is the part of the sweep that happens before the break of structure:
- the break of structure is the end of the observation, not its beginning, so the script reports how often a sweep never gets that far;
- the reasons a sweep ends are separated instead of being merged into one failure bucket: invalidation, timeout and replacement are counted apart from each other;
- the chart carries a label on every resolved sweep candle, so a count in the table can be traced back to the candle that produced it.
It is not a version of my other sweep scripts. Sweep Target Hit [Zen] measures whether price reaches the opposite pool after a sweep and knows nothing about a break of structure; this script stops at the break and never tracks the path to the pool, so the two describe different halves of the same sequence. Sweep Entry Zone [Zen] draws the sweep-candle wick as a zone after a break of structure and models no outcome. Liquidity Sweep Breadth [Zen] counts how many basket coins swept on one candle. Limit Ladder Planner [Zen] sizes orders from levels you set yourself. None of them counts what happened to a sweep before structure broke. This is a different question, not a claim that no other script anywhere asks it.
HOW IT WORKS
- Pool: the highest high and the lowest low of the 20 closed candles immediately before the sweep candle. The first candles of the chart have no pool and are skipped.
- Sweep: a closed candle whose wick goes beyond the pool and whose close comes back to or inside it. High sweep: the high is above the pool high and the close is at or below it. Low sweep: the low is below the pool low and the close is at or above it. A candle that takes out both pools at once is not treated as a sweep.
- Extreme: the high of the sweep candle after a high sweep, the low after a low sweep. This is the invalidation level.
- Far end: the opposite end of the same candle — its low after a high sweep, its high after a low sweep. A close beyond this level is the break of structure.
- Observation starts on the candle after the sweep candle. The sweep candle itself is never used to resolve its own observation.
- Every later closed candle is checked in this fixed order: (1) the candle goes beyond the extreme and is not itself a new sweep → CANCEL; (2) the candle closes beyond the far end → BOS; (3) the observation has reached the age limit set by Setup window → NO BOS; (4) the candle is itself a new sweep → RESET.
- Because invalidation is read before the break, a single candle that goes beyond the extreme and also closes beyond the far end is counted as CANCEL. Without intrabar data the order of the two events inside that candle is unknown, and the rule errs towards the sweep having failed.
- A candle that is itself a new sweep cannot cancel the open observation, but it can still close it as BOS if its close is beyond the far end.
- Only one sweep is watched at a time, and it is always the most recent one. There is no queue and no basket.
- Age is counted in closed candles from the sweep candle. With the default Setup window of 12, an observation lasts at most 12 closed candles.
- A sweep that is still open at the right edge of the chart has no outcome yet and is not counted anywhere.
- Everything is decided on closed candles of the chart symbol. The forming candle is not read and no other symbol or timeframe is requested. An outcome, once decided, is not revised: it was settled on closed candles, so the same loaded history gives the same labels and the same counts. What changes between sessions is the set of observations itself — a chart that loads a different number of candles contains a different number of sweeps, so the figures in the table move with the loaded history.
WHAT YOU SEE
- A label on each resolved sweep candle, above it after a high sweep and below it after a low sweep, reading CANCEL, NO BOS, RESET or BOS. The most recent 500 labels are kept; older ones disappear while the table keeps counting them.
- Outcome labels are created only after an observation has resolved. They are placed on the earlier sweep candle to show which sweep produced the outcome. This is retrospective visualisation, not a signal that was available on the sweep candle.
- A table with the ticker, the timeframe and the number of resolved sweeps in the header, then one row per outcome with its count and its share, a row for the three outcomes that never reached a break of structure, and a line with the average number of candles to a break and to a cancellation.
- The table describes the whole loaded history of the chart, not the visible range. Colours follow the chart background.
A DATED EXAMPLE, NOT A RULE OF THE MARKET
On BINANCE BTCUSDT.P, 4H, with the loaded history available on 1 November 2026 and the default settings, the script resolved 1538 sweeps: CANCEL 385 (25.0%), NO BOS 47 (3.1%), RESET 393 (25.6%), BOS 713 (46.4%). The three outcomes that never reached a break of structure came to 825, or 53.6%. The averages were 2.4 candles to a break of structure and 2.3 candles to a cancellation.
This is one symbol, one timeframe, one history window and one set of settings. It is not a market constant and it will not reproduce on your chart: the numbers move with the exchange, the symbol, the timeframe, the pool length, the setup window and how many candles your plan loads. Read your own chart rather than this paragraph.
RESET in particular should not be read as a failed sweep. It only means that a newer sweep arrived before the older one resolved, which on an active symbol happens often and says nothing about whether the older setup would have worked.
WHAT THESE NUMBERS ARE NOT
These are counts of price events, not trade results. No entry, no stop, no target and no position size is modelled anywhere in the script. A BOS share is not a win rate, a CANCEL share is not a loss rate, and none of these figures describes profit, loss or expectancy. Nothing here is a signal to buy or sell.
HOW THE COUNTS WERE CHECKED
The counting was written a second time, in a different form — without the running state machine, by locating the most recent sweep candle and replaying the window through historical offsets — and both versions were run on the same candles. Over the history they share, all four counts matched exactly: CANCEL 385, NO BOS 47, RESET 393, BOS 712, 1537 observations in total. The published build reports one break of structure more, 713 of 1538, because it begins counting earlier in the chart's history: the second version needs a longer warm-up before its first observation, and that one extra break falls inside the candles it cannot reach. The agreement is a check that the two implementations compute the same thing on the same candles. It is not evidence about other symbols, timeframes or exchanges.
INPUTS (defaults)
- Pool length (candles): 20, minimum 5
- Setup window (candles after sweep): 12, minimum 1, maximum 200
- Label every resolved sweep: on
- Summary table: on
- Table position: Bottom right
- Text size: Normal
LIMITS
- The table counts the loaded history only, so every figure depends on the timeframe and on how many candles your plan loads.
- Labels are capped at the most recent 500; the table is not.
- One symbol only. There is no multi-symbol mode and no alert in this script.
- Built for standard candles. Heikin Ashi, Renko and other synthetic charts change the prices the script reads and therefore its counts.
- The pool length and the setup window are both arbitrary choices. Changing either changes every number in the table, and neither value has been shown to be better than another.
Open source. Read the code, change the two model inputs, and check the counts against your own chart before relying on them.
Not financial advice.
The outcome of each observation is one of four, and every sweep gets exactly one:
- CANCEL — price went back beyond the extreme of the sweep candle before structure broke.
- NO BOS — the setup window ran out with nothing decided.
- RESET — a fresh sweep arrived and replaced the one being watched.
- BOS — a candle closed beyond the far end of the sweep candle.
Nothing is dropped silently. A sweep that is replaced is counted as RESET rather than removed, so the four counts always add up to the number of resolved sweeps in the header.
WHAT IS DIFFERENT HERE
Pools and sweeps are standard building blocks, and the same 20-candle pool and the same sweep rule as in Sweep Target Hit [Zen] are used here. What this script adds is the part of the sweep that happens before the break of structure:
- the break of structure is the end of the observation, not its beginning, so the script reports how often a sweep never gets that far;
- the reasons a sweep ends are separated instead of being merged into one failure bucket: invalidation, timeout and replacement are counted apart from each other;
- the chart carries a label on every resolved sweep candle, so a count in the table can be traced back to the candle that produced it.
It is not a version of my other sweep scripts. Sweep Target Hit [Zen] measures whether price reaches the opposite pool after a sweep and knows nothing about a break of structure; this script stops at the break and never tracks the path to the pool, so the two describe different halves of the same sequence. Sweep Entry Zone [Zen] draws the sweep-candle wick as a zone after a break of structure and models no outcome. Liquidity Sweep Breadth [Zen] counts how many basket coins swept on one candle. Limit Ladder Planner [Zen] sizes orders from levels you set yourself. None of them counts what happened to a sweep before structure broke. This is a different question, not a claim that no other script anywhere asks it.
HOW IT WORKS
- Pool: the highest high and the lowest low of the 20 closed candles immediately before the sweep candle. The first candles of the chart have no pool and are skipped.
- Sweep: a closed candle whose wick goes beyond the pool and whose close comes back to or inside it. High sweep: the high is above the pool high and the close is at or below it. Low sweep: the low is below the pool low and the close is at or above it. A candle that takes out both pools at once is not treated as a sweep.
- Extreme: the high of the sweep candle after a high sweep, the low after a low sweep. This is the invalidation level.
- Far end: the opposite end of the same candle — its low after a high sweep, its high after a low sweep. A close beyond this level is the break of structure.
- Observation starts on the candle after the sweep candle. The sweep candle itself is never used to resolve its own observation.
- Every later closed candle is checked in this fixed order: (1) the candle goes beyond the extreme and is not itself a new sweep → CANCEL; (2) the candle closes beyond the far end → BOS; (3) the observation has reached the age limit set by Setup window → NO BOS; (4) the candle is itself a new sweep → RESET.
- Because invalidation is read before the break, a single candle that goes beyond the extreme and also closes beyond the far end is counted as CANCEL. Without intrabar data the order of the two events inside that candle is unknown, and the rule errs towards the sweep having failed.
- A candle that is itself a new sweep cannot cancel the open observation, but it can still close it as BOS if its close is beyond the far end.
- Only one sweep is watched at a time, and it is always the most recent one. There is no queue and no basket.
- Age is counted in closed candles from the sweep candle. With the default Setup window of 12, an observation lasts at most 12 closed candles.
- A sweep that is still open at the right edge of the chart has no outcome yet and is not counted anywhere.
- Everything is decided on closed candles of the chart symbol. The forming candle is not read and no other symbol or timeframe is requested. An outcome, once decided, is not revised: it was settled on closed candles, so the same loaded history gives the same labels and the same counts. What changes between sessions is the set of observations itself — a chart that loads a different number of candles contains a different number of sweeps, so the figures in the table move with the loaded history.
WHAT YOU SEE
- A label on each resolved sweep candle, above it after a high sweep and below it after a low sweep, reading CANCEL, NO BOS, RESET or BOS. The most recent 500 labels are kept; older ones disappear while the table keeps counting them.
- Outcome labels are created only after an observation has resolved. They are placed on the earlier sweep candle to show which sweep produced the outcome. This is retrospective visualisation, not a signal that was available on the sweep candle.
- A table with the ticker, the timeframe and the number of resolved sweeps in the header, then one row per outcome with its count and its share, a row for the three outcomes that never reached a break of structure, and a line with the average number of candles to a break and to a cancellation.
- The table describes the whole loaded history of the chart, not the visible range. Colours follow the chart background.
A DATED EXAMPLE, NOT A RULE OF THE MARKET
On BINANCE BTCUSDT.P, 4H, with the loaded history available on 1 November 2026 and the default settings, the script resolved 1538 sweeps: CANCEL 385 (25.0%), NO BOS 47 (3.1%), RESET 393 (25.6%), BOS 713 (46.4%). The three outcomes that never reached a break of structure came to 825, or 53.6%. The averages were 2.4 candles to a break of structure and 2.3 candles to a cancellation.
This is one symbol, one timeframe, one history window and one set of settings. It is not a market constant and it will not reproduce on your chart: the numbers move with the exchange, the symbol, the timeframe, the pool length, the setup window and how many candles your plan loads. Read your own chart rather than this paragraph.
RESET in particular should not be read as a failed sweep. It only means that a newer sweep arrived before the older one resolved, which on an active symbol happens often and says nothing about whether the older setup would have worked.
WHAT THESE NUMBERS ARE NOT
These are counts of price events, not trade results. No entry, no stop, no target and no position size is modelled anywhere in the script. A BOS share is not a win rate, a CANCEL share is not a loss rate, and none of these figures describes profit, loss or expectancy. Nothing here is a signal to buy or sell.
HOW THE COUNTS WERE CHECKED
The counting was written a second time, in a different form — without the running state machine, by locating the most recent sweep candle and replaying the window through historical offsets — and both versions were run on the same candles. Over the history they share, all four counts matched exactly: CANCEL 385, NO BOS 47, RESET 393, BOS 712, 1537 observations in total. The published build reports one break of structure more, 713 of 1538, because it begins counting earlier in the chart's history: the second version needs a longer warm-up before its first observation, and that one extra break falls inside the candles it cannot reach. The agreement is a check that the two implementations compute the same thing on the same candles. It is not evidence about other symbols, timeframes or exchanges.
INPUTS (defaults)
- Pool length (candles): 20, minimum 5
- Setup window (candles after sweep): 12, minimum 1, maximum 200
- Label every resolved sweep: on
- Summary table: on
- Table position: Bottom right
- Text size: Normal
LIMITS
- The table counts the loaded history only, so every figure depends on the timeframe and on how many candles your plan loads.
- Labels are capped at the most recent 500; the table is not.
- One symbol only. There is no multi-symbol mode and no alert in this script.
- Built for standard candles. Heikin Ashi, Renko and other synthetic charts change the prices the script reads and therefore its counts.
- The pool length and the setup window are both arbitrary choices. Changing either changes every number in the table, and neither value has been shown to be better than another.
Open source. Read the code, change the two model inputs, and check the counts against your own chart before relying on them.
Not financial advice.

Open-source: Untouched Levels [Zen] → tradingview.com/script/9cwR0ZIw-Untouched-Levels-Zen/ | Free: Liquidity Zones [Zen] → tradingview.com/script/aSdm5wX3-Liquidity-Zones-Zen/
คำจำกัดสิทธิ์ความรับผิดชอบ
ข้อมูลและบทความไม่ได้มีวัตถุประสงค์เพื่อก่อให้เกิดกิจกรรมทางการเงิน, การลงทุน, การซื้อขาย, ข้อเสนอแนะ หรือคำแนะนำประเภทอื่น ๆ ที่ให้หรือรับรองโดย TradingView อ่านเพิ่มเติมใน ข้อกำหนดการใช้งาน
Open-source: Untouched Levels [Zen] → tradingview.com/script/9cwR0ZIw-Untouched-Levels-Zen/ | Free: Liquidity Zones [Zen] → tradingview.com/script/aSdm5wX3-Liquidity-Zones-Zen/
คำจำกัดสิทธิ์ความรับผิดชอบ
ข้อมูลและบทความไม่ได้มีวัตถุประสงค์เพื่อก่อให้เกิดกิจกรรมทางการเงิน, การลงทุน, การซื้อขาย, ข้อเสนอแนะ หรือคำแนะนำประเภทอื่น ๆ ที่ให้หรือรับรองโดย TradingView อ่านเพิ่มเติมใน ข้อกำหนดการใช้งาน