ที่อัปเดต:
Failed Break Quality [AGPro Series]
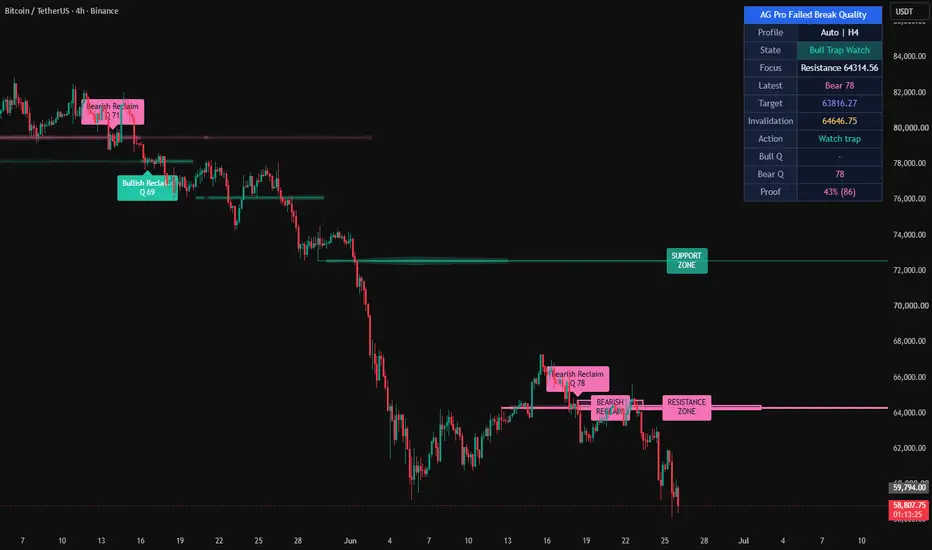
Failed Break Quality [AGPro Series]
🔹 OVERVIEW
Failed Break Quality is a reversal-focused structure tool that detects failed breakouts (bull traps and bear traps) around confirmed horizontal support and resistance, then grades each reclaim with a transparent 0-100 quality score. Instead of signaling every price wick through a level, it waits for the full sequence — level confirmation, break below or above, decisive reclaim, rejection candle and follow-through — and only prints a label when the event passes a weighted score threshold.
The goal is to give a single-pane view of where the market trapped participants, how clean the reversal was, and whether the reaction carried any real conviction. All components are plotted on the price chart in an event map style: reclaim pockets, focus bands, connector rails, structure tags and a compact summary panel.
🔷 UNIQUE EDGE
What separates Failed Break Quality from generic support-resistance or bull-trap detectors:
• Five-component weighted score (0-100) — each reclaim is rated on Level Integrity, Break Weakness, Reclaim Speed, Rejection Strength and Follow-Through, with user-adjustable weights. No black-box output.
• Auto timeframe profiles — Intraday, H4 and Swing profiles adapt tolerance, break depth, reclaim window, adverse-move limits and family-reset band automatically so the same inputs behave sensibly across timeframes.
• Reclaim Pockets — the actual zone between the break extreme and the reclaim level is drawn as a shaded rectangle, making it easy to see where the trap formed and where the invalidation sits.
• Focus Bands + Event Rails — the latest bull and bear events are highlighted with a forward-extended focus band at the level and a dashed rail connecting break extreme to reclaim point. Older events fade, so the current structural map stays readable.
• Family lock system — once a level produces a graded signal, it will not re-fire on the same level family until a new family forms beyond the configured reset band, preventing signal stacking on the same structure.
• Auto-clean stale event visuals — focus bands, reclaim pockets and event rails are automatically removed when their anchor level drifts, disappears or ages out, so the chart stays clean across regime shifts.
• This script differs from Break-Retest Quality (continuation after a confirmed breakout) by focusing on the opposite case: breakouts that fail and reverse back through the level.
🔸 METHODOLOGY
1. Level Building — Pivot highs and lows are clustered inside an ATR-scaled tolerance band. A level is confirmed only after reaching the required minimum touches and is retired when it exceeds the maximum age in bars. Each confirmed level carries a family ID so nearby re-confirmations do not create duplicate signals.
2. Failed Break Detection — A break is registered when price penetrates a confirmed level by at least the minimum break depth (ATR-based). The script then monitors the reclaim window (capped in bars) and records the break extreme and outside-closes count.
3. Reclaim Confirmation — A reclaim requires close back across the level plus a small ATR buffer. The bar that reclaims is graded for rejection strength using wick, body and close position.
4. Follow-Through Gate — After reclaim, price must extend at least the follow-through ATR in the favorable direction and must not exceed the maximum adverse ATR against the reclaim. Failing either gate cancels the signal.
5. Quality Score — Five sub-scores are combined with user weights to produce the final 0-100 score. Only reclaims at or above the minimum print threshold produce a labeled signal and a reclaim pocket.
🔶 SIGNALS AND ALERTS
• Bullish Reclaim — printed below the reclaim bar with a teal label showing the quality score. Indicates a failed breakdown of support.
• Bearish Reclaim — printed above the reclaim bar with a pink label showing the quality score. Indicates a failed breakout of resistance.
• Panel States — Bull Trap Watch, Bull Reclaim Pending, Bear Trap Watch, Bear Reclaim Pending, Scanning Levels, Building Levels.
• Alert Conditions — Bullish Reclaim and Bearish Reclaim, suitable for standard TradingView alert creation.
🔹 KEY INPUTS
• Levels — Pivot length, ATR length, level match tolerance (ATR), minimum touches, maximum level age.
• Profiles — Toggle for automatic timeframe calibration.
• Failed Break Logic — Minimum break depth, reclaim window, follow-through bars, reclaim buffer, minimum follow-through, maximum adverse move, re-arm distance, family reset band.
• Score — Minimum score to print and individual weights for Level, Break, Speed, Reject and Follow components.
• Visuals — Toggles for confirmed levels, level zones, inner core bands, structure tags, active-zone emphasis, tag connector rails, zone and core half-widths, signal offset, label and tag sizes.
• Event Map — Reclaim pockets, focus bands, event rails, non-focus fade, auto-clean stale event visuals, stale event max bars, pad and extend settings.
• Panel — Visibility, position (Top Right / Top Left / Bottom Right / Bottom Left) and font size.
🔷 HOW TO USE
• Start on the timeframe where the levels look most respected (H1, H4 or Daily). Auto profiles will adjust internal thresholds automatically.
• Treat every signal as contextual evidence, not as a standalone entry. Higher scores indicate cleaner events — a shallow break, a fast reclaim, a strong rejection bar and a clean follow-through all lift the score.
• Use the reclaim pocket as the structural zone: the level marks the invalidation side, and the break extreme marks the maximum trap depth. Both are visible on the chart.
• Combine with your own bias, trend filters, higher-timeframe levels, volume or session structure. The script is designed to sit on top of an existing framework, not replace it.
🔸 LIMITATIONS AND TRANSPARENCY
• This is an indicator, not a strategy. It does not place orders, size positions or calculate profit and loss.
• Signals are evaluated on bar close. Intrabar wicks can temporarily enter trap states without producing a graded event.
• Score thresholds and weights are tunable. Different markets and timeframes benefit from different configurations — the default values are a reasonable starting point, not a universal setting.
• All level, reclaim and pocket logic is purely structural and does not include volume, order flow or derivatives data.
• Repainting note — level confirmation uses pivots with a fixed lookback. The last pivot is locked once the required forward bars have elapsed; earlier plotted structure does not repaint after that point.
🔶 RISK DISCLOSURE
Trading involves substantial risk. This script is a technical analysis tool provided for educational and research purposes only and does not constitute financial advice, investment recommendations or a solicitation to trade. Past performance does not guarantee future results. Always do your own research and apply strict risk management. The author assumes no responsibility for trading decisions made using this script.
Published under Mozilla Public License 2.0 — source is open and available for study, review and non-commercial derivative work under the terms of the license.
🔹 OVERVIEW
Failed Break Quality is a reversal-focused structure tool that detects failed breakouts (bull traps and bear traps) around confirmed horizontal support and resistance, then grades each reclaim with a transparent 0-100 quality score. Instead of signaling every price wick through a level, it waits for the full sequence — level confirmation, break below or above, decisive reclaim, rejection candle and follow-through — and only prints a label when the event passes a weighted score threshold.
The goal is to give a single-pane view of where the market trapped participants, how clean the reversal was, and whether the reaction carried any real conviction. All components are plotted on the price chart in an event map style: reclaim pockets, focus bands, connector rails, structure tags and a compact summary panel.
🔷 UNIQUE EDGE
What separates Failed Break Quality from generic support-resistance or bull-trap detectors:
• Five-component weighted score (0-100) — each reclaim is rated on Level Integrity, Break Weakness, Reclaim Speed, Rejection Strength and Follow-Through, with user-adjustable weights. No black-box output.
• Auto timeframe profiles — Intraday, H4 and Swing profiles adapt tolerance, break depth, reclaim window, adverse-move limits and family-reset band automatically so the same inputs behave sensibly across timeframes.
• Reclaim Pockets — the actual zone between the break extreme and the reclaim level is drawn as a shaded rectangle, making it easy to see where the trap formed and where the invalidation sits.
• Focus Bands + Event Rails — the latest bull and bear events are highlighted with a forward-extended focus band at the level and a dashed rail connecting break extreme to reclaim point. Older events fade, so the current structural map stays readable.
• Family lock system — once a level produces a graded signal, it will not re-fire on the same level family until a new family forms beyond the configured reset band, preventing signal stacking on the same structure.
• Auto-clean stale event visuals — focus bands, reclaim pockets and event rails are automatically removed when their anchor level drifts, disappears or ages out, so the chart stays clean across regime shifts.
• This script differs from Break-Retest Quality (continuation after a confirmed breakout) by focusing on the opposite case: breakouts that fail and reverse back through the level.
🔸 METHODOLOGY
1. Level Building — Pivot highs and lows are clustered inside an ATR-scaled tolerance band. A level is confirmed only after reaching the required minimum touches and is retired when it exceeds the maximum age in bars. Each confirmed level carries a family ID so nearby re-confirmations do not create duplicate signals.
2. Failed Break Detection — A break is registered when price penetrates a confirmed level by at least the minimum break depth (ATR-based). The script then monitors the reclaim window (capped in bars) and records the break extreme and outside-closes count.
3. Reclaim Confirmation — A reclaim requires close back across the level plus a small ATR buffer. The bar that reclaims is graded for rejection strength using wick, body and close position.
4. Follow-Through Gate — After reclaim, price must extend at least the follow-through ATR in the favorable direction and must not exceed the maximum adverse ATR against the reclaim. Failing either gate cancels the signal.
5. Quality Score — Five sub-scores are combined with user weights to produce the final 0-100 score. Only reclaims at or above the minimum print threshold produce a labeled signal and a reclaim pocket.
🔶 SIGNALS AND ALERTS
• Bullish Reclaim — printed below the reclaim bar with a teal label showing the quality score. Indicates a failed breakdown of support.
• Bearish Reclaim — printed above the reclaim bar with a pink label showing the quality score. Indicates a failed breakout of resistance.
• Panel States — Bull Trap Watch, Bull Reclaim Pending, Bear Trap Watch, Bear Reclaim Pending, Scanning Levels, Building Levels.
• Alert Conditions — Bullish Reclaim and Bearish Reclaim, suitable for standard TradingView alert creation.
🔹 KEY INPUTS
• Levels — Pivot length, ATR length, level match tolerance (ATR), minimum touches, maximum level age.
• Profiles — Toggle for automatic timeframe calibration.
• Failed Break Logic — Minimum break depth, reclaim window, follow-through bars, reclaim buffer, minimum follow-through, maximum adverse move, re-arm distance, family reset band.
• Score — Minimum score to print and individual weights for Level, Break, Speed, Reject and Follow components.
• Visuals — Toggles for confirmed levels, level zones, inner core bands, structure tags, active-zone emphasis, tag connector rails, zone and core half-widths, signal offset, label and tag sizes.
• Event Map — Reclaim pockets, focus bands, event rails, non-focus fade, auto-clean stale event visuals, stale event max bars, pad and extend settings.
• Panel — Visibility, position (Top Right / Top Left / Bottom Right / Bottom Left) and font size.
🔷 HOW TO USE
• Start on the timeframe where the levels look most respected (H1, H4 or Daily). Auto profiles will adjust internal thresholds automatically.
• Treat every signal as contextual evidence, not as a standalone entry. Higher scores indicate cleaner events — a shallow break, a fast reclaim, a strong rejection bar and a clean follow-through all lift the score.
• Use the reclaim pocket as the structural zone: the level marks the invalidation side, and the break extreme marks the maximum trap depth. Both are visible on the chart.
• Combine with your own bias, trend filters, higher-timeframe levels, volume or session structure. The script is designed to sit on top of an existing framework, not replace it.
🔸 LIMITATIONS AND TRANSPARENCY
• This is an indicator, not a strategy. It does not place orders, size positions or calculate profit and loss.
• Signals are evaluated on bar close. Intrabar wicks can temporarily enter trap states without producing a graded event.
• Score thresholds and weights are tunable. Different markets and timeframes benefit from different configurations — the default values are a reasonable starting point, not a universal setting.
• All level, reclaim and pocket logic is purely structural and does not include volume, order flow or derivatives data.
• Repainting note — level confirmation uses pivots with a fixed lookback. The last pivot is locked once the required forward bars have elapsed; earlier plotted structure does not repaint after that point.
🔶 RISK DISCLOSURE
Trading involves substantial risk. This script is a technical analysis tool provided for educational and research purposes only and does not constitute financial advice, investment recommendations or a solicitation to trade. Past performance does not guarantee future results. Always do your own research and apply strict risk management. The author assumes no responsibility for trading decisions made using this script.
Published under Mozilla Public License 2.0 — source is open and available for study, review and non-commercial derivative work under the terms of the license.
Release Note
🔧 UPDATE NOTES - V1.8This update focuses on visual clarity, panel standardization, and publication polish.
The core purpose of the script remains unchanged.
This release improves how failed break, reclaim quality, confirmed zones, and event context are presented on the chart.
This script continues to function as an analytical and visualization tool.
It does not attempt to predict price direction or provide guaranteed outcomes.
------------------------
What Changed
------------------------
• Refined AGPro source header
The script header has been cleaned and aligned with the current AGPro Series format.
• Added centered zone badges
Confirmed support and resistance zones can now display separate centered badges for stronger first-glance readability.
• Added reclaim pocket badges
Latest reclaim pockets can now show separate centered badges without placing text inside box objects.
• Standardized panel controls
Panel location, theme, visibility, and font size controls have been expanded and aligned with current AGPro interface standards.
• Expanded size controls
Signal, structure, and panel text controls now support Tiny, Small, Normal, Large, and Huge options.
------------------------
Visual Improvements
------------------------
• Improved chart readability by adding clearer centered support, resistance, and reclaim context markers
• Refined visual hierarchy so confirmed zones, active focus, and latest reclaim events stand out more clearly
• Kept labels outside candle bodies where possible to preserve clean chart interpretation
• Preserved reclaim pockets, focus bands, rails, and confirmed level zones while improving their presentation
------------------------
Interface & Usability
------------------------
• Optimized panel behavior with live position updates
• Added Elite Dark, Slate, and Clean Light panel themes
• Preserved the single merged blue panel header row with the script name only
• Improved user control over visual density without changing the analytical engine
------------------------
Behavior Notes
------------------------
This update does not change the core analytical logic of the script.
The goal is to improve clarity and usability, not to introduce new predictive behavior.
Users should interpret outputs the same way as before, but with improved visual structure.
------------------------
Limitations Reminder
------------------------
The script remains a rule-based analytical tool.
Market conditions such as volatility, liquidity, and timeframe differences may affect how signals appear.
Outputs should always be interpreted within broader market context.
------------------------
Risk Reminder
------------------------
This script is for educational and analytical purposes only.
It does not provide financial advice or guaranteed trading outcomes.
Users remain responsible for their own decisions.
Release Note
🔧 UPDATE NOTES - v1.9This update focuses on turning the failed-break grade into a complete decision read.
The core purpose of the script remains unchanged.
This release adds a measured-move target, an invalidation edge, a clear next
action, and a stop-aware follow-through proof rate to the panel, and unifies
on-chart label contrast.
This script continues to function as an analytical and visualization tool.
It does not attempt to predict price direction or provide guaranteed outcomes.
------------------------
What Changed
------------------------
• Target row added
For the latest reclaim, the panel now projects a measured-move target from the
reclaimed level using the trap depth as 1R, scaled by a new "Target Projection R
Multiple" input. This is an informational reference, not a trade instruction.
• Invalidation row added
The panel now shows the trap extreme (the failed-break low for a bullish reclaim,
or the failed-break high for a bearish reclaim) as the level that, if closed back
through, marks the reclaim as failed.
• Action row added
A single next-step read: Watch trap, Wait reclaim, Review long, Review short,
Wait setup, or Build levels, derived from the current state and the latest event.
• Stop-aware Proof row added
On each printed reclaim, the planner measures from the reclaim bar close (the
actual decision point) whether price closed to a 1.5 ATR follow-through before
closing 1.0 ATR against it. Both sides are evaluated on confirmed closes so the
race stays fair, unresolved events time out without being counted, and the row
reads "Building (n)" until at least 6 samples exist, e.g. "54% (24)".
• Unified label contrast
Reclaim signal labels, zone badges, pocket badges, and structure tags now derive
their text color from the fill brightness, so every badge stays legible on both
bright and dark fills.
• Hardened ATR baseline
The ATR used for level tolerance, break depth, and spacing now falls back to true
range and a minimum tick on early or illiquid bars.
------------------------
Visual Improvements
------------------------
• Improved label readability by deriving text color from each badge fill
• Refined panel hierarchy so quality, target, invalidation, and action read top-down
• Kept existing zone, pocket, focus band, and rail visuals unchanged
------------------------
Interface & Usability
------------------------
• Panel now reads: Profile, State, Focus, Latest, Target, Invalidation, Action, Bull Q, Bear Q, Proof
• Grouped the decision read so quality and next step sit together
• Enhanced overall user experience without changing the core reclaim logic
------------------------
Behavior Notes
------------------------
This update does not change the core failed-break detection or scoring logic.
The Target is a projected reference, the Invalidation is a structural level, and
the Proof row is a historical, descriptive follow-through statistic measured on
confirmed closes. None of these are forecasts, win rates, or trade instructions,
and the proof rate is symbol- and timeframe-dependent.
Users should interpret outputs the same way as before, now with an added target,
invalidation, action, and follow-through context.
------------------------
Limitations Reminder
------------------------
The script remains a rule-based analytical tool.
Market conditions such as volatility, liquidity, and timeframe differences may
affect how reclaims, the target, and the proof rate appear.
Outputs should always be interpreted within broader market context.
------------------------
Risk Reminder
------------------------
This script is for educational and analytical purposes only.
It does not provide financial advice or guaranteed trading outcomes.
Users remain responsible for their own decisions.

Crypto Setup Planner: agprolabs.com/product/crypto-setup-planner/
Dynamic Channels Elite: agprolabs.com/product/dynamic-channels-elite/
Trading Suite: agprolabs.com/product/trading-suite-agpro-series/
Dynamic Channels Elite: agprolabs.com/product/dynamic-channels-elite/
Trading Suite: agprolabs.com/product/trading-suite-agpro-series/
คำจำกัดสิทธิ์ความรับผิดชอบ
ข้อมูลและบทความไม่ได้มีวัตถุประสงค์เพื่อก่อให้เกิดกิจกรรมทางการเงิน, การลงทุน, การซื้อขาย, ข้อเสนอแนะ หรือคำแนะนำประเภทอื่น ๆ ที่ให้หรือรับรองโดย TradingView อ่านเพิ่มเติมใน ข้อกำหนดการใช้งาน
Crypto Setup Planner: agprolabs.com/product/crypto-setup-planner/
Dynamic Channels Elite: agprolabs.com/product/dynamic-channels-elite/
Trading Suite: agprolabs.com/product/trading-suite-agpro-series/
Dynamic Channels Elite: agprolabs.com/product/dynamic-channels-elite/
Trading Suite: agprolabs.com/product/trading-suite-agpro-series/
คำจำกัดสิทธิ์ความรับผิดชอบ
ข้อมูลและบทความไม่ได้มีวัตถุประสงค์เพื่อก่อให้เกิดกิจกรรมทางการเงิน, การลงทุน, การซื้อขาย, ข้อเสนอแนะ หรือคำแนะนำประเภทอื่น ๆ ที่ให้หรือรับรองโดย TradingView อ่านเพิ่มเติมใน ข้อกำหนดการใช้งาน