VP/CD Active Relevance RadiusVolume Profile/Chip Ddistribution/Pressure Rails
The Volume Profile / Chip Distribution (VP/CD) indicator maps volume memory, price acceptance, overhead supply, downside memory, and low-volume transition areas across liquid large caps, volatile stocks, microcaps, gap-driven names, limited-history stocks, and multiple timeframes.
Current baseline: VP/CD v3.0 — M6A.3b. Its role is a market-memory and inventory-map evidence layer, answering key questions about accepted prices, volume memory, overhead supply, downside memory, low-acceptance zones, structural priority, and map reliability without providing automated buy/sell signals.
1. Pressure Rails
Calculates a Pressure Score for qualifying inventory levels and applies Pareto-style filtering to reduce clutter. Rail lengths reflect structural strength (longer rail = stronger surviving pressure structure).
2. Nearest UP and DN Pressure
Identifies nearest surviving pressure structures: UP (above price) and DN (below price). E.g., UP 174.19 | P26 indicates qualifying overhead pressure at 174.19 with a score of 26 (not an automatic resistance line).
3. Pressure Release — REL UP / REL DN
Marks REL UP or REL DN (e.g., REL UP 171.89 | P30) when price closes through a rail. This signifies inventory-pressure release in that direction rather than a guaranteed breakout or auto-entry.
4. Pareto Filtering
Evaluates candidate rails multi-dimensionally and eliminates dominated structures, reducing clutter while preserving key multi-factor historical levels.
5. Map Confidence
Classifies chart quality via environment states (High, Medium, Low, Event, Sparse) and numerical confidence scores. Accounts for structure variations between deep liquid assets versus IPOs, microcaps, gap events, or reverse splits.
6. Microstructure-Aware Calibration
Receives a profile from its companion adapter to categorize environments (Stable/Normal/Volatile Liquid, Limited Liquidity, Thin Stable, Thin Event-Driven, Gap Dominated, Limited History) to tune calculation conservativeness rather than direction.
7. Adaptive PM Evidence
Adjusts reaction counts based on market quality: stable liquid (3 reactions), thin stable (4 reactions), gap/event or limited history (5 reactions). Lower-quality structure requires stricter evidence.
8. Adaptive Event Sensitivity
Scales ATR sensitivity to shock candles based on market stability: stable (4.0 ATR), moderate instability (3.5 ATR), gap/event-driven (3.0 ATR) to avoid map contamination.
9. Adaptive Profile Resolution
Adapts Volume Profile rows to structure: highly liquid/gap-heavy uses finer rows (44 → 50), while thin stocks consolidate nearby inventory into coarser rows (44 → 34) for meaningful grouping.
10. Adaptive Profile Lookback
Modulates historical profile windows (e.g., stable stocks keep 252 days; gap/event-heavy use 189 days). Limited-history stocks retain full available history (252 days) but apply stricter confidence/resolution filters.
11. Adaptive Relevance Radius
Applies three historical relevance radii to prevent stale inventory from dominating: Normal (100%), Elevated Volatility (90%), Extreme/Erratic (80%).
12. Current Battle Map
Provides rapid visual identification of: Current Zone, Support Below, Resistance/Memory Above, AIR Path, Map Confidence, and Guard/Context warnings.
13. AIR / LVN Has a More Precise Meaning
AIR/LVN represents low-acceptance corridors (not direct support/resistance). Combines with Price Memory to form concepts like AIR+PM (thin volume with repeated price reactions).
14. Better Separation of Evidence
Separates distinct evidence categories: VP (traded volume), Chip Distribution (modeled cost basis), VP+Chip (confluence), PM (price memory), STRUCT (pivot memory), DEV (developing memory), and AIR (low-volume transitions).
15. Chip Distribution — Important Clarification
Chip Distribution estimates turnover migration over time. It is a model and does not track actual shareholder positions, tax lots, options exposure, or dark pool data.
16. Better Handling of Thin Stocks
Includes a Sparse Lower-Timeframe Current-Bar Fallback using current chart bar data if lower-timeframe data is missing, ensuring profile continuity without altering historical calculations.
17. Rail Endpoint Prices
Displays exact rail prices directly at the terminal end of each rail regardless of anchor orientation.
18. Cleaner REL Labels
Eliminates duplicate overlapping labels by prioritizing informative REL states over redundant nearest-level text.
19. Diagnostic Audit Improvements
Aligns Diagnostic audit ranking directly with production output: Candidate → Pressure Score filter → Pareto filtering → Surviving rails → Ranking → Displayed rails.
20. Multi-Timeframe Calibration
Scales baselines dynamically across timeframes (1D: 252d/44 rows; 2D: 504d/48 rows; 1W: 1825d/55 rows) to avoid stretched daily profiles.
What has NOT changed
VP/CD remains a structured evidence provider rather than an automatic buy/sell signal, entry trigger, or predictive guarantee.
How I use it
Recommended workflow: check Map Confidence → Current Zone → Support Below → Resistance Above → AIR Path → Pressure Rails → UP/DN → REL, then integrate with overall technical context.
Current Development Status
Baseline baseline VP/CD v3.0 — M6A.3b integrates Volume Profile, Chip Distribution, multi-layered memory, adaptive filters, and microstructure calibration into an analytical mapping framework.
อินดิเคเตอร์

Coasyn Sovereign Futures OICoasyn Sovereign Futures OI is a macro participation reference for FX traders.
The indicator automatically reads the base and quote currencies of the current FX pair, maps each currency to a related sovereign futures market, and then compares changes in daily open interest across two configurable lookback periods.
It is designed to help answer a simple question:
Is participation in the related sovereign futures market building, fading, or mixed?
How it works
The indicator reads the current FX pair automatically.
For example:
EUR/USD
The indicator maps:
EUR → Euro Bund futures
USD → US 10Y futures
It then requests the related daily open-interest series and measures the percentage change over:
a short lookback
a long lookback
The default settings are:
Short OI Change — 1 day
Long OI Change — 5 days
Both values are editable.
Reading the panel
The panel displays one row for the base currency and one row for the quote currency.
Each row includes:
Currency
The base or quote currency from the current FX pair.
Future
The sovereign futures market used as the participation reference.
OI
The latest available daily open-interest value.
Short / Long Change
The percentage change in open interest over the two configured lookback periods.
State
A simplified description of the current open-interest relationship.
State definitions
BUILDING
Open interest increased over both the short and long lookback periods.
This means participation is expanding in the referenced futures market.
It does not automatically mean the currency is bullish.
FADING
Open interest decreased over both lookback periods.
This means participation is contracting in the referenced futures market.
It does not automatically mean the currency is bearish.
MIXED
The short- and long-term open-interest changes disagree.
For example, short-term participation may be increasing while the longer lookback is still declining.
LIMITED
The required market exists, but there is not enough usable historical data to calculate both lookback changes.
NO OI DATA
A valid open-interest series is not currently available for the requested market.
The indicator returns N/A rather than creating or estimating missing data.
Supported currency mapping
The current version includes sovereign futures references for:
USD
EUR
GBP
AUD
CAD
JPY
CHF
CHF includes an alternate FX-futures open-interest source when the primary sovereign reference is unavailable.
Example interpretation
Suppose EUR/USD displays:
EUR — BUILDING
USD — FADING
This does not mean the indicator is telling the trader to buy EUR/USD.
It means participation in the selected EUR sovereign futures reference is expanding while participation in the USD reference is contracting over the configured lookback windows.
That information can then be combined with the trader's own macro, rates, price-action, and risk framework.
Panel controls
The panel can be positioned in:
Top Right
Top Left
Bottom Right
Bottom Left
The entire panel can also be disabled from the indicator settings.
Data availability
Coasyn Sovereign Futures OI requests futures open-interest data available through TradingView.
Availability can depend on:
exchange coverage
symbol availability
TradingView data permissions
the specific market being requested
If data is unavailable, the indicator displays N/A or NO OI DATA.
Important
This indicator does not provide:
buy or sell signals
currency direction forecasts
trade entries
targets
stop placement
position sizing
automated execution
Open interest measures participation, not direction.
The purpose of the tool is to provide another layer of sovereign-market context for traders working with FX pairs.
Built by Coasyn Market Systems. อินดิเคเตอร์

Coasyn Directional Order BlocksCoasyn Directional Order Blocks
Coasyn Directional Order Blocks identifies directional supply and demand zones created around market-structure breaks with displacement.
The indicator is designed to help traders visualize potential areas of prior institutional participation without turning those zones into automatic trade signals.
It tracks both:
Demand Order Blocks
Supply Order Blocks
Each block remains active until it is touched, invalidated, or removed according to the settings selected by the user.
How blocks are created
A new block requires two things:
1. A structure break
The indicator tracks recent swing highs and swing lows using the configured Structure Swing Length.
A demand block requires price to break above the most recent tracked swing high.
A supply block requires price to break below the most recent tracked swing low.
2. Displacement
The structure break must occur with a directional displacement candle.
The displacement filter uses:
ATR-relative candle range
minimum candle-body percentage
bullish direction for demand
bearish direction for supply
This helps prevent every minor structure break from automatically becoming an order block.
Origin candle
After a valid structure break, the indicator searches backward for the opposing candle that preceded the move.
For a Demand Block, it searches for a bearish candle.
For a Supply Block, it searches for a bullish candle.
The number of candles searched is controlled by:
Origin Candle Search
Order Block Zone
The Order Block Zone setting determines how much of the origin candle becomes the displayed zone.
Available options:
Full Candle
Uses the full high-to-low range of the origin candle.
Body
Uses only the candle body.
Refined
Uses a directional refinement of the candle range.
For demand, the refined zone uses the candle low through the top of the body.
For supply, the refined zone uses the bottom of the body through the candle high.
Block states
Each block begins as a fresh active zone.
The indicator then tracks whether price returns to the zone.
The Touched When setting controls when a block is considered touched.
Available options:
First Contact
The block becomes touched as soon as price reaches the outer edge of the zone.
50% Reached
Price must reach the midpoint of the order block.
Full Fill
Price must travel completely through the block to its opposite boundary.
Keeping touched blocks
Enable:
Keep Touched Blocks
to leave previously contacted blocks visible.
Touched blocks are displayed with increased transparency so they can be visually distinguished from fresh zones.
Disable this setting if you want a block removed after its first qualifying interaction.
Invalidation
The Invalidated When setting determines when a block is considered structurally broken.
Available options:
Close Beyond
A candle must close beyond the invalidation boundary.
Wick Beyond
Any wick through the invalidation boundary is sufficient.
For demand blocks, invalidation occurs below the zone.
For supply blocks, invalidation occurs above the zone.
Keeping invalidated blocks
Enable:
Keep Invalidated Blocks
if you want failed blocks to remain visible for review.
Invalidated blocks are converted to a neutral gray appearance and stop extending forward.
When disabled, invalidated blocks are removed from the chart.
Maximum active blocks
Maximum Active Blocks per Direction controls how many demand and supply zones can remain active at once.
Older blocks are removed automatically when the configured maximum is exceeded.
Demand and supply limits are tracked independently.
Forward projection
Forward Projection determines how far active order blocks extend to the right of the chart.
The zone continues updating forward while it remains active.
50% midline
Enable:
Show 50% Line
to display the midpoint of each order block.
This provides a visual reference for traders who use partial mitigation or midpoint interaction as part of their own process.
Structure break markers
Enable:
Show Structure Break Marker
to mark the candle where a valid displacement-driven structure break created a new order block.
These markers are optional and are disabled by default.
Labels
Enable:
Show Demand / Supply Label
to display the directional identity of each block directly inside the zone.
Colors
Demand and supply colors are fully configurable.
Users can also adjust:
fresh-block transparency
touched-block transparency
invalidated-block color
Alerts
The indicator includes alert conditions for:
New Demand Order Block
New Supply Order Block
Demand Order Block Entered
Supply Order Block Entered
Demand Order Block Invalidated
Supply Order Block Invalidated
Alerts must still be configured by the user through TradingView's alert system.
Example workflow
A trader may use the indicator to identify a demand zone created after a strong bullish displacement through prior structure.
The trader can then observe whether price:
remains away from the block → returns to the block → reaches the selected touch threshold → holds or invalidates
The indicator reports the state of the zone.
It does not determine whether the trader should enter.
Important
Coasyn Directional Order Blocks is a market-structure visualization tool.
It does not provide:
automatic entries
buy or sell recommendations
targets
stop placement
position sizing
automated execution
Order blocks should be interpreted within the trader's own market structure, risk, and strategy framework.
A displayed block is a reference zone, not a guarantee of future support, resistance, reversal, or continuation.
Built by Coasyn Market Systems. อินดิเคเตอร์

Stryk: Truth Line# Stryk: Truth Line — publish description (TradingView House Rules compliant)
> Paste into the script description. No performance figures, no win rates, no links, no promotional language. Estimates and repaint behaviour are disclosed explicitly.
---
**Stryk: Truth Line** is a participation-weighted adaptive line with a delta-vs-price verdict engine. It answers one question per bar: is this move being paid for?
## What it does
**The line.** A price follower whose follow-speed is set by "fuel" — how much participation is behind the current bar, weighted by whether true delta agrees with the bar's direction. Moves the market pays for pull the line along (coloured by direction). Moves nobody pays for leave the line behind (neutral colour) and the space between price and the line is shaded toward the fade side: bear colour above the line for a rally on thin participation, bull colour below the line for a sell-off on thin participation.
Participation is scored as a bell, not a ramp: fuel peaks in the mid band and falls off toward both the thin band and the climax band, with an additional decay once participation is inside the climax band. Only the mid band counts as a paid move. The line's colour follows its own slope on paid bars (bull colour rising, bear colour falling) and the neutral colour on unpaid bars.
**The verdict.** Delta is accumulated per candle of a user-chosen delta timeframe (default 60 minutes). The last three candles' net delta and price change feed one of five states:
- **ABSORPTION ▲ / ▼** — outsized net delta on one side while price refuses to follow it. Highest priority.
- **BUYERS / SELLERS** — three consecutive candles of meaningful delta on one side with price agreeing.
- **CONSOLIDATE** — three candles of small delta.
- **MIXED** — anything else; no read.
All thresholds are multiples of the recent average |Δ|, so the same settings apply across instruments without retuning. The confirmed verdict updates on delta-timeframe candle close; the live row updates intrabar and is labelled as such.
**Signals** (each individually toggleable):
- **FADE △ / ▽** — unpaid gap beyond an ATR threshold with participation in the thin band.
- **CLIMAX ⊗** — participation in the climax band while the line is still being paid in that direction. A warning, not an entry.
- **DIVERGE ◇** — on delta-timeframe close, price moved but delta was small. Footprint data only.
- **LINE FLIP ▲ / ▼** — price closes through the line beyond a hysteresis distance on a paid bar with delta agreeing. Confirmation is selectable: instantly on the crossing bar when it has conviction (outsized delta in the mid participation band), after holding N chart bars, or at the next delta-timeframe close. Unconfirmed flips print a faint provisional glyph that is removed if the flip fails.
- **BUY / SELL ●** — regime-gated confluence: confirmed line flip, verdict regime allowing that side, participation in the mid band at the flip, and (optionally) price on the agreeing side of the rolling VWAP. Does not fire under MIXED or CONSOLIDATE.
**Candle paint.** Every candle can be coloured by the same quantity that moves the line: sign from the bar's delta, intensity from fuel, so a paid bar shows bull/bear colour from its first ticks and an unpaid bar fades to neutral. Stryk: ΔC's delta-size and delta-% paint modes, driven by the live delta-timeframe candle, are also available, as is a participation-band mode.
**The display box.** Delta for the chart bar; live delta-timeframe delta with its buy/sell split; participation value and band; line state with the gap in points and ATRs; the last signal and how many bars ago; a three-candle delta memory (magnitude blocks, net delta, price change, and a ✓/✗ mark for whether delta and price agreed); the live verdict with its reasoning line; and the confirmed verdict with the regime it allows. Vertical layout for desktop with per-row toggles; Mobile layout is a compact five-row summary.
Also included: rolling VWAP over the lookback window with ±1/2/3σ bands, a background tint by participation band, and one JSON-formatted alert per event (FADE, CLIMAX, DIVERGE, confirmed LINE FLIP, BUY, SELL, verdict changed, ABSORPTION set, gap closed) for external logging.
## Delta source — read this
Where TradingView provides volume footprint data for the bar, the script uses real bid/ask buy and sell volume from `request.footprint()`. Footprint data availability depends on your TradingView plan and on the symbol; where it is not available the script falls back to an **estimate** of delta derived from lower-timeframe bar polarity. Estimated delta is not order-flow data and can differ materially from true delta. The display box header shows which source is active on the current bar (`ftp` with the share of recent bars that had footprint data, `est` with the intrabar resolution, or `est bar` when the intrabar budget is exhausted and only whole-bar polarity remains). Because footprint delta and estimated delta differ in magnitude, the average |Δ| that calibrates the verdict thresholds is computed only over candles sharing the current bar's source; when the three-candle memory straddles a source boundary the box says so and BUY/SELL are suppressed. The DIVERGE signal and the delta-agreement term in fuel are disabled on the estimate path because polarity-derived delta cannot disagree with price.
## Data entitlement — futures
The footprint is built from TradingView's own tick feed. A broker data subscription (for example CME data through a futures broker) does not make TradingView's chart real-time. If the chart shows a "Delayed" chip next to the symbol, the live delta, the live verdict and every alert are delayed by the same amount. Real-time exchange data is a separate TradingView entitlement.
Footprint availability also depends on plan tier. Behaviour on plans without footprint access is not something this script can detect at compile time; if the script does not load on your plan, use the estimate-only build.
## Repainting and confirmation
- The live delta, live verdict row, the line itself and the gap shading update on every tick by design. The line includes an optional fuel-weighted lag-compensation term, clipped so it never overshoots the close.
- **Signal timing** input: *Bar close* (default) evaluates every signal and alert on confirmed bars only — non-repainting, one chart bar of delay. *Intrabar* prints and alerts as soon as a condition is true on the forming bar; a glyph printed intrabar stays even if the bar closes without the condition. Intrabar mode repaints and is labelled as such.
- The BUY/SELL regime can come from the live verdict once it has held a set number of bars (default) or only from the delta-timeframe-close verdict.
- Unconfirmed LINE FLIP glyphs are removed if the flip fails its confirmation rule.
## How to use
1. Put it on an intraday chart of a liquid futures contract or index ETF. Defaults assume a 5-minute chart with a 60-minute delta timeframe.
2. Check the box header: `ftp` means true delta is active; `est` means you are on the estimate path.
3. Scale **Flat tolerance (ticks)** with your delta timeframe and instrument (default 24 ticks suits NQ 60-minute).
4. Participation is ranked against the same session's own history by default (Asia / London / New York windows, fixed internally) so overnight tape is not permanently scored thin; switch to Rolling if you prefer a plain lookback.
5. Use section 0 (Master Switches) to run lean — the engine keeps computing for the box and alerts even with the line hidden.
6. For alerts, create one alert on the indicator with "Any alert() function call". Every enabled event arrives as a JSON object containing the signal, direction, verdict, regime, participation band and value, gap in ATRs, delta source, timeframes, price and time — enough to log every event externally and score it later against what price did.
## What it is not
It is not a trading system and makes no prediction. It reports whether participation and delta supported a move and lets you decide what that means in context. Every reading can be wrong; slow low-volume drift can persist for hours without a paid move, which is why the gap threshold is a user input rather than a fixed rule.
## Settings
Every input has a tooltip describing what it does and why the default is what it is. อินดิเคเตอร์

AntiVestor - Top 'n Tail ZonesAntiVestor - Top 'n Tail Zones
Top 'n Tail Zones is a utility for marking fixed levels and shaded zones on any chart or pane that moves on a stable numeric scale — market breadth readings, percentage-above-moving-average lines, or any bounded oscillator. It tops and tails the range: an upper extreme zone, a lower extreme zone, and a neutral middle, all set by you.
You pick a scale preset or enter the levels yourself; it paints the zones, three reference lines and four labels, and holds them across the chart.
It calculates nothing. There is no signal, no reading of price, no alert. Every level on screen is a number you chose.
WHAT IT DRAWS
An upper zone, bounded by two levels. Labelled "Bullish Extreme" by default.
A lower zone, labelled "Bearish Extreme".
A middle zone between an upper and lower boundary, labelled as the neutral or chop area. If you set its upper and lower bounds to the same number, it collapses to a single midpoint line rather than a zero-height box.
Dashed reference lines at the middle-zone boundaries, and an optional solid line at zero.
Four labels floating to the right of the last bar, so the zones stay identified when you are scrolled in.
All levels and all six colours are adjustable. The zones extend back to the first loaded bar and forward by a configurable number of bars.
WHAT IT IS FOR
Anything that oscillates inside a range you already know the shape of:
Market breadth symbols such as advance-decline differences, where the useful information is how far into an extreme the reading has gone rather than the number itself.
Percentage-of-stocks-above-moving-average readings, which live on a 0-100 scale where the top and bottom bands are the interesting parts.
Any bounded oscillator, where you want a shaded band rather than a pair of thin lines.
The intended pattern is a top zone, a bottom zone and a neutral middle, so that a glance tells you which part of the range you are in.
HOW TO APPLY IT
Two routes, depending on what you are zoning.
1. Chart the instrument directly and add the script. It draws on that instrument's own scale.
2. Add the script, then drag it into the pane of the oscillator you want to zone. It picks up that pane's scale.
Then pick a preset.
ADD / Breadth sets levels suited to an advance-decline reading in the low thousands.
Percentage (0-100) sets the top and bottom tenth as the extreme zones and marks 50 as the midpoint — for percentage-above-moving-average readings and bounded oscillators.
Custom hands control to the six level inputs, which is where you go for any scale the two presets do not fit.
A NOTE ON THE DEFAULT COLOURS
The upper zone defaults to red and the lower to green, which is the opposite of what you might expect. That is deliberate: on a mean-reversion scale the top of the range is where you become cautious, not enthusiastic. If you read the scale the other way, both are colour inputs.
LIMITATIONS
Nothing here adapts. The presets are fixed sets of numbers and the custom levels are static. Nothing recalculates, rescales or follows the instrument — change scale and you change the preset or re-enter the levels yourself.
Zones begin at the first bar loaded in your chart's history, not at the true start of the instrument.
The zone labels are fixed text. "Bullish Extreme" and "Bearish Extreme" will not match every scale you might apply this to.
No alerts, no signals, no directional output of any kind. Because nothing is computed from price, nothing repaints, but equally nothing is confirmed either.
On a standard price chart the preset levels are far from price and the zones will be invisible. That is expected — switch to Custom and enter levels that suit the instrument.
This is a drawing utility, not an analysis tool. It does not tell you anything you did not already decide. Nothing here is financial advice. อินดิเคเตอร์

Seller Exhaustion DetectorSeller Exhaustion Detector (SED)
Overview
Seller Exhaustion Detector identifies the point where a downtrend's selling pressure is spent and buyers begin absorbing supply — the transition from distribution to accumulation. Instead of reacting to a single pattern, it scores seven independent exhaustion footprints and only confirms a signal when structural gates prove the low is actually holding.
How It Works
The detector scores confluence across a 16-point scale:
Liquidity Sweep + Reclaim (3 pts) — tracks untapped pivot-low liquidity pools; a wick below a pool followed by a close back above it marks a stop run absorbed by passive buyers.
CVD Bullish Divergence (3 pts) — price makes a lower low while session-reset cumulative volume delta makes a higher low: sell orders are no longer moving price.
RSI Bullish Divergence (2 pts) — momentum fails to confirm the new price low.
Sell-Volume Dry-Up (2 pts) — red-candle volume contracts near the lows; motivated sellers are done.
Absorption (2 pts) — elevated volume, compressed range, close in the upper half: supply being eaten without downside progress.
Higher Low (2 pts) — first structural higher pivot after the low.
Selling Climax Watch (1 pt) and Confirmed Wick Rejection (1 pt) — capitulation context and next-bar-confirmed hammer rejections.
A score alone never fires a signal. Three hard gates must also pass: the low must have held for a configurable number of bars (or a fresh sweep-reclaim substitutes as confirmation), price must be above a rising/flat EMA9, and fast volume delta must be positive. This eliminates premature signals printed while price is still making new lows.
Signals
Orange circle — selling climax (capitulation bar; watch window begins)
Gold diamond — liquidity pool swept and reclaimed
EXHAUSTION label — confirmed exhaustion (score + all gates)
ACCUMULATE label — post-exhaustion structure reclaim with positive delta
STOP-OUT label — the exhaustion low broke; the signal is invalid
Dashboard — live score breakdown and gate status, with selectable text size
Recommended Use
Built for 1-minute to 5-minute intraday charts on liquid symbols. Use EXHAUSTION as location, ACCUMULATE as trigger, and the invalidation print as a hard exit reference. Tune Climax Multiplier down (~1.7) and Pivot Left/Right to 3–4 for faster symbols.
Limitations
Volume delta is approximated from candle direction (up-volume minus down-volume), not exchange bid/ask data, so absorption and CVD reads are estimates. All components are derived from OHLCV and confirm after the fact by design — the detector locates high-probability reversal conditions; it does not predict bottoms. Not financial advice. อินดิเคเตอร์

อินดิเคเตอร์

Momentum Squeeze Breakout EngineDescription
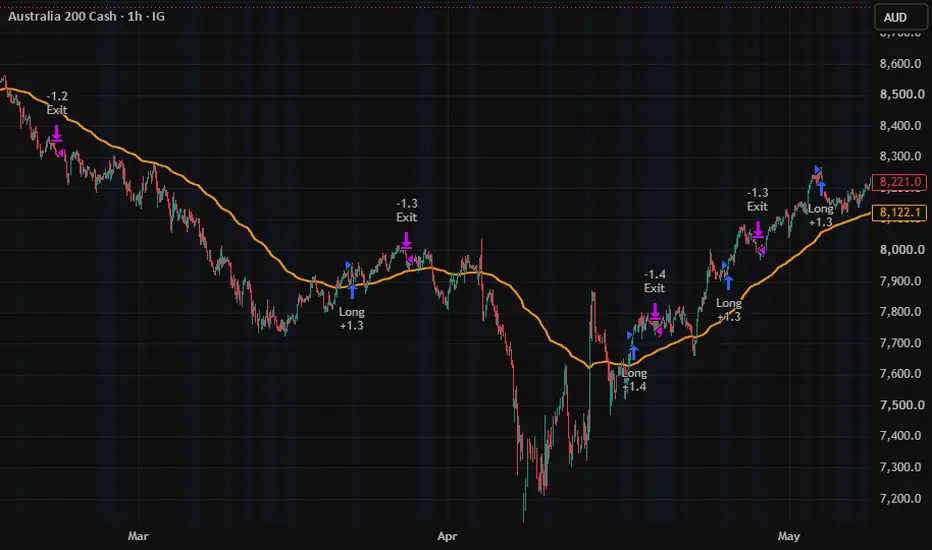
*Momentum Squeeze Breakout Engine* is a quantitative, trend-following breakout strategy engineered to capture explosive directional moves emerging from periods of asset compression (squeezes). By combining precise volatility boundaries, structural market sentiment filters, and micro-momentum triggers, this strategy systematically avoids false breakouts.
### Core Mechanics & Features
1. Volatility Squeeze Identification
The foundation of this strategy relies on the relationship between *Bollinger Bands* and *Keltner Channels. When the Bollinger Bands contract *inside the Keltner Channels, it confirms a highly compressed, low-volatility environment (highlighted by the subtle blue background zones). This indicates stored market energy primed for release.
2. Rigid Structural Macro Filter (200 EMA)
To eliminate counter-trend traps, the strategy utilizes a strict 200-period Exponential Moving Average (EMA) as a macro baseline. Long entries are strictly prohibited if the asset is printing below this line, ensuring you only trade high-probability expansions aligned with the dominant institutional trend.
3. Holistic Intra-Bar Bias
Rather than relying purely on close prices, the script calculates an internal *Holistic Bias* engine. It evaluates where the close falls relative to each bar's high-low range over a specific structural lookback period. A valid breakout requires a positive cumulative sentiment bias (cumBias > 0), ensuring authentic accumulation is taking place.
4. Micro-Momentum (Rate of Change) Filter
To prevent entering "slow drift" scenarios or low-volume fakeouts, a 3-period Rate of Change (ROC) velocity check is integrated. A breakout will only trigger an entry if the price action demonstrates immediate expanding velocity (priceROC > 0).
# Execution Rules
* *BUY Signal:* Generated when a compression zone has broken out within the last 3 bars, the price crosses above the Upper Bollinger Band, the macro trend is bullish (Price > 200 EMA), holistic bias is positive, and positive momentum velocity is confirmed.
* *EXIT Signal:* Generated when the price crosses below the Lower Bollinger Band following a squeeze or when the holistic bias shifts negatively, functioning as a structural trailing mechanism.
* *Signal Spacing:* Features a built-in 15-bar cooldown rule to prevent over-trading and signal clustering within volatile consolidation nodes.
### Best Practices
* *Intended Timeframe:* Optimized for the *1-Hour (1H)* chart.
* *Assets:* Best suited for high-liquidity assets including Major Crypto Pairs (BTC, ETH), Blue- Chip Equities, Indices and Major Forex Pairs.
* *Risk Management:* Default settings utilize a 100% equity allocation model for raw backtesting transparency, but traders should scale their position sizes according to their personal risk tolerances.
### Disclaimer
*Financial and Trading Risk Warning:*
This script is an educational and analytical tool designed to demonstrate quantitative breakout concepts using historical data. It is published as an open-source resource for informational purposes only and does not constitute financial, investment, or trading advice.
Past performance is not indicative of future results. Market conditions change constantly, and systematic strategies can experience significant drawdowns. Automated trading involves substantial risk of capital loss. Never trade with money you cannot afford to lose. The author assumes no liability or responsibility for any financial losses incurred from the use or modification of this code. Always perform your own independent research and forward-test on a demo account before risking live capital. กลยุทธ์

อินดิเคเตอร์

Multi-TF Overlapping FVGThis indicator automatically detects Fair Value Gaps (FVGs) across multiple timeframes and identifies high‑confluence overlap zones known as clusters. These clusters highlight areas of institutional imbalance where price often reacts with precision. The tool continuously tracks FVGs from 1m, 5m, 10m, 15m, 30m, and 60m charts, dynamically forming and updating clusters as new gaps appear or become mitigated.
Key Features
Multi‑Timeframe FVG Detection
Scans up to six timeframes for bullish and bearish FVGs in real time.
Cluster Formation Logic
Builds a cluster when a 1‑minute FVG aligns with enough higher‑timeframe gaps, creating a strong confluence zone.
Dynamic Filtering System
Allows filtering clusters by time decay, price proximity, ATR‑based distance, or edge‑proximity wake‑up logic.
Mitigation Tracking
Monitors each FVG for partial or full mitigation using wick or close logic. Clusters update or expire automatically.
Exclusivity and Consumption Options
Controls whether higher‑timeframe FVGs can be reused by multiple 1m seeds or permanently consumed.
Adaptive Rendering
Boxes extend dynamically, labels update automatically, and clusters remain visible briefly after mitigation for clarity.
Debug Panel
Displays real‑time counts of FVGs per timeframe and active clusters for verification and troubleshooting.
How to Use This Indicator
Identify High‑Probability Zones
Clusters represent areas where multiple timeframes agree on imbalance, often acting as strong support, resistance, or liquidity targets.
Monitor Mitigation Behavior
Observe how price interacts with cluster edges. Partial fills, full fills, and rejections can signal continuation or reversal.
Integrate With Your Strategy
Use clusters as entry zones, take‑profit targets, stop‑loss buffers, or directional confirmation.
Adjust Filters to Match Your Style
Scalpers may prefer tighter ATR filters and shorter time windows, while swing traders may widen the range to capture larger structures.
Who This Indicator Is For
Traders seeking automated multi‑timeframe FVG detection
Those who want high‑confluence imbalance zones without manual charting
Traders using institutional concepts such as imbalance, mitigation, and liquidity
Anyone wanting a clean, dynamic, and customizable FVG clustering tool อินดิเคเตอร์

Order Book Ultimate# order book ultimate — synthetic depth, flow pressure and wall map
order book ultimate is a synthetic order book and market pressure tool for traders who want a visual way to study possible bid walls, ask walls, liquidity pressure, absorption, sweeps, imbalance and short-term directional bias.
this script does not read real exchange level 2 data, broker depth of market, or live limit order book data. it builds a synthetic depth model from chart price action, volume, volatility, round-number behavior, intrabar flow when available, and recent reactions around price levels. the goal is to help traders visualize where pressure may be building, where price may react, and when a setup has enough agreement between multiple conditions to deserve attention.
the script is designed as a decision-support tool, not as an automatic trading system. it should be used with market structure, risk management, and personal validation.
---
## what this script does
order book ultimate combines several components into one workflow:
* synthetic bid and ask depth levels around current price
* estimated bid/ask pressure using volume and candle position
* optional lower-timeframe intrabar flow analysis
* wall detection and wall stability tracking
* historical liquidity memory zones
* absorption detection near bid or ask walls
* bullish and bearish sweep detection
* pro score and confidence score
* market regime filter
* visual long and short setup markers
* visual stats for signal follow-up
* compact, full and debug dashboard modes
* alerts for stable walls, imbalance, setups, absorption, sweeps and invalidation
the main idea is to avoid reading one signal alone. the script looks for agreement between pressure, depth imbalance, wall strength, trend, obv flow, absorption, sweeps and market regime.
---
## important note about the order book model
this is a synthetic order book model.
it does not show the real resting orders from an exchange. instead, it estimates possible liquidity concentration by using:
* atr-based spacing
* recent volume
* candle rejection behavior
* round-number magnetism
* intrabar buy/sell pressure when available
* historical reactions around price
* volatility and market regime adjustments
because of this, the script should be treated as a market pressure map, not as real dom or level 2 data.
---
# engine modes
## engine mode
this setting controls how the script measures market pressure.
### classic synthetic
uses the current chart candles only. it estimates buy and sell pressure from candle position, volume, delta approximation and recent flow.
best for:
* higher timeframes
* symbols where lower-timeframe data is not needed
* cleaner and lighter calculations
### intrabar flow
uses lower-timeframe candles inside the current candle to estimate pressure more closely.
best for:
* scalping
* intraday trading
* checking whether the current candle has strong internal buying or selling pressure
### hybrid pro
combines classic synthetic pressure with lower-timeframe intrabar flow. this is the default balanced mode.
best for:
* most traders
* 5m, 15m, 30m and 1h charts
* users who want both stable context and intrabar sensitivity
---
## lower timeframe
this is the lower timeframe used by the intrabar flow engine.
example:
* if your chart is 15m and lower timeframe is 1m, the script studies the 1m candles inside each 15m candle.
* if your chart is 5m and lower timeframe is 1m, it studies the 1m movement inside each 5m candle.
beginner tip:
use 1m for scalping and 3m or 5m for smoother intraday reading.
---
## intrabar weight in hybrid
this controls how much the hybrid engine trusts lower-timeframe flow.
* 0.00 means almost no intrabar influence.
* 0.55 gives a balanced mix.
* 1.00 gives maximum intrabar influence.
beginner tip:
keep it near 0.50 to 0.60 for a balanced setup. raise it only if you want more reactive signals.
---
## use confirmed bars for signals
when enabled, signals only confirm after the candle closes.
this helps reduce noisy live-bar signals. when disabled, signals can appear during the current candle, but they may change before the candle closes.
beginner tip:
keep this enabled if you want cleaner signals.
---
# synthetic depth engine
## levels per side
this controls how many synthetic bid levels and ask levels are calculated around price.
* lower values make the display simpler.
* higher values create a wider synthetic depth map.
beginner tip:
15 is a good balanced setting.
---
## level spacing x atr
this controls the spacing between synthetic levels using atr.
* lower values place levels closer to current price.
* higher values spread them farther away.
beginner tip:
use lower values for scalping and higher values for swing trading.
---
## volume lookback
this sets how many candles are used to build the average volume baseline.
* shorter lookback reacts faster.
* longer lookback is smoother.
beginner tip:
100 is a balanced value for most intraday charts.
---
## refresh rate
this controls how often the synthetic depth levels refresh.
* 1 refreshes every bar.
* higher values refresh less often.
beginner tip:
keep it at 1 for active trading.
---
## depth multiplier
this increases or decreases the strength of the synthetic depth zones.
* higher values create stronger wall readings.
* lower values make the script more conservative.
beginner tip:
2.0 is a balanced default.
---
## depth decay sigma
this controls how quickly synthetic liquidity fades as price levels move farther from current price.
* lower values focus more on nearby levels.
* higher values include farther levels.
beginner tip:
use lower values for scalping and higher values for wider market context.
---
## liquidity memory bars
this tells the script how far back it should remember recent reactions around price levels.
* lower values focus on recent reactions.
* higher values keep more market memory.
beginner tip:
40 is a good starting point.
---
# round number engine
## round number magnetism
this increases the importance of round prices.
markets often react near round numbers because many traders place orders around them. this setting makes the synthetic depth engine give more weight to those areas.
beginner tip:
use higher values on indices and crypto, and lower values on forex if the levels feel too wide.
---
## auto round step
when enabled, the script automatically chooses a round-number step based on the symbol price.
beginner tip:
keep this enabled unless you know exactly which round levels you want to use.
---
## manual round step
this is used only when auto round step is disabled.
example:
* 100 for major crypto round zones
* 10 for some indices
* 1 or 0.5 for stocks depending on price
beginner tip:
leave it at 0.0 when auto round step is enabled.
---
## round zone width %
this controls how close price must be to a round level before the round-number magnet effect becomes important.
* lower values are stricter.
* higher values allow wider round-number zones.
beginner tip:
1.5 is a balanced default.
---
# flow / pressure engine
## delta length
this controls how many candles are used to estimate delta pressure.
* shorter length reacts faster.
* longer length is smoother.
beginner tip:
20 works well for general intraday use.
---
## obv ma length
this is the moving average length used for obv flow.
if obv is above its moving average, the script reads flow as more bullish. if it is below, flow is more bearish.
beginner tip:
20 is a good default.
---
## pressure smoothing
this smooths the pressure reading.
* low values react faster.
* high values reduce noise.
beginner tip:
5 is a balanced value.
---
# wall stability / memory
## wall stable bars
this controls how many bars a wall must remain active before it is considered stable.
* lower values confirm faster.
* higher values require more persistence.
beginner tip:
3 is a good starting point.
---
## same wall zone x tick
this controls how close a new wall must be to the previous wall to be treated as the same wall.
* lower values separate walls more strictly.
* higher values merge nearby walls more easily.
beginner tip:
3.0 is balanced.
---
## max historical zones
this controls how many historical wall zones are kept in memory.
beginner tip:
12 keeps the chart useful without too much clutter.
---
## historical merge x tick
this controls how close historical zones must be to merge together.
* lower values create more separate zones.
* higher values combine nearby levels.
beginner tip:
6.0 is a balanced default.
---
## historical strength decay
this controls how slowly old historical zones lose strength.
* 1.0 means they do not decay.
* lower values make old zones fade faster.
beginner tip:
0.985 keeps useful memory while still allowing old zones to fade.
---
# absorption / sweep / filters
## anti-noise confirmation
when enabled, the script requires extra filters before confirming long or short setups.
it checks for enough volume, pressure agreement, stable walls, absorption or sweep context, and avoids low-liquidity conditions.
beginner tip:
keep this enabled for cleaner signals.
---
## min volume x avg
this is the minimum volume required compared to average volume.
example:
0.90 means current volume should be at least 90% of average volume.
beginner tip:
raise it if you want fewer but stronger signals.
---
## absorption volume x avg
this controls how much volume is required to detect absorption.
absorption means price touches or pushes into a wall area, but the candle shows rejection instead of clean continuation.
beginner tip:
1.20 is balanced. raise it for stricter absorption signals.
---
## absorption zone x atr
this controls how close price must be to a wall for absorption detection.
* lower values require price to be very close to the wall.
* higher values allow a wider absorption area.
beginner tip:
0.18 works well for many intraday charts.
---
## sweep zone x atr
this controls how far price must move beyond a wall before a sweep can be detected.
a bullish sweep happens when price moves below a bid wall or historical bid zone and then closes back above it.
a bearish sweep happens when price moves above an ask wall or historical ask zone and then closes back below it.
beginner tip:
0.10 is a good starting value.
---
## exhaustion rsi high
this level is used to warn when a long setup may be overextended.
if a long setup appears while rsi is very high and the candle shows rejection, the setup can be marked as exhausted.
beginner tip:
72 is a balanced default.
---
## exhaustion rsi low
this level is used to warn when a short setup may be overextended.
if a short setup appears while rsi is very low and the candle shows rejection, the setup can be marked as exhausted.
beginner tip:
28 is a balanced default.
---
# regime / asset calibration
## asset profile
this adjusts the behavior of the script for different markets.
available profiles:
* auto
* crypto
* forex
* index
* stock
* futures
* generic
auto reads the symbol type and applies a matching profile.
beginner tip:
use auto first. switch manually only if the script feels too sensitive or too slow on your market.
---
## auto-calibrate thresholds
when enabled, the script adjusts wall strength, round-number behavior and memory based on the selected asset profile.
beginner tip:
keep this enabled.
---
## adx length
this controls the adx calculation used to identify trending or ranging conditions.
beginner tip:
14 is a standard value.
---
## volatility baseline
this controls the baseline used to compare current volatility with normal volatility.
* lower values react faster.
* higher values are smoother.
beginner tip:
100 is a balanced setting.
---
# spread / range proxy
## spread display
this chooses how the script estimates spread or micro-range conditions.
### adaptive proxy
uses an adaptive estimate based on recent range.
### bar range
uses the full current candle range.
### atr micro
uses a small atr-based estimate.
beginner tip:
use adaptive proxy for most markets.
---
## adaptive spread factor
this controls the size of the adaptive spread proxy.
beginner tip:
0.05 is a balanced default. raise it if the spread reading looks too small.
---
# visual / panel
## show panel
shows or hides the dashboard.
the panel displays score, confidence, regime, bid/ask depth, pressure, wall state, absorption, sweeps, visual stats and more depending on the selected panel mode.
---
## panel mode
### compact
shows only the most important information.
best for:
* small screens
* clean charting
* quick decision making
### full
shows the complete dashboard.
best for:
* normal trading use
* studying pressure, walls, volume and flow
### debug
shows additional internal values.
best for:
* testing settings
* understanding how the engine is reacting
* advanced users
---
## panel position
chooses where the dashboard appears on the chart.
options:
* top right
* top left
* bottom right
* bottom left
---
## show best wall zones
when enabled, the script draws the strongest stable bid and ask wall zones on the chart.
bid wall zones appear below price and can act as possible support areas.
ask wall zones appear above price and can act as possible resistance areas.
---
## show signal markers
when enabled, the script plots markers for:
* long setup
* short setup
* bid absorption
* ask absorption
* bullish sweep
* bearish sweep
* invalidation
---
## wall zone forward bars
this controls how far the wall zone boxes extend into the future.
beginner tip:
30 is a good value for intraday charts.
---
## panel bg
sets the dashboard background color.
---
## bid color
sets the color used for bullish or bid-side elements.
---
## ask color
sets the color used for bearish or ask-side elements.
---
## neutral color
sets the color used for neutral readings.
---
## accent color
sets the color used for highlights and active dashboard elements.
---
## warning color
sets the color used for warnings, exhaustion and invalidation.
---
# alerts / scoring
## wall threshold x avg
this controls how strong a wall must be compared to the average depth before it is considered important.
* lower values create more wall signals.
* higher values require stronger walls.
beginner tip:
2.0 is a balanced default.
---
## imbalance threshold
this controls how strong the bid/ask imbalance must be before the script labels the market as bid heavy or ask heavy.
beginner tip:
1.6 is a good starting point.
---
## long bias score
this is the score level required for a long bias.
example:
70 means the pro score must reach 70 or higher before a long setup can be confirmed.
---
## short bias score
this is the score level required for a short bias.
example:
30 means the pro score must fall to 30 or lower before a short setup can be confirmed.
---
## min confidence
this is the minimum agreement score needed before the script confirms a setup.
confidence is based on agreement between pressure, imbalance, wall direction, trend, obv, intrabar quality, absorption, sweeps and regime.
beginner tip:
55 is a balanced default. raise it for stricter signals.
---
# visual backtest stats
## enable visual stats
when enabled, the script tracks basic visual follow-up stats after confirmed signals.
this is not a full strategy backtest. it is a visual stats module that checks whether a signal reaches an atr-based target or invalidation level within a chosen number of bars.
---
## target x atr
this controls the target distance used by visual stats.
example:
0.75 means the target is 0.75 atr from the signal price.
---
## invalidation x atr
this controls the invalidation distance used by visual stats.
example:
0.55 means the invalidation level is 0.55 atr from the signal price.
---
## max bars in signal
this controls how long the visual stats module gives a signal to reach target or invalidation.
if neither target nor invalidation is reached before this number of bars, the signal is closed by time.
---
# dashboard guide
## score
the score ranges from 0 to 100.
* above the long bias score: long bias
* below the short bias score: short bias
* between both levels: neutral
the score is built from pressure, imbalance, wall strength, trend, obv, rsi, absorption, sweep and regime.
---
## confidence
confidence measures how much agreement exists between the engine components.
a high score with low confidence should be treated carefully. a high score with strong confidence is cleaner.
---
## regime
the regime label describes the current market environment.
possible states include:
* high vol
* low liq
* breakout
* trending
* ranging
* balanced
beginner tip:
avoid forcing trades in low-liquidity conditions.
---
## bid / ask
this shows the estimated synthetic bid depth and ask depth.
if bid depth is much stronger than ask depth, the market may be bid heavy.
if ask depth is much stronger than bid depth, the market may be ask heavy.
---
## pressure
this shows whether buying or selling pressure is dominant.
pressure is not a signal by itself. it should agree with walls, imbalance and confidence.
---
## walls
this shows whether bid and ask walls are:
* none
* weak
* building
* holding
a holding wall is more important than a fresh or weak wall.
---
## abs / sweep
this shows whether absorption or a sweep is currently detected.
absorption can show rejection at a wall.
a sweep can show liquidity being taken before price returns.
---
## bt stats
this shows the visual stats result of recent confirmed signals.
it should be used for observation, not as proof of future performance.
---
# chart markers
## l marker
a long setup marker appears when the script confirms long bias conditions, confidence is high enough, and the noise filter allows the signal.
---
## s marker
a short setup marker appears when the script confirms short bias conditions, confidence is high enough, and the noise filter allows the signal.
---
## abs marker
an absorption marker appears when price interacts with a wall area with strong volume and rejection.
bid absorption appears below price.
ask absorption appears above price.
---
## sw marker
a sweep marker appears when price raids a wall or historical liquidity zone and then closes back through it.
bullish sweep appears below price.
bearish sweep appears above price.
---
## x marker
an invalidation marker appears when a setup is invalidated by price moving beyond the relevant wall area.
---
# available alerts
the script includes alerts for:
* stable synthetic bid wall
* stable synthetic ask wall
* bid heavy imbalance
* ask heavy imbalance
* long setup confirmed
* short setup confirmed
* bid absorption
* ask absorption
* bullish sweep
* bearish sweep
* setup invalidated
beginner tip:
start with only a few alerts. for example:
* stable bid wall
* stable ask wall
* long setup confirmed
* short setup confirmed
* bullish sweep
* bearish sweep
too many alerts can make the workflow noisy.
---
# beginner tutorial
## step 1 — choose the correct engine mode
start with hybrid pro.
hybrid pro is the most balanced mode because it combines classic chart pressure with lower-timeframe flow.
use classic synthetic if you want a smoother reading.
use intrabar flow if you want maximum short-term sensitivity.
---
## step 2 — choose the lower timeframe
for a 15m chart, start with 1m or 3m.
for a 5m chart, start with 1m.
for a 1h chart, try 5m or 15m.
if the script feels too reactive, use a higher lower-timeframe setting or lower the intrabar weight.
---
## step 3 — read the panel first
before looking at markers, read the panel:
1. check the market regime.
2. check the score.
3. check confidence.
4. check bid/ask imbalance.
5. check pressure.
6. check wall state.
7. check absorption or sweep.
do not take a marker if the panel does not make sense.
---
## step 4 — use walls as zones, not exact entries
a stable bid wall can act as a possible support area.
a stable ask wall can act as a possible resistance area.
price may react around the zone, not exactly at one tick.
---
## step 5 — wait for context
a better long idea usually has:
* stable bid wall
* bid-heavy or improving depth
* positive pressure
* bullish sweep or bid absorption
* score above the long bias level
* confidence above the minimum
a better short idea usually has:
* stable ask wall
* ask-heavy or weakening bid depth
* negative pressure
* bearish sweep or ask absorption
* score below the short bias level
* confidence above the minimum
---
# example use cases
## example 1 — bullish wall reaction
price moves down into a stable bid wall.
the panel shows:
* bid wall holding
* bid/ask ratio improving
* pressure turning positive
* confidence rising
* bid absorption appears
a trader may wait for price to hold above the wall and then look for a long setup marker.
possible invalidation:
price closes below the bid wall area and an invalidation marker appears.
---
## example 2 — bearish wall rejection
price moves up into a stable ask wall.
the panel shows:
* ask wall holding
* ask-heavy imbalance
* pressure turning negative
* ask absorption appears
* confidence is above the minimum
a trader may wait for rejection from the ask wall and a short setup marker.
possible invalidation:
price closes above the ask wall area.
---
## example 3 — bullish sweep
price moves below a bid wall or historical bid zone and then closes back above it.
the script marks a bullish sweep.
this can mean sellers pushed price below liquidity, but buyers absorbed the move and price returned above the zone.
a trader may then check:
* is pressure improving?
* is confidence strong enough?
* is the score moving toward long bias?
* is the market not in low-liquidity mode?
---
## example 4 — bearish sweep
price moves above an ask wall or historical ask zone and then closes back below it.
the script marks a bearish sweep.
this can mean buyers pushed price above liquidity, but sellers absorbed the move and price returned below the zone.
a trader may then check:
* is pressure weakening?
* is ask absorption present?
* is confidence strong enough?
* is the score moving toward short bias?
---
## example 5 — avoiding a weak signal
a long marker appears, but the panel shows:
* low liquidity regime
* weak confidence
* no stable bid wall
* no absorption
* no sweep
this is a low-quality context.
the better choice is to wait for stronger agreement.
---
## example 6 — using visual stats
enable visual stats and keep default atr target and invalidation settings.
after each confirmed setup, the panel tracks whether price reached the target, invalidation or timed out.
this is useful for studying the behavior of the signals on your market, but it is not a complete strategy backtest.
---
# suggested starting settings
## scalping
chart:
1m to 5m
settings:
* engine mode: hybrid pro
* lower timeframe: 1m
* intrabar weight: 0.55 to 0.70
* use confirmed bars: enabled
* wall threshold: 2.0 to 2.5
* min confidence: 60 to 70
* panel mode: compact or full
best use:
watch for stable walls, sweeps and absorption during active sessions.
---
## intraday
chart:
5m to 30m
settings:
* engine mode: hybrid pro
* lower timeframe: 1m to 5m
* intrabar weight: 0.45 to 0.60
* use confirmed bars: enabled
* wall stable bars: 3 to 5
* min confidence: 55 to 65
* panel mode: full
best use:
use stable walls as reaction zones and wait for score plus confidence agreement.
---
## swing or higher timeframe
chart:
1h to 4h
settings:
* engine mode: classic synthetic or hybrid pro
* lower timeframe: 5m to 15m
* intrabar weight: 0.25 to 0.45
* volume lookback: 100 to 200
* liquidity memory bars: 60 to 120
* panel mode: full
best use:
focus on larger wall zones, market regime and historical liquidity memory.
---
# practical workflow
1. open the chart and choose the market.
2. set engine mode to hybrid pro.
3. choose a lower timeframe smaller than the chart timeframe.
4. keep confirmed bars enabled.
5. check the panel regime.
6. wait for a stable wall.
7. watch bid/ask imbalance and pressure.
8. wait for absorption, sweep or a confirmed setup marker.
9. define invalidation around the wall zone.
10. use visual stats to observe signal behavior over time.
---
# limitations
this script uses synthetic calculations. it does not access real order book liquidity, real level 2 data, broker depth, or exchange resting orders.
signals may perform differently depending on symbol, timeframe, session, liquidity and volatility.
visual stats are only a simple chart-based follow-up tool. they are not a full trading strategy backtest.
the script should be combined with risk management, market structure, session context and personal testing.
---
# risk notice
this indicator is for technical analysis and education. it does not provide financial advice and does not guarantee future results. every trader is responsible for their own decisions, risk management and testing.
อินดิเคเตอร์

ID009 Liquidity Path [ReconHK] A liquidity-focused chart indicator designed to help traders study whether price is reclaiming or holding above a key liquidity pivot, while also checking structural liquidity, traded activity, trend context, relative volume, and buyer-pressure confirmation.
------------------------------------------------------------------------------------------------
## 1. What this indicator is for 🧭
------------------------------------------------------------------------------------------------
Liquidity Path is designed to help traders understand whether price is moving through a healthier liquidity area instead of chasing random breakouts. The indicator builds a liquidity profile from the selected lookback period, finds the main activity area, and marks the Liquidity Pivot, also known as the profile point of control.
The main idea is simple: price action near a high-activity area can be more meaningful than price action in a thin or fragmented area. When price reclaims or holds above the Liquidity Pivot with volume, buyer pressure, and trend support, the setup may show a stronger liquidity path.
This indicator is not a buy-or-sell system by itself. It is a decision-support tool for reviewing liquidity structure, participation, and price behavior around the profile pivot.
The purpose is to help traders avoid late or weak breakouts by checking whether price is close to the main liquidity pivot and supported by participation.
------------------------------------------------------------------------------------------------
## 2. What you see on the chart 👀
------------------------------------------------------------------------------------------------
The indicator can show several visual elements:
Blue liquidity profile : a right-side profile showing where more trading activity happened during the selected lookback.
Orange Liquidity Pivot : the main profile pivot, based on the highest activity area of the profile.
Lookback zone : the chart area used to build the liquidity profile.
EMA 20 and EMA 50 : optional trend-context lines.
Optional bias background : subtle background showing whether price is above or below the Liquidity Pivot.
The blue profile helps the user see where activity is concentrated. Thicker profile areas mean more activity was detected at that price zone. The orange Liquidity Pivot is the key reference level used by the path logic.
When price is above the Liquidity Pivot, the market is trading above the main activity reference. When price is below it, price is trading under that reference and may need a reclaim before the path setup improves.
------------------------------------------------------------------------------------------------
## 3. How to read the Liquidity Pivot 🟠
------------------------------------------------------------------------------------------------
The Liquidity Pivot is the central level of this indicator. It represents the price area with the strongest smoothed activity inside the selected profile lookback.
A reclaim above the Liquidity Pivot can be useful because it shows that price has moved back above a major activity reference. A hold or retest above the pivot can also be important because it may show acceptance above that area instead of only a short-lived breakout.
The indicator checks whether price is:
above the Liquidity Pivot,
not too far above the pivot,
not too extended from the short-term trend,
supported by relative volume,
showing buyer-pressure behavior,
aligned with the trend filter when enabled.
This helps separate cleaner liquidity-path situations from late, extended, or weak moves.
A reclaim is more useful when it happens near the pivot with participation. A move that is already too far above the pivot may be late and riskier.
------------------------------------------------------------------------------------------------
## 4. Suggested workflow ✅
------------------------------------------------------------------------------------------------
A practical workflow:
Start with the default settings.
Keep Liquidity quality on Balanced for most liquid stocks and crypto.
Use the blue liquidity profile to see where activity is concentrated.
Watch the orange Liquidity Pivot as the main reference level.
Check whether price is reclaiming or holding above the pivot.
Use the relative volume setting to require real participation.
Use the trend filter if you want signals to prefer EMA trend alignment.
Avoid acting when price is already too far above the pivot or too extended from the EMA.
Use alerts as chart-review reminders, not automatic trade instructions.
Confirm the setup with your own support, resistance, market structure, news, and risk plan.
The indicator is most useful when the user wants to study whether price is moving from a high-activity base into a stronger continuation path. It is less useful when the market is illiquid, fragmented, or moving with large gaps and weak participation.
------------------------------------------------------------------------------------------------
## 5. Risk notes and correct expectations ⚠️
------------------------------------------------------------------------------------------------
This indicator does not guarantee that price will continue higher after reclaiming the Liquidity Pivot. A reclaim can fail, especially during weak market conditions, low-volume moves, news shocks, or broad market selloffs.
Important reminders:
The Liquidity Pivot is a reference level, not a guaranteed support level.
A path signal is a confirmation event, not a complete trading plan.
Relative volume can confirm participation, but it does not remove risk.
Trend alignment can improve context, but trends can reverse.
Thin or fragmented symbols may produce less reliable readings.
Always define risk, stop logic, invalidation, and exit planning separately.
This script does not place trades, manage positions, set stops, or calculate position size. It should be used only as a decision-support tool.
Use the indicator to organize your liquidity and participation review. Do not use it as a substitute for risk management.
------------------------------------------------------------------------------------------------
## 6. Script structure and originality
------------------------------------------------------------------------------------------------
Liquidity Path is an overlay indicator. It is not a strategy.
The script uses:
* indicator(..., overlay = true)
* plot() for the Liquidity Pivot / POC line
* plot() for optional EMA 20 and EMA 50 lines
* bgcolor() for optional bias background
* box.new() for the right-side liquidity profile
* box.new() for the lookback zone
* label.new() for the pivot label
* alertcondition() for signal and pivot events
The script does not use:
* strategy.entry()
* strategy.exit()
* strategy.close()
* automatic order placement
* automatic risk management
The originality of the script is in how it combines several liquidity concepts into one path framework.
The main components are:
1. Structural liquidity filter
2. Continuity check
3. Profile-based Liquidity Pivot
4. Smoothed activity profile
5. Value area calculation
6. Trend context using EMA 20 and EMA 50
7. Relative volume confirmation
8. Buyer-pressure confirmation
9. POC reclaim or retest logic
10. Extension control
11. Path-mode strictness
12. Cooldown control
13. Visual profile and pivot tools
14. Alerts for reclaim, loss, and path signal
These components are not just displayed separately. They work together to answer one practical question:
Is price reclaiming or holding above an important liquidity area with enough structure, volume, trend context, and buyer pressure?
This is what makes the script different from a basic moving-average, volume, or profile-only display.
------------------------------------------------------------------------------------------------
## 7. Structural liquidity filter
------------------------------------------------------------------------------------------------
The script first checks whether the symbol has acceptable structural liquidity. This helps reduce signals on thin, fragmented, or unreliable markets.
The structural liquidity data is calculated from daily data:
dClose
dOpen
dHigh
dLow
dVol
The script calculates daily dollar volume:
addvD = daily close * daily volume
Then it calculates:
addv20 = 20-period average daily dollar volume
p10Addv20 = 10th percentile of daily dollar volume over the short liquidity window
This means the script does not only check average liquidity. It also checks whether the lower-end liquidity is acceptable. A symbol can have one large-volume day and still be unreliable if many other days are weak.
The script also checks gap behavior:
gapPct = absolute difference between current daily open and prior daily close
gapHit = gap is counted when it is greater than the internal gap threshold
gapFreqPct = percentage of recent days with meaningful gaps
This helps identify symbols that move with frequent gaps instead of continuous trading behavior.
The continuity check uses the selected continuity timeframe:
contTfInput = 30, 60, 120, or 240 minutes
It checks whether volume is missing or zero on that secondary timeframe:
deadBar = continuity timeframe volume equals zero
deadBarPct = percentage of dead bars in the recent window
The script also checks stability:
cvAddv = coefficient of variation of daily dollar volume
rangeFrac = daily range divided by daily close
medRangeFrac = median range fraction
The Liquidity quality setting changes thresholds:
Strict requires higher average dollar volume, stronger lower-percentile dollar volume, fewer dead bars, fewer gaps, lower dollar-volume variation, and lower median range fraction.
Balanced uses medium thresholds and is intended for most liquid stocks and crypto.
Loose allows weaker structure and can produce more signals, but may also accept less reliable symbols.
The script creates:
structAddvOk
structP10Ok
structDeadOk
structGapOk
structCvOk
structRangeOk
The main path setup uses:
structuralQualified = structAddvOk and structP10Ok and structDeadOk
The script also calculates:
structuralRobust = structuralQualified and structGapOk and structCvOk and structRangeOk
This gives the script a liquidity-quality foundation before it evaluates the profile path signal.
------------------------------------------------------------------------------------------------
## 8. Liquidity profile and pivot calculation
------------------------------------------------------------------------------------------------
The script builds a custom right-side liquidity profile from the selected lookback period.
The profile range is:
highs = highest high over the lookback
lows = lowest low over the lookback
priceRange = highs - lows
The profile is divided into a fixed number of bins:
BINS_COUNT = 120
Each bar in the lookback contributes activity to one price bin using hlc3:
p = hlc3
The script adds volume to the selected bin:
v = volume * weight
The weighting is enabled internally:
weightedInput = true
This means newer bars receive more weight than older bars:
w = 1.0 - i / lookbackInput
This creates a profile that still uses the full lookback but gives more importance to recent activity.
After raw bin activity is built, the script smooths the profile. It loops around each bin and averages nearby bins with distance-based weights. This reduces noise and avoids making the pivot depend too heavily on one single sharp bin.
The script finds the strongest smoothed bin:
maxVol = highest smoothed bin activity
pocIdx = index of strongest bin
pocRaw = price at the center of that bin
This raw pivot is then smoothed:
pocSmoothed = EMA of pocRaw
The final Liquidity Pivot is clamped inside the calculated value area:
pocPrice = clamp(pocSmoothed, value area low, value area high)
The value area is calculated from the POC outward:
1. Start at the POC bin.
2. Add the neighboring bin with more activity.
3. Continue expanding up or down until the selected value-area percentage is reached.
The script calculates:
vah = value area high
val = value area low
The plotted Liquidity Pivot is the final smoothed and clamped POC:
plot(pocPrice, title = "Liquidity Pivot / POC")
This profile design is useful because the pivot is not just the highest raw volume bin. It is smoothed, recent-weighted, and constrained by the internal value area.
------------------------------------------------------------------------------------------------
# 9. Liquidity Path signal logic
------------------------------------------------------------------------------------------------
The Liquidity Path signal is built from several gates.
First, the script checks where price is relative to the Liquidity Pivot:
abovePocNow = close > pocPrice
belowPocNow = close < pocPrice
Then it measures distance from the pivot:
pocDistancePct = distance between close and pocPrice in percent
This is important because the script tries to avoid late entries. A price that is far above the pivot may already be extended.
The script also measures distance from the fast EMA:
emaDistancePct = distance between close and EMA 20 in percent
The path mode changes strictness:
Early allows more signals and a wider reclaim window.
Balanced uses medium behavior.
Strict requires tighter confirmation.
The script detects:
crossClosePoc = close crosses above the Liquidity Pivot
crossUnderPoc = close crosses below the Liquidity Pivot
It also detects recent reclaim behavior:
barsSinceReclaim
recentReclaim
The reclaim window changes by path mode:
Strict = shorter window
Balanced = medium window
Early = longer window
The script also allows a recent retest:
recentPocRetest
A retest means price recently touched near the Liquidity Pivot but closed back above it. This supports the idea that the pivot may be acting as an accepted liquidity reference.
The POC break-quality check requires:
* price above the pivot
* close meaningfully above the pivot
* high above the pivot
The POC slope check changes by mode:
Strict requires the pivot to be rising recently.
Balanced allows the pivot to be stable or rising over a short comparison.
Early allows a more flexible pivot condition.
The extension filters are:
nearPocPath = price is above POC but not too far above it
notExtendedPath = price is not too far from EMA 20
The trend filter checks:
* EMA 20 above EMA 50
* close above EMA 20
* EMA 20 not falling
This filter can be disabled by the user.
The volume confirmation checks:
* relative volume is not na
* relative volume is above the user threshold
* current volume is above volume moving average
The buyer-pressure confirmation checks:
* bullish candle
* close location value is above the bullish threshold
* delta is improving, or recent buy-share estimate is strong, or price closed above the prior high
The final setup requires:
liquidityPathSetup =
structuralQualified
and price above POC
and POC break quality
and price near POC
and price not extended
and recent reclaim, recent retest, or current reclaim
The final raw path signal requires:
liquidityPathSetup
and trendPathOk
and volumePathOk
and pressurePathOk
and path-mode slope condition
The final signal also uses a cooldown:
pathCooldownBars depends on Early, Balanced, or Strict mode
pathSignal = pathSignalRaw and pathCooldownOk
This makes the signal more selective than a simple POC cross. It must pass liquidity quality, pivot location, extension control, trend context, participation, buyer pressure, and cooldown logic.
------------------------------------------------------------------------------------------------
## 10. Inputs, visuals, alerts, and publication notes
------------------------------------------------------------------------------------------------
The script includes user inputs grouped into four sections.
Core inputs:
1. Liquidity quality
Controls the structural liquidity filter.
Strict = cleaner but fewer symbols and signals.
Balanced = recommended default.
Loose = more permissive.
2. Continuity timeframe
Secondary timeframe used to check whether trading activity is continuous or fragmented.
3. Use trend filter
When enabled, path signals prefer EMA 20 above EMA 50, close above EMA 20, and non-falling EMA 20.
Liquidity Profile inputs:
4. Profile lookback
Number of bars used to build the blue profile and calculate the Liquidity Pivot.
5. Value area %
Percent of profile activity used to define the value area.
6. Show blue liquidity profile
Displays the right-side profile.
7. Show pivot label
Displays the right-side label for the Liquidity Pivot.
8. Show lookback zone
Highlights the exact chart area used to build the profile.
Liquidity Path inputs:
9. Path signal mode
Early, Balanced, or Strict.
10. Max distance above POC %
Prevents late signals when price is already too far above the pivot.
11. Min RVOL confirmation
Minimum relative volume required for participation confirmation.
Visual inputs:
12. Show EMA lines
Displays EMA 20 and EMA 50.
13. Show PATH labels
This input exists in the current script, but the uploaded version does not show a plotted path label command. If a visible label is intended, a plotshape() or label.new() condition should be added for pathSignal.
14. Show subtle bias background
Optional green or red background based on price above or below the Liquidity Pivot.
15. Pivot name
Custom name shown beside the pivot label.
Visual drawing:
The right-side profile is drawn using boxes. Each box represents one price bin. Wider boxes mean more normalized activity at that price area.
The lookback zone is drawn with a box covering:
* selected lookback bars
* highest high and lowest low of that lookback
The pivot label is drawn on the right side at the current Liquidity Pivot price.
Alerts:
The script includes three alert conditions:
1. Liquidity Path Signal
Triggered when price reclaimed or held above the POC with liquidity, volume, and buyer-pressure confirmation.
2. POC Reclaim
Triggered when price crosses above the Liquidity Pivot.
3. POC Lost
Triggered when price crosses below the Liquidity Pivot.
Important distinction:
* POC Reclaim is a simple pivot-cross event.
* POC Lost is a simple pivot-loss event.
* Liquidity Path Signal is more selective because it requires structural liquidity, pivot position, extension control, trend context, relative volume, buyer pressure, and cooldown logic.
Publication note:
This description explains how the combined parts work together so users do not need to read Pine code to understand the tool. It also clarifies that the script is a liquidity and participation review indicator, not an automated trading strategy.
Open-source transparency note: if any external open-source code, function, or logic was reused, the original author and source should be credited clearly in the publication.
อินดิเคเตอร์

อินดิเคเตอร์

อินดิเคเตอร์

Aquila Reale - Wyckoff MASTER+Aquila Reale — Wyckoff MASTER+ | Auto Accumulation/Distribution + Smart TPs
**BETA version — feedback highly appreciated.** First public release of this indicator. Logic carefully designed and syntax tested, but not yet personally traded live by the author. Treat findings as preliminary.
---
## What it does
Detects whether the current market is in **ACCUMULATION** (smart money buying at lows) or **DISTRIBUTION** (smart money selling at highs) using a weighted 15-point scoring system across 5 Wyckoff dimensions:
1. **HTF Trend** — price vs EMA 50/200 on the higher timeframe
2. **Range Structure** — Higher Lows vs Lower Highs detection
3. **Volume Behavior** — up-bar vs down-bar volume balance + climax bars
4. **VSA Patterns** — Stopping Volume, No Demand, No Supply, SOS, SOW
5. **Price Position** — where price sits within the current range
After detection, it plots **automatic operational levels** on the chart:
- **Stop Loss** at the range extreme
- **Entry** at the optimal Wyckoff zone
- Up to **5 Take Profits**, prioritizing real historical pivot levels over geometric projections
---
## Why this is different
Most Wyckoff indicators on TradingView fall in 3 categories:
- **Too simple** — they only label "Spring" or "UTAD" without an operational setup
- **Too theoretical** — they show measured moves with no realistic targets
- **Black boxes** — they give you a buy/sell signal with no transparency
This script does the opposite:
- **Full transparency** — the dashboard shows each of the 5 sub-scores so you understand WHY the indicator says what it says
- **Operational** — gives you SL, Entry, and TPs with realistic distances
- **Smart TPs** — when possible, uses real historical swing levels (where price has reacted before), not arbitrary geometric projections
- **Multi-mode** — you can force LONG/SHORT manually or let the indicator decide
---
## Reliability (realistic, not marketing)
| Signal | Accuracy |
|--------|----------|
| ACCUMULATION / DISTRIBUTION with HIGH confidence | 75-80% |
| FORCED LONG / FORCED SHORT (fallback mode) | 45-55% |
| TP1 hit probability | 70-80% |
| TP2 hit probability | 45-55% |
| TP3 hit probability | 20-30% |
These are estimates based on the underlying logic. Actual results vary by asset, market conditions, and timeframe. **No indicator is 100% accurate.**
---
## Recommended timeframes
- **Daily** — Wyckoff lives here. Best signals, fewer trades.
- **4-Hour** — Sweet spot for swing trading setups.
- **1-Hour** — Good for entry timing, more noise.
- **30/15-Minute** — Acceptable for scalping confirmation.
- **5-Minute and below** — Not recommended (too much noise).
## Recommended assets
- **Crypto (BTC, ETH)** — Real market volume, most reliable
- **Indices (SPX, NDX)** — Reliable volume aggregation
- **Stocks** — Reliable exchange volume
- **Forex / CFDs / Commodities** — Volume comes from your broker only, less reliable
---
## How to use it
**Step 1 — Read the verdict in the dashboard:**
- **"ACCUMULATION" or "DISTRIBUTION"** = strong signal, consider trading
- **"FORCED LONG" / "FORCED SHORT"** = weak signal (fallback), levels are technically valid but use your own analysis to confirm direction
- **"WAIT"** = no clear setup, stay out
**Step 2 — Filter by confidence:**
- HIGH (>80%) = full position size acceptable
- MEDIUM (60-79%) = half position size, tighter management
- LOW or ZERO = reduce or skip
**Step 3 — Trade management:**
- Enter at the ENTRY level
- Stop Loss at the STOP LOSS level
- Take partial profits at TP1 (70-80% probability)
- Move stop to break-even after TP1 is hit
- Let the rest run to TP2 / TP3
- Never risk more than your predefined risk per trade (1-2%)
**Step 4 — Multi-timeframe:**
- Higher TF (Daily/Weekly) = directional bias
- Mid TF (4H) = setup confirmation
- Lower TF (1H/15min) = exact entry timing
- Never take a trade against the higher timeframe bias
---
## Dashboard modes
- **COMPLETE** — full panel with all 5 sub-scores, totals, verdict, confidence, signal, TP mode
- **COMPACT** — only totals, verdict, confidence and signal (no labels column)
- **MINIMAL** — single TRADE/WAIT cell
- **HIDDEN** — no dashboard at all
Position is configurable (9 positions) with X/Y offset for fine placement.
---
## Configurable parameters
29 inputs across 6 groups, each with detailed tooltips:
1. **Range & Pivot Detection** — lookback bars, pivot sensitivity
2. **Setup Direction** — AUTO / SHORT / LONG override
3. **Smart Take Profits** — TP multipliers, anchor mode (ENTRY or RANGE_EDGE), spacing, fallback
4. **Higher Timeframe Context** — HTF and EMA periods
5. **Volume Analysis** — volume MA, climax/high/low thresholds
6. **Visualization** — dashboard mode, size, position, offsets, label size, TP count
Every parameter has guidance on which timeframe / asset class works best.
---
## Alerts
Three configurable alerts:
- **ACCUMULATION detected** — fires when score crosses the detection threshold
- **DISTRIBUTION detected** — fires when score crosses the detection threshold
- **ENTRY zone touched** — fires when price reaches the calculated entry level
---
## Feedback wanted
This is a community-driven project. Specific questions for users:
- Which timeframes work best for you?
- Which assets give the most reliable signals?
- Are the default TP multipliers realistic for your trading style?
- Have you found settings that consistently outperform the defaults?
- Any recurring false signal patterns that should be filtered?
**Please leave a comment under the script with your experience.** Meaningful feedback will be credited in future version notes.
---
## Disclaimer — please read
**Not financial advice.** This indicator and its output are for educational and informational purposes only. It does NOT constitute financial, investment, or trading advice.
**No guarantee of profitability.** Past performance is not indicative of future results. Reliability percentages are estimates, not guarantees.
**Use at your own risk.** Trading carries a high level of risk and may not be suitable for all investors. You may lose some or all of your capital.
**No liability.** The author (giua64) shall not be held liable for any loss or damage arising from the use of this indicator. By using it you accept full responsibility for your trading decisions.
**DYOR.** Always conduct your own research. Cross-check signals against other tools, fundamental analysis, and market context.
**Paper trade first.** Test on a demo account or with paper trading before risking real capital.
**Not tested live by author (yet).** This is the first public release. Treat findings as preliminary.
**Volume limitations.** Volume data on Forex and CFDs comes from individual brokers and may not reflect true market volume, reducing the reliability of volume-based signals on those instruments.
**Open source license.** Free to use for personal trading. If you build on this work please credit the original author.
---
## Credits
Built on Wyckoff Method principles (Richard D. Wyckoff, early 1900s) and Volume Spread Analysis (Tom Williams, 1990s). Original Spring detector code by giua64. Smart historical TP logic and dashboard system designed for the **Aquila Reale** indicator suite.
🦅 *Aquila Reale — nate per volare, nate per osare*
---
**Tags:** wyckoff, accumulation, distribution, volume-spread-analysis, vsa, smart-money, take-profit, automatic-levels, multi-timeframe, swing-trading, order-block, market-structure
อินดิเคเตอร์

อินดิเคเตอร์
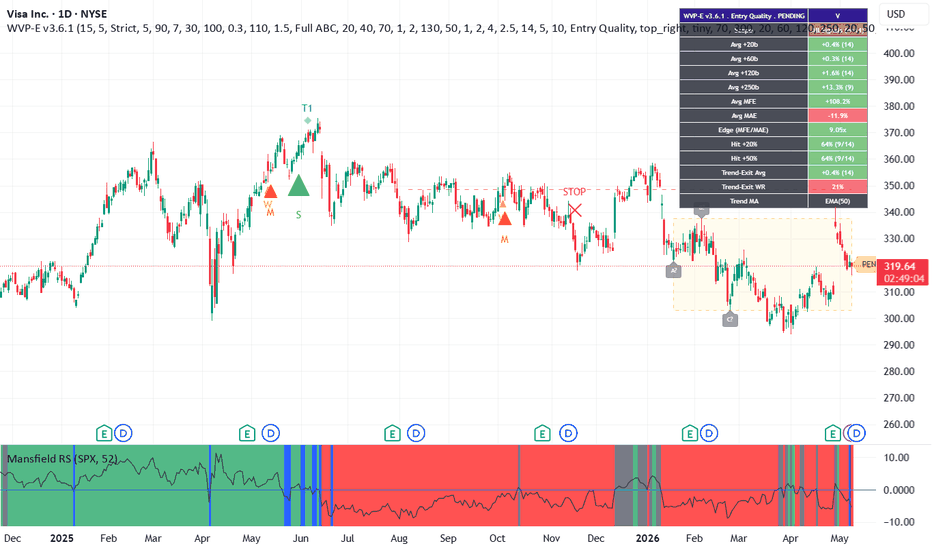
Flow-RegimeFlow-Regime
A multi-source flow oscillator. It normalizes three independent measures of
market flow to a unified ±100 scale and combines them into a conviction-
weighted composite line, so you can see at a glance whether OBV, A/D, and
price flow are agreeing or diverging.
▌ What's plotted
Three normalized lines, each computed through the same pipeline
(CCI → percentrank → linear map to ±100):
• OBV-Flow — On-Balance Volume (signed cumulative volume)
• AD-Flow — Chaikin Accumulation/Distribution
• Price-Regime — price flow (ohlc4)
Plus a Fitted composite — the average of the three, amplified by |conviction|,
where conviction = average ÷ mean(|x|, |y|, |z|). When all three lines agree
the composite is amplified; when they conflict it is suppressed toward zero.
The Fitted line uses 5-tier coloring driven by how many of the three exceed
the neutral threshold (default ±20): solid green/red = all three agree, lighter
shades = two of three, gray = no consensus.
▌ Two lookback modes
Linear (default) — TF-specific lookback with sensible per-timeframe defaults
(1m=60, 5m=24, 15m=16, 1h=24, 4h=18, 1d=7, 1w=12, 1M=12), all editable.
Anchored — pick an anchor timestamp; the percentrank window grows from 0 at
that bar to (current_bar − anchor_bar) at the right edge of the chart. Use
this to lock the statistical baseline to a specific event — a regime start,
a major breakout, a news release. The anchor bar is marked with a yellow
diamond at fitted = 0.
▌ How to read it
The OB zone (≥ +70) and OS zone (≤ −70) are shaded — these are statistically
stretched conditions. Bars where the Fitted line reaches ±99 get a soft red/
green background tint as an "at the extreme" warning. Two corresponding alert
conditions are exposed for use with TV alerts.
This indicator does NOT emit trade signals. Per-line reversal dots and
confluence triangles are intentionally absent: those patterns can fit
historical noise convincingly without generalizing forward. Treat extremes
as flags to investigate, not entries to take.
Useful interpretive frames:
• All three lines extreme in the same direction = strongest evidence of
flow consensus.
• One or two lines diverging from the others at extremes = a divergence
worth examining on the chart.
• Fitted approaching ±99 = statistical extreme, regardless of direction.
▌ Notes
In Anchored mode, the first few bars after the anchor have very few historical
points to rank against, so percentrank values can swing to ±100 from sparse
data — read these bars with caution. CCI itself always uses the full real
price history regardless of mode, so its 20-bar internal window is never
distorted by the anchor.
Enable the Debug label in settings to verify which mode and lookback are
currently active on the chart. อินดิเคเตอร์

AMD Absorption | AnonycryptousAmd Absorption | Anonycryptous
Description & user manual
Why this indicator is different
Most AMD indicators do the same thing. They draw a box for Asia, a box for London, a box for New York, and call it a cycle. They show you where the sessions are. They do not show you what is happening inside them.
Amd Absorption works differently.
It detects the full accumulation-manipulation-distribution cycle mechanically, bar by bar, within whatever session windows you define. It does not assume the cycle follows a fixed schedule. It finds it where it actually forms. And it only confirms a signal when the manipulation sweep shows evidence of institutional absorption — high volume on a bar that barely moves. That is the difference between a sweep that fails and a sweep that leads somewhere.
Most traders can look at a chart in hindsight and identify an AMD cycle. The challenge is identifying it in the moment, on any asset, at any time. That is what this indicator is built to do.
It works on every instrument. Crypto, futures, forex, stocks, commodities. The session windows, detection parameters, and absorption thresholds adapt to the asset class through a preset system. The same logic that detects a liquidity sweep on a bitcoin five-minute chart detects it on a gold two-minute chart, a nasdaq futures one-minute chart, or a forex fifteen-minute chart.
Important notice
Amd Absorption generates trading signals based on pattern detection and volume analysis.
These signals are not financial advice.
They do not predict the future.
They do not guarantee profitability.
All trading decisions are made entirely by the user.
Always manage your own risk. Always apply your own judgment.
1. Overview
Amd Absorption is a cycle detection and entry timing indicator built around three phases of price behavior: accumulation, manipulation, and distribution.
What it includes:
- Mechanical AMD cycle detection within configurable session windows
- Absorption filter on the manipulation bar using volume and body/range analysis
- Five asset class presets with individually tuned detection parameters
- Three-phase candle coloring showing accumulation, manipulation, and distribution in real time
- Absorption dot markers on qualifying manipulation bars
- Distribution target box with configurable stop loss mode and risk/reward ratio
- Volume-weighted price levels as structural reference and target zones
- Vertical session boundary lines at open and close
- Configurable session background colors
- Live dashboard showing session status, preset, last signal, and absorption statistics
- Alerts for bull and bear setups
2. The AMD cycle
2.1 Accumulation
A defined period of price compression. The market moves within a narrow range while smart money builds a position. Amd Absorption detects this as a rolling high-low range falling below a configurable percentage threshold over a set lookback period. During this phase, candles are colored gray.
2.2 Manipulation
After accumulation, price sweeps beyond the range boundary — above the high for a bearish setup, below the low for a bullish setup. This is the liquidity grab. Market orders resting beyond the range are collected. Stops are hit. Retail traders enter in the wrong direction. During this phase, candles are colored in the direction of the sweep — red for a bear sweep, green for a bull sweep.
2.3 Distribution
The real move begins. Price reverses from the sweep extreme and creates a fair value gap — a three-candle imbalance confirming displacement. The signal fires. A distribution target box is drawn from the entry close to the calculated take profit level. Candle coloring continues in the signal direction for the duration of the distribution box, then stops automatically.
The cycle can repeat multiple times within a single session. There is no hard limit on setups per session.
- A note on signal quality versus cycle validity
An AMD cycle that does not produce a signal triangle can still play out fully. The triangle means the manipulation bar showed mechanical absorption — volume confirmed, body was small. That is additional evidence of institutional presence at the sweep level. It raises conviction. It does not make setups without it invalid. Many clean AMD cycles complete without a qualifying absorption bar. The candle coloring will show the full cycle regardless. The triangle is a quality filter, not the only valid setup.
3. The absorption filter
The absorption filter is what separates Amd Absorption from a standard cycle detector.
A manipulation sweep can occur for many reasons. Not every sweep leads to a reversal. The ones that do tend to share a specific characteristic on the sweep bar itself: high volume combined with a small candle body relative to the bar's range.
This pattern means price moved far on heavy participation — a big wick — but the bar closed near where it opened. Something was absorbing the selling or buying pressure. The move did not follow through. That is absorption. It is the mechanical fingerprint of institutional defense of a level.
When the absorption filter is enabled, the signal only fires if the manipulation bar meets both conditions: volume above a configurable multiple of the rolling average, and a body-to-range ratio below a configurable threshold. Bars that qualify are colored in the absorption color and marked with a dot above or below the candle.
The filter can be disabled. With the filter off, every valid AMD + FVG pattern fires a signal. With it on, only the setups with volume confirmation fire. The trade-off is signal frequency versus quality.
4. Presets
Presets automatically configure the four core detection parameters — accumulation lookback, maximum range width, absorption volume multiplier, and absorption body ratio — for each asset class.
Crypto
Lookback: 15 bars. Range: 1.20%. Volume multiplier: 1.2×. Body ratio: 0.55.
Wider range tolerance for volatile 24/7 markets. Looser volume threshold because crypto volume behavior differs from traditional markets.
Futures
Lookback: 20 bars. Range: 0.40%. Volume multiplier: 1.4×. Body ratio: 0.45.
Tight range detection for institutionally driven instruments. Higher volume requirement to match the tick-level precision of futures order flow.
Forex
Lookback: 25 bars. Range: 0.25%. Volume multiplier: 1.3×. Body ratio: 0.50.
Longest lookback and tightest range for the slow, deliberate consolidations common in major pairs. Moderate volume threshold.
Stocks
Lookback: 22 bars. Range: 0.50%. Volume multiplier: 1.4×. Body ratio: 0.50.
Balanced settings between futures and forex. Works across individual equities and equity indices.
Commodities
Lookback: 22 bars. Range: 0.35%. Volume multiplier: 1.4×. Body ratio: 0.50.
Designed for gold, silver, oil, and similar instruments. Tighter than forex but more tolerant than futures. Handles institutional spikes well.
Custom
All four parameters are set manually in the Amd Logic and Absorption Filter groups. Use this when the presets do not match the behavior of a specific instrument or timeframe combination.
Note: the manipulation search window, FVG size filter, and ATR length are always set manually regardless of preset. These three parameters are active for all presets and can be adjusted freely.
5. Sessions
Amd Absorption detects AMD cycles only within active session windows. Outside of sessions, no accumulation is tracked, no sweeps are detected, and candle coloring is inactive. This prevents false setups forming during off-hours thin markets.
Three sessions are configurable: Asia, London, and New York. Each session has an independent toggle, a clock-picker for start and end time, and a background color. All session times are entered in your selected timezone, which can be set to any UTC offset from UTC-12 to UTC+12.
A thin vertical line marks both the opening and closing of each active session. This gives you a clear visual boundary for each session's cycle. The opening line and closing line use the same configurable color.
6. Distribution box
When a signal fires, a distribution target box is drawn from the entry bar forward. The box represents the expected move from entry to take profit.
Two stop loss modes are available:
Atr mode
Stop loss distance is calculated as ATR × the configured multiplier. This gives a consistent distance across all setups regardless of the exact FVG size. Useful for instruments where ATR matches your natural stop placement.
Fvg structure mode
Stop loss is placed at the outer edge of the FVG candle — above the FVG high for a bear setup, below the FVG low for a bull setup. This uses the actual market structure as the invalidation point, which is how many practitioners manage stops on this type of setup.
The take profit is calculated as: entry ± stop distance × RR ratio. The default ratio is 2.0, giving a 1:2 reward-to-risk setup. The ratio is adjustable.
The box width is fixed in bars. It does not track price. When the configured number of bars elapses, candle coloring for the distribution phase stops automatically. For position sizing and stop management, Risk Management Engine by Anonycryptous can be used alongside this indicator.
7. Price levels
Volume-weighted pivot highs and lows are drawn as horizontal reference lines. Pivot highs above current price act as resistance. Pivot lows below current price act as support. Each level shows its exact price value.
Line appearance reflects volume strength. A stronger volume reading at the pivot produces a more visible glow layer. Weaker pivots are more subdued.
Levels disappear automatically when price touches them. The maximum number of visible levels is configurable. These levels serve as structural context and potential distribution targets for confirmed signals.
8. Candle coloring
Amd Absorption colors candles to show the current phase of the cycle. The coloring is active only within session windows.
Gray — accumulation phase. Price is consolidating within the detected range.
Red (bear) or green (bull), dim — manipulation phase. A sweep has been detected and the indicator is searching for a confirming FVG. Colors the sweep candles and any subsequent candles until the FVG fires or the search window expires.
Absorption color (default purple) — absorption bar. A candle within the manipulation phase that meets both volume and body conditions. Also marked with a dot above or below the bar.
Red (bear) or green (bull), dim — distribution phase. Fires from the signal bar and continues until the distribution box width elapses.
Priority: absorption color overrides distribution, which overrides manipulation, which overrides accumulation.
9. Dashboard
The dashboard shows:
- Session — current active session or off
- Preset — active asset preset
- Last signal — direction of the most recent confirmed signal
- Last session — which session the last signal occurred in
- Abs / setups — absorption-confirmed signals vs total AMD setups detected
- Abs filter — whether the absorption filter is on or off
- Accumulation — current accumulation state: active, searching, or none
Position is configurable: top left, top right, bottom left, or bottom right. Size is configurable: tiny, small, or normal.
10. Settings reference
10.1 Sessions
- Timezone — utc offset for session time entry
- Asia / London / New York — toggle, time picker, background color per session
- Show session open lines — vertical lines at session open and close
- Session line color
10.2 Preset
- Asset preset — crypto / futures / forex / stocks / commodities / custom
10.3 Amd logic
- Accumulation lookback — bars used to measure consolidation range (custom only)
- Max accumulation range (%) — maximum range width to qualify (custom only)
- Manipulation search window — bars to search for a sweep after accumulation
- Min fvg size (atr multiplier) — minimum gap size for distribution confirmation
- Atr length — period for atr calculation
- Sl mode — atr or fvg structure
- Sl atr multiplier — stop distance multiplier in atr mode
- Rr ratio — reward-to-risk ratio for the distribution box
- Distribution box width (bars) — fixed bar width of the distribution target box
10.4 Absorption filter
- Enable absorption filter — toggle on/off
- Min volume multiplier — minimum volume relative to average (custom only)
- Max body/range ratio — maximum body-to-range ratio (custom only)
- Volume average length — lookback for rolling volume average
10.5 Price levels
- Show price levels — toggle on/off
- Pivot lookback — bars left and right to confirm a pivot
- Min volume multiplier — minimum volume at the pivot bar
- Volume average length — lookback for volume average
- Support level color — color for pivot lows
- Resistance level color — color for pivot highs
- Max levels shown — maximum number of visible levels
10.6 Visuals
- Show accumulation box
- Show manipulation box
- Show fvg box
- Show entry signal
- Bull color — color for bullish setups and signals
- Bear color — color for bearish setups and signals
- Absorption color — color for absorption bar highlight and dot
- Distribution color — candle color during the distribution phase
10.7 Dashboard
- Show dashboard
- Position
- Size
11. How to use
11.1 Initial setup
1. Select the preset that matches your instrument.
2. Set your timezone to match your location or preferred session reference.
3. Enable the sessions you trade. Set the times to match the actual session opens for your timezone.
4. Choose a stop loss mode. Fvg structure is the more precise option. Atr is more consistent if FVGs on your timeframe vary significantly in size.
5. Set your RR ratio. Default 2.0 is a starting point — adjust to your own risk management rules.
6. If using the custom preset, start with the preset values as a reference and tune from there.
11.2 Reading the chart
Look at the session background. Once a session opens, accumulation detection begins.
When candles turn gray, accumulation is active. The indicator has found a range that qualifies as consolidation. This is the waiting phase.
When candles turn red or green, a sweep has been detected. The indicator is now looking for a confirming FVG. This is the alert phase — something is happening.
When a purple (or absorption-colored) candle appears with a dot, the sweep bar showed absorption. This is the highest-quality moment within the manipulation phase. A signal is likely imminent if a FVG forms on the next bars.
When a signal triangle fires, the full AMD cycle has confirmed with FVG and absorption. The distribution box appears showing the entry level and target.
11.3 Illustrative bull scenario
Educational example only. Not a trading recommendation.
Session opens. Candles turn gray — accumulation detected between two levels. After several bars, price dips below the accumulation low on a high-volume candle that closes near its open. The candle colors purple. A dot appears below it. Two bars later, a gap forms above — price has displaced back through the range. A green triangle fires below the entry bar. The distribution box extends to the right showing the 1:2 target. A support level line sits just below the sweep low confirming the structural context.
11.4 Illustrative bear scenario
Educational example only. Not a trading recommendation.
Session opens in London. Candles turn gray — a tight consolidation forms. Price spikes above the range high on elevated volume. The spike candle has a large wick and closes back below the high — body is less than 40% of the bar range. The candle turns purple. A dot appears above it. A FVG opens below. A red triangle fires above the entry bar. The distribution box drops from entry toward the calculated take profit. A resistance level hovers just above the sweep high.
11.5 Using the absorption filter
With the filter on, the signal only fires when the manipulation sweep bar shows mechanical absorption. This reduces total signals but increases the average quality of what does fire. The dashboard shows abs / setups — how many confirmed absorptions versus total AMD patterns detected. A ratio of 1/5 is normal. The filter is stricter by design.
With the filter off, every valid AMD + FVG pattern produces a signal regardless of volume. Use this to explore how many setups form on your instrument before deciding whether the absorption requirement is helping or filtering too aggressively.
Regardless of filter setting, the candle coloring always shows the full AMD cycle. A setup without a triangle is still visible through the gray accumulation, the colored manipulation phase, and the FVG box. Traders who want to act on every AMD cycle can use the visual coloring as their cue and treat the triangle as an additional confirmation rather than a requirement.
11.6 Timeframe guide
- 1m–3m: scalp setups. Absorption filter on. Tight preset (futures or commodities).
- 5m–15m: intraday setups. All presets apply. Standard settings.
- 30m–1h: swing context. Manipulation window and accumulation lookback can be increased.
- 4h and above: macro context only. Signals will be infrequent. Use to identify major cycle pivots.
12. Tips
The manipulation search window is your primary tuning lever. If the indicator misses setups you can see visually, increase the manipulation window. If it produces setups that do not look like genuine sweeps, tighten the range width or increase the volume multiplier.
The absorption filter is directional. A bear sweep that qualifies will have a large upper wick and a small body. A bull sweep that qualifies will have a large lower wick and a small body. If you see a purple dot on a bar with a small wick, the volume threshold is too low — raise the min volume multiplier.
Price levels are structural context, not signals. Use them to assess whether a distribution target has a logical resting point — a prior support or resistance level aligned with the take profit zone strengthens the setup.
Multiple AMD cycles can form within a single session. The state resets after each completed cycle. If an accumulation forms but no sweep follows within the search window, the state clears automatically and the indicator waits for the next consolidation.
Candle coloring stops at the session close. If candles outside the session boundaries show unexpected colors, check that your session times are correctly set for your timezone.
13. Disclaimer
This indicator is provided for educational and informational purposes only. Nothing in this document constitutes financial advice or any form of recommendation. Trading financial instruments involves substantial risk of loss. Past performance is not indicative of future results. You may lose all of your invested capital.
Anonycryptous accepts no responsibility or liability for any losses incurred as a result of using this indicator.
อินดิเคเตอร์
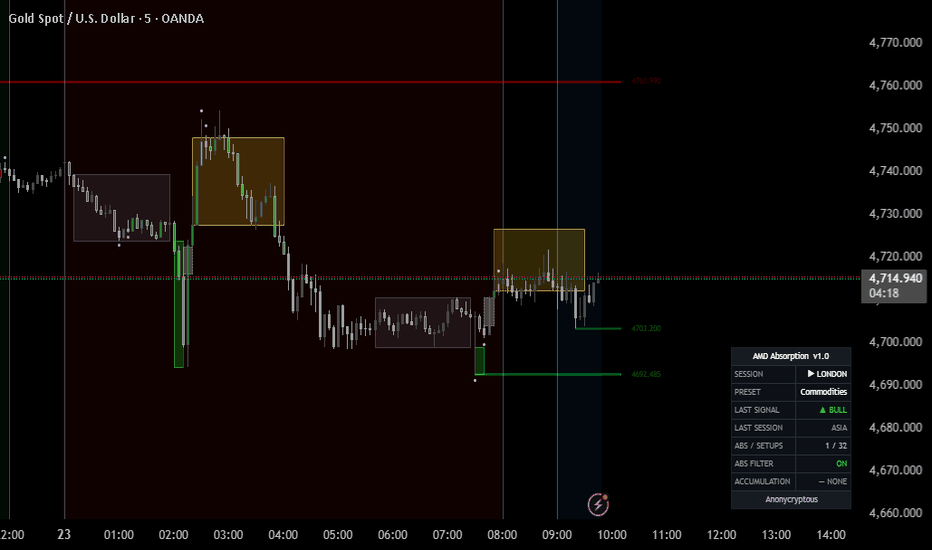
Gaussian Channel System [GCS]## DESCRIPTION
Gaussian Ribbon Engine (GRE) is a multi-layer trend analysis system built on the Arnaud Legoux Moving Average (ALMA), which applies a Gaussian (bell curve) weighting function to price data instead of the linear or exponential weights used by traditional moving averages.
**Mathematical Foundation**
ALMA uses a Gaussian kernel — the same bell-curve distribution found in statistics and physics — to weight the prices in its lookback window. The Gaussian function is parameterized by two values: offset (which shifts the bell curve left or right, controlling responsiveness vs. smoothness) and sigma (which controls the width of the bell curve, determining how sharply weights decay from the center). The formula applies: w(i) = exp(-((i - offset * (N-1))^2) / (2 * sigma^2 * N^2)), where each price bar receives a weight according to its position on the Gaussian curve. This produces a moving average with mathematically optimal noise filtering properties.
GRE constructs five ALMA layers with increasing periods (default 9, 21, 55, 100, 200), creating a visual ribbon. When all five layers align in order (fastest on top for bullish, fastest on bottom for bearish), the market is in full directional agreement. The spread between the outermost layers, measured as a percentage and compared to its own historical average, identifies squeeze (convergence) and expansion (divergence) conditions.
**9-Point Confluence Scoring**
The scoring matrix evaluates: price vs. Layer 1, Layer 1 vs. 2, Layer 2 vs. 3, Layer 3 vs. 4, Layer 4 vs. 5 alignment, Layer 1 slope direction, Layer 3 slope direction, RSI above/below 50, and DI+/DI- directional movement. Signals fire when the score crosses the configurable threshold with ADX confirmation.
**Features**
- Five-layer ALMA ribbon with Gaussian kernel weighting
- Adjustable offset (0-1) and sigma parameters for fine-tuning the Gaussian bell shape
- Ribbon spread analysis with squeeze and expansion detection
- 9-point confluence scoring with visual dot notation in dashboard
- ATR-based dual take-profit levels (TP1 and TP2)
- Squeeze breakout signals when ribbon compresses then expands
- ADX and volume confirmation filters
- Full color-coded dashboard with regime classification
- Multiple alert conditions
--- อินดิเคเตอร์

อินดิเคเตอร์

อินดิเคเตอร์

A/D Line with Adaptive Strength BandsThis indicator analyzes the Accumulation/Distribution (A/D) line using a normalized linear regression slope over a rolling lookback period that can adjust automatically to the chart timeframe. The A/D line is built from price and volume, with each bar contributing positive or negative money flow depending on where the close falls within the bar’s range. The script then smooths the A/D line with an EMA and applies a linear regression to estimate its underlying trend.
A key feature of the script is its adaptive lookback. In Auto mode, the regression length adjusts by timeframe so the indicator remains responsive on intraday charts, balanced on daily charts, and not overly slow on weekly or monthly charts. In Manual mode, the user can set a fixed lookback length.
Rather than using the raw regression slope alone, the script normalizes the slope by dividing it by the standard deviation of the smoothed A/D line over the same lookback window. This is important because the A/D line is cumulative, so its raw values can become very large and are not directly comparable across different stocks, sectors, or timeframes. A raw slope that appears meaningful on one chart may be insignificant on another simply because the scale of the A/D line is different.
Normalization solves that problem by expressing the trend relative to the A/D line’s own recent variability. In other words, it shows whether the current slope is strong or weak compared with that stock’s normal behavior. This makes the indicator more informative than a simple endpoint comparison and more useful for comparing the strength of accumulation or distribution across various stocks.
The output is classified into bands such as Strong Accumulation, Accumulation, Neutral, Distribution, and Strong Distribution. The A/D line and its EMA are plotted as thin reference lines, while the regression slope line is highlighted to make the dominant money-flow trend easier to see. The result is a cleaner visual tool for identifying improving or weakening accumulation/distribution and for comparing relative money-flow strength across different securities.
อินดิเคเตอร์

อินดิเคเตอร์