อินดิเคเตอร์
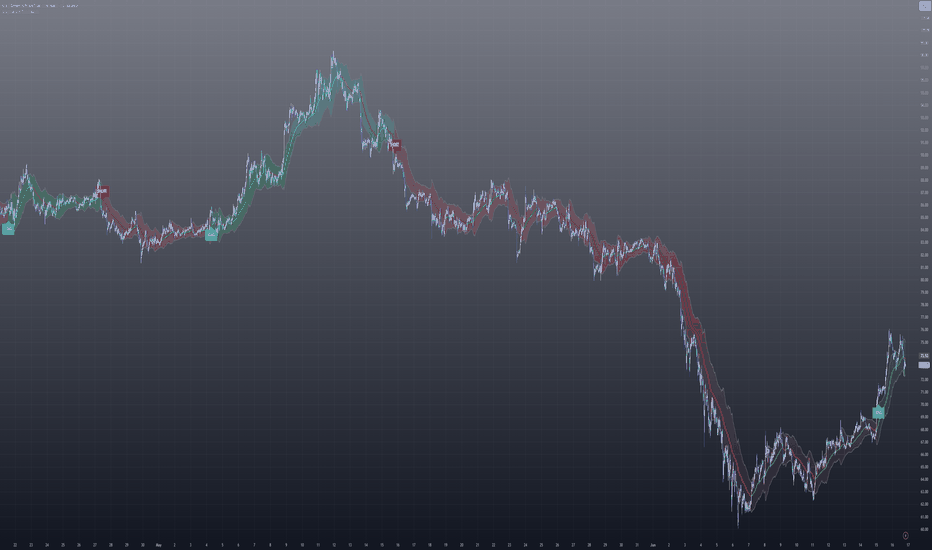
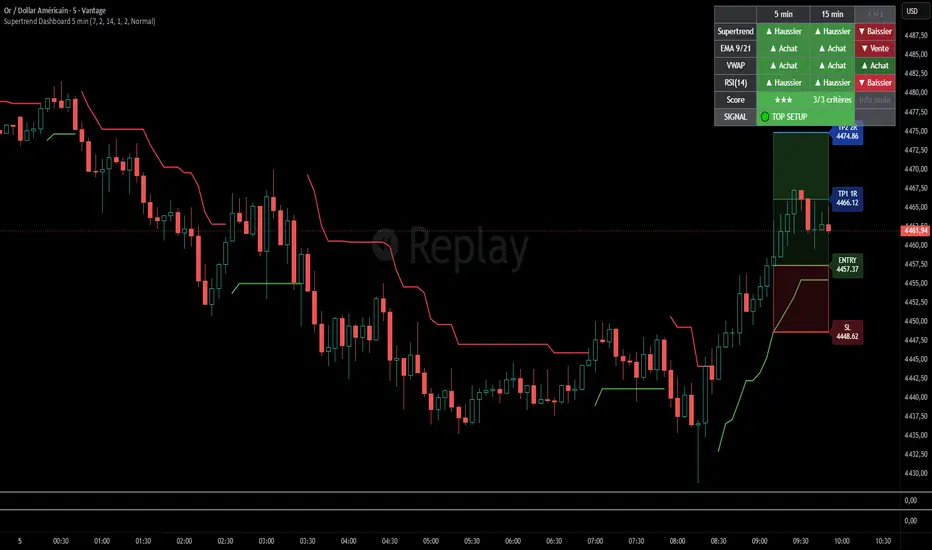
Tightening Trailing Stop LossA utility tool to independently simulate a Trailing Stop based on ATR and Recent Candle Structure. It's most helpful if you only want something to independently trail a Stop and nothing else. For example, if you decide where to enter via a discretionary system, but like trailing Stops via code.
It's used by changing the 'Start Date' to the date where you wish to enter. It'll then display a Stop and Trail it, until it intersects with a candle. The Indicator will hide itself when it intersects with a candle to avoid cluttering the chart. It only moves in the direction of risk, so that means that, when set, it'll never increase the risk of your trade, unlike simple ATR bands. However, it does require resetting manually for each trade.
By Default, it uses a 10 Period RMA ATR, which is set 0.5 ATR away from the Low/High of the recent candle structure. It'll tighten each candle by multiplying it's value with .95, meaning it always tightens a little. All of these can be changed in the settings to match your preferred method of Setting/Trailing Stops
อินดิเคเตอร์

Camarilla Pivot Plays - MaazCamarilla Pivot Plays - Maaz is a institutional-grade quantitative workspace engine engineered for active intraday equity and futures traders. Designed to strip out raw market noise and address the flaws of standard layout pivot scripts, this system delivers an institutional-level view of daily support, resistance, and breakout structures based on Thor Young's classic trading playbook.
The indicator is split into two major algorithmic engines:
1. The Multi-Session Historical Alignment Engine
Unlike generic pivot indicators that pull simple daily data bars (often mixing regular and extended hours incorrectly), this script utilizes a complex multi-session memory snapshot pipeline. By calculating historical session boundaries and tracking extended-hours shifts (useEthForCams), the plots shift step-heights at the exact structural bars required to match professional configurations. It provides clean, un-cluttered stepline plots for:
CP (Central Pivot): The ultimate directional anchor boundary for the session.
R3 / S3: The dynamic range boundaries defining institutional value and traversal reversion loops.
R4 / S4: The critical breakout launchpads where institutional short squeezes or liquidations occur.
R6 / S6: Ultimate daily mathematical expansion targets.
2. The Integrated Precision HUD Panel
The system bypasses standard chart-clipping errors by embedding a stacked, comprehensive workspace dashboard in the top-right corner of your screen. This HUD continuously reads live price metadata to evaluate and display:
Trend Range Bias: Classifies the session macro structure as Higher Range, Lower Range, or Neutral.
Volatility Coiling Status: Classifies the pivot width as Wide or Narrow to instantly tell you whether you are in a range-fading or trend-breakout environment.
Suggested Play Actions: Tells you exactly what setup to watch for (e.g., Watch R4 for Outright Breakout Long) or shifts to bright yellow execution flags (TRIGGER ACTIVE) when levels break.
Pre-Calculated Target Prices: Explicitly states your Planned Entry Pivot Level and Planned Target Exit Level directly inside the table before the trade even triggers.
Institutional Filters: Provides live readouts of Daily Average True Range (ATR), Relative Volume (RVOL) to confirm big block-order breakouts, and an Institutional Net Flow Index tracking raw buy/sell delta pressure. อินดิเคเตอร์

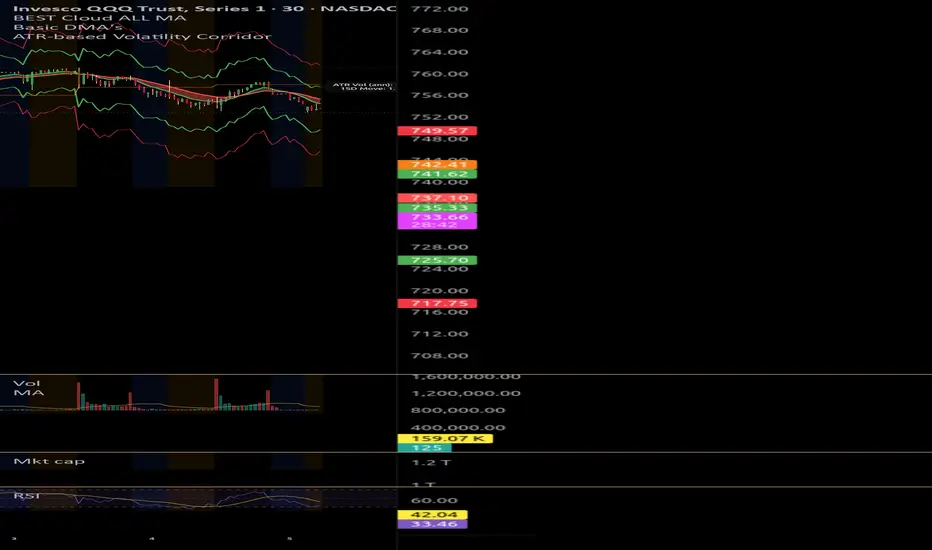
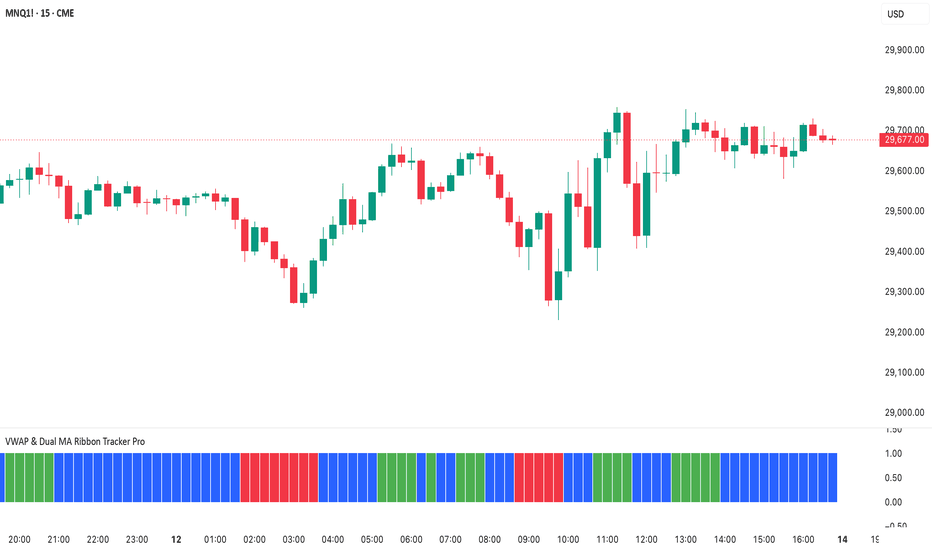
VWAP & Dual MA Ribbon Tracker ProThe Master Trigger Breakdown
* For Longs (Green): The 4 EMA must be above the VWAP. If the 4 EMA is below the VWAP, a long trade is completely blocked, no matter how bullish the rest of the chart looks.
* For Shorts (Red): The 4 EMA must be below the VWAP. If the 4 EMA is above the VWAP, a short trade is completely blocked.
The Complete Logic Chain (How it fits together)
Your indicator only gives a trading color when all three layers of your rules agree with that master trigger:
1. The Structural Trigger: Is the 4 EMA on the correct side of VWAP? (Above for Long / Below for Short)
2. The Momentum Confirmation: Is the 4 EMA accelerating away from the 9 EMA? (Above 9 EMA for Long / Below 9 EMA for Short)
3. The Institutional Force: Is the Elder Force Index (EFI) confirming the volume pressure? (Above 0 for Long / Below 0 for Short)
If any single one of these three layers disagrees, the master trigger pulls the plug and forces the ribbon to stay Blue (No Trading).
How the ATR Cushion Protects Your NASDAQ Trades
In the script, the ATR calculation creates a dynamic "buffer zone" around the VWAP and the 9 EMA.
* For Longs (Green): The 4 EMA can’t just be a fraction above the VWAP and 9 EMA. It must clear both of them by a margin of 0.2 * ATR.
* For Shorts (Red): The 4 EMA must drop below the VWAP and 9 EMA by a margin of 0.2 * ATR.
Why This Asset-Specific Math is Important
The NASDAQ's range changes drastically throughout the day.
* At 9:30 AM EST (NY Open): The market is highly volatile. The ATR expands because the bars are large. The indicator automatically widens the cushion so you don't get trapped by massive, wild price swings.
* At 1:00 PM EST (Lunch Hour): The market slows down. The ATR shrinks because the bars are small. The indicator automatically tightens the cushion so you can still catch a genuine, breakout move if it happens.
How to Tune It in Your Settings
If you feel the indicator is reacting perfectly but missing the exact start of a move, you can adjust the ATR Multiplier Cushion input:
* Lower it to 0.1: Makes the indicator more aggressive, giving you faster entries but a slightly higher risk of a false signal.
* Raise it to 0.3: Makes the indicator more conservative, filtering out more noise but delaying your entry.
* Turn it off: Uncheck the "Use ATR Cushion Filter" box in your settings to see the pure EMA rules without any volatility buffer.
Volume
This upgraded system swaps out rigid, raw volume for the Elder Force Index (EFI). Instead of blindly measuring how many shares were traded, the indicator now calculates true institutional momentum by multiplying volume against net price direction. This ensures you get highly accurate signals on the NASDAQ without missing trades during steady, trending moves.
Visual Layout & Interface
* Upper Main Chart: Your candles, the VWAP line, the 4 EMA, and the 9 EMA remain active here to map structure.
* Lower Separate Panel: Houses your solid color-blocked ribbon, updating instantly as the trend and market force align.
The 3 Market States & Color Codes
* 🟩 SOLID GREEN (Premise to Go Long)
* The Structural Rule: The 4 EMA is above the VWAP AND above the 9 EMA (plus your ATR cushion).
* The EFI Filter: The 13 or 2-period smoothed Elder Force Index must be above 0.
* Market Context: Buyers are in absolute control. The trend has broken out, and it is actively backed by positive institutional buying power.
* 🟥 SOLID RED (Premise to Go Short)
* The Structural Rule: The 4 EMA is below the VWAP AND below the 9 EMA (minus your ATR cushion).
* The EFI Filter: The 13 or 2 setting-period smoothed Elder Force Index must be below 0.
* Market Context: Sellers are dominant. Price is aggressively pushing lower, backed by true institutional distribution force.
* 🟦 SOLID BLUE (No Trading / Neutral Zone)
* The Rule: Triggered if the EMAs conflict OR if the EFI doesn't match the price direction (e.g., the 4 EMA pushes up, but EFI is below 0).
* Market Context: Weak, diverging, or manipulative market action. This protects your capital by sidelining you when the NASDAQ is trying to trap retail breakout buyers.
อินดิเคเตอร์
อินดิเคเตอร์

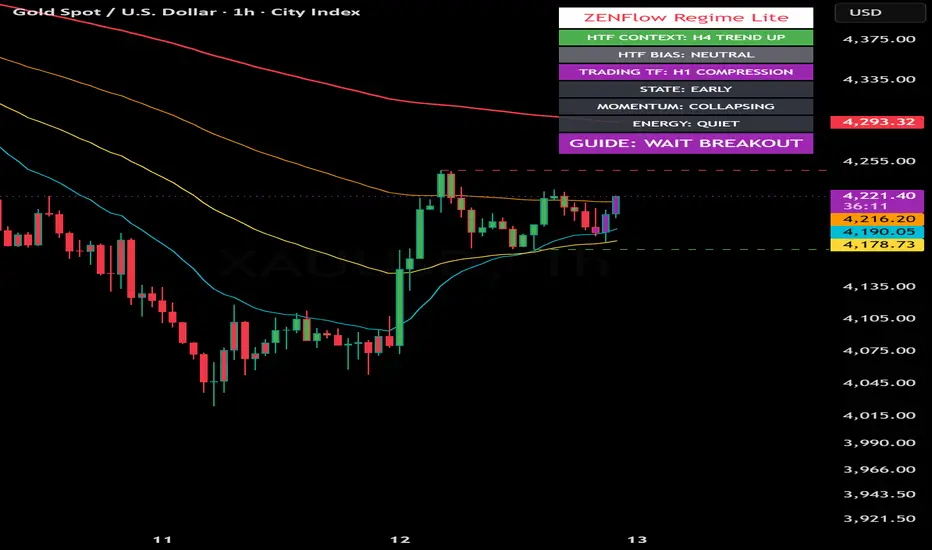
ZENFlow Regime Lite | Market Context GuideZENFlow Regime Lite | Market Context Guide
ZENFlow Regime Lite is an open-source market regime and context-reading indicator designed to help traders understand the current market environment before looking for trade setups.
The main idea behind this script is simple:
Read the market first.
Then decide whether the market is trending, ranging, compressing, or unclear.
This Lite version is designed as a beginner-friendly market context guide. It does not provide direct entry, stop-loss, or take-profit levels. Instead, it helps users identify the broader condition of the market so they can make more informed decisions using their own trading method.
Core Concept
Many traders start by asking:
Should I buy?
Should I sell?
Where is the entry?
ZENFlow Regime Lite starts from a different question:
What kind of market are we in right now?
The indicator uses a multi-timeframe context approach. It reads the current chart timeframe together with a higher timeframe context to help classify the market into broad conditions such as trend, range, compression, chop, or breakout-watch environments.
What This Indicator Shows
HTF Context
The higher timeframe context helps users understand the broader market environment.
Examples:
• Trend Up
• Trend Down
• Range
• Compression
• Chop
HTF Bias
The bias row summarizes whether the higher timeframe favors long, short, range mode, breakout watch, or neutral conditions.
Examples:
• Long Bias
• Short Bias
• Range Mode
• Wait Breakout
• Neutral
Trading Timeframe Regime
The script also reads the current chart timeframe to show whether the trading timeframe is trending, ranging, compressing, or choppy.
Market State
The state classification helps users understand the phase of the move.
Examples:
• Early
• Healthy
• Mature
• Exhaustion
Momentum
Momentum is based on directional pressure and DI gap behavior.
Examples:
• Rising
• Strong
• Fading
• Collapsing
Energy
Energy is based on ATR behavior compared with its baseline.
Examples:
• Quiet
• Normal
• Expanding
• Extreme
Guide
The Guide row provides a broad market-reading suggestion.
Examples:
• Follow Long Bias
• Follow Short Bias
• Avoid Chase
• Range Market
• Wait Breakout
• Wait
The Guide is not an entry signal. It is a market-context summary.
Calculation Logic
ZENFlow Regime Lite combines several market components:
• ADX and DI
Used to detect trend strength and directional pressure.
• Bollinger Band Width
Used to identify range and compression conditions.
• ATR and ATR Baseline
Used to measure volatility and market energy.
• Stochastic
Used as part of state and exhaustion interpretation.
• Multi-Timeframe Context
Used to compare the current chart timeframe with a higher timeframe environment.
The purpose of combining these components is to avoid reading price action from a single signal only. The script is designed to provide a broader context before trade planning.
How to Use
Start with HTF Context
Check whether the higher timeframe is trending, ranging, compressing, or choppy.
Read HTF Bias
Use this to understand whether the broader environment favors long, short, range, breakout watch, or neutral behavior.
Check the Trading Timeframe
Compare the current chart timeframe with the higher timeframe. Alignment between both timeframes usually provides a cleaner reading.
Read State, Momentum, and Energy
These rows help determine whether the current move is still developing, healthy, late, or losing strength.
Use the Guide row carefully
The Guide row is only a broad context suggestion. It should not be treated as an automatic buy or sell instruction.
Suggested Interpretation
A stronger long-side context may appear when:
• HTF Bias favors Long
• Trading timeframe is also Trend Up
• State is Early or Healthy
• Momentum is Rising or Strong
• Energy is Normal or Expanding
A stronger short-side context may appear when:
• HTF Bias favors Short
• Trading timeframe is also Trend Down
• State is Early or Healthy
• Momentum is Rising or Strong
• Energy is Normal or Expanding
A caution condition may appear when:
• State is Mature or Exhaustion
• Momentum is Fading or Collapsing
• Energy is Extreme
• The market is in Range, Compression, or Chop
• Price has already moved too far and the Guide shows Avoid Chase
What This Lite Version Does Not Include
This Lite version is intentionally limited to broad market-regime reading.
It does not include:
• Final Plan
• Action row
• ZSS setup events
• CHoCH / BOS engine
• Liquidity target engine
• Entry / Stop-loss / Take-profit planner
• Tactical reversal layer
• Trade execution system
This keeps the script simple, educational, and suitable for users who want to learn how to read market context first.
Alerts
The script includes broad context alerts such as:
• Follow Long Bias
• Follow Short Bias
• Avoid Chase
• Range Market
• Wait Breakout
• Wait
These alerts are designed to notify users when the market context changes. They are not standalone trade signals.
Recommended Use
ZENFlow Regime Lite can be used as:
• A market-regime dashboard
• A trend/range/compression context reader
• A top-down market filter
• A learning tool for reading market condition
• A companion to a trader’s own entry method
Limitations
This indicator does not predict future price movement.
It does not guarantee profitable trades.
It does not replace risk management.
It should not be used as a standalone trading system.
Market behavior can change quickly, especially during news events, low-liquidity periods, or highly volatile conditions.
All trading decisions remain the responsibility of the user.
Educational Use Only
This script is intended for educational and analytical use only.
It is not financial advice.
──────────────────── อินดิเคเตอร์

ADR percentage Completion Table Real-Time Daily Range Tracker ET📊 ADR % Completion Table
Track how much of the Average Daily Range (ADR) has been consumed in real time — works correctly on every timeframe from 1 minute to weekly.
─────────────────────────────────
🔍 WHAT IT DOES
─────────────────────────────────
This indicator calculates the 14-day Average Daily Range and compares it to the current day's high-to-low range, showing you exactly what percentage of the ADR has been reached so far today.
The daily session resets at 00:00 UTC-4 (New York midnight), making it ideal for forex, indices, and US equity traders.
─────────────────────────────────
📋 TABLE DISPLAY
─────────────────────────────────
- ADR (14d) — the average daily range over the last 14 completed days
- Day High / Day Low — intraday extremes since session open (00:00 UTC-4)
- Today Range — current high-to-low range in price points
- ADR % — percentage of ADR consumed (color-coded)
- Remaining — how many points are left to complete the ADR
─────────────────────────────────
🎨 COLOR CODING
─────────────────────────────────
🔘 Grey → 0–49% (early in the day)
🔵 Blue → 50–74% (halfway through)
🟠 Orange → 75–99% (nearing completion)
🟢 Green → 100%+ (ADR fully reached)
─────────────────────────────────
⚙️ SETTINGS
─────────────────────────────────
- ADR Lookback — customize the number of days (default: 14)
- Table Position — 8 placement options
- Text Size — Tiny to Huge
- Show/hide Day High & Low lines on the chart
─────────────────────────────────
✅ KEY FEATURES
─────────────────────────────────
✔ Timeframe-independent — ADR value is identical on 1m, 15m, 1h, 4h, and daily charts
✔ Session-accurate — day range always starts at 00:00 UTC-4 regardless of chart timezone
✔ Clean overlay table — no clutter, just the numbers that matter
✔ Works on all instruments — forex pairs, indices, stocks, futures, crypto
─────────────────────────────────
💡 HOW TO USE IT
─────────────────────────────────
When ADR % is low (grey/blue) early in the session, the market still has room to move. When it reaches orange or green, price has covered most or all of its expected daily range — useful for managing targets, avoiding late entries, and timing exits.
Best used alongside your existing strategy as a context filter, not a standalone signal.
อินดิเคเตอร์

อินดิเคเตอร์

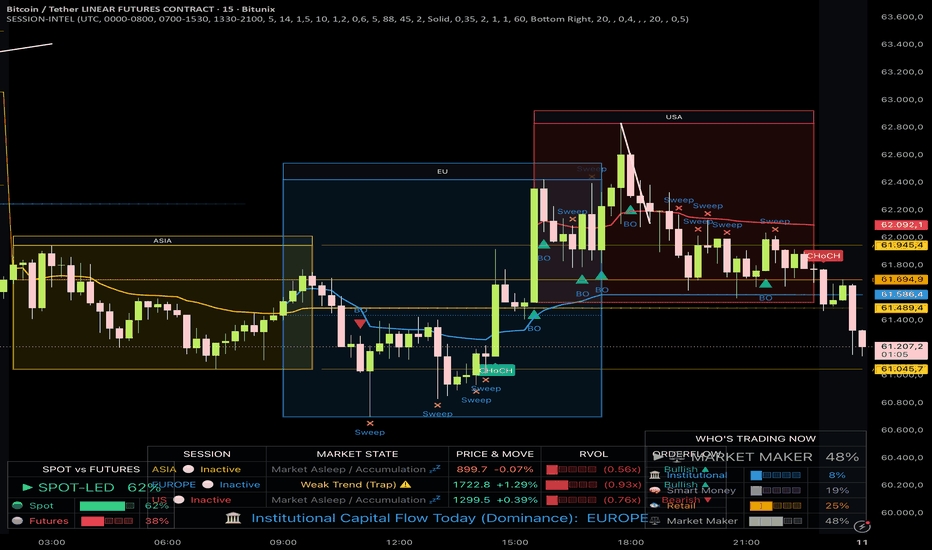
Session Intelligence Architecture [Microstructure]SESSION INTELLIGENCE ARCHITECTURE
An institutional-grade session & market-structure overlay for crypto.
━━━━━━━━━━━━━━━━━━━━━━━━━━━━━━━━━━━━━━━━━━
WHAT IT DOES
━━━━━━━━━━━━━━━━━━━━━━━━━━━━━━━━━━━━━━━━━━
Crypto trades 24/7, but it "breathes" in three waves — Asia, Europe and the US.
Each session has its own character. This indicator marks those sessions directly on
your chart and translates institutional metrics into clear, jargon-free signals.
It answers three questions at a glance:
• Who is in control right now — buyers or sellers?
• Is a move real, or just a liquidity trap?
• Which session is actually driving the market today?
━━━━━━━━━━━━━━━━━━━━━━━━━━━━━━━━━━━━━━━━━━
ON-CHART VISUALS
━━━━━━━━━━━━━━━━━━━━━━━━━━━━━━━━━━━━━━━━━━
• Session Boxes — a live, growing rectangle clamped to each session's high & low
(yellow = Asia, blue = Europe, red = US). The active box border turns SOLID & thicker
when a strong, volume-backed move is underway, and DASHED when the market is quiet.
• Session VWAP — an anchored fair-value line per session that fades out after close.
• Open / Equilibrium Line — a dotted line at each session's opening price.
• Sweep & Breakout Markers — ✕ for liquidity sweeps (stop hunts), ▲/▼ triangles for
genuine structural breakouts of the Asia range.
• Focus Mode — gently dims the gaps between sessions so the active session pops.
━━━━━━━━━━━━━━━━━━━━━━━━━━━━━━━━━━━━━━━━━━
THE ENGINE (why it's different)
━━━━━━━━━━━━━━━━━━━━━━━━━━━━━━━━━━━━━━━━━━
• ATR-NORMALIZED, not static %. A move is only flagged as a "Significant Expansion"
when |Close − Open| exceeds a multiple of the current ATR(14). This adapts to
volatility instead of using a fixed, one-size-fits-all percentage.
• SESSION-SPECIFIC RVOL. Each session's cumulative volume is compared against the
average of the last 10 SAME-type sessions (Asia vs Asia, US vs US). Above the
threshold = institutional drive; below = suspect.
• LIQUIDITY SWEEP vs. BREAKOUT. A wick beyond the Asia high/low that closes back
inside is tagged as a trap. A close outside with an expansion body (≥60% of range)
is tagged as a real breakout.
━━━━━━━━━━━━━━━━━━━━━━━━━━━━━━━━━━━━━━━━━━
THE DASHBOARD (bottom-center)
━━━━━━━━━━━━━━━━━━━━━━━━━━━━━━━━━━━━━━━━━━
One row per session, read left to right:
• SESSION — name + status (🟢 Active / ⚪ Inactive)
• MARKET STATE — plain language, color-coded:
🚀 Buyer Dominance (Strong) — expansion up + valid volume
🩸 Seller Dominance (Strong) — expansion down + valid volume
⚠️ Weak Trend (Trap) — expansion without volume (fake-move protection)
💤 Market Asleep / Accumulation — price still inside the ATR threshold
• PRICE & MOVE — session range + net % change
• RVOL — a 5-block progress bar (████░) with the raw ratio, e.g. (1.45x)
• ORDERFLOW — Bullish ▲ / Bearish ▼ based on price vs. session VWAP
Plus a merged bottom row: today's dominant session by combined volume & expansion.
━━━━━━━━━━━━━━━━━━━━━━━━━━━━━━━━━━━━━━━━━━
ALERTS
━━━━━━━━━━━━━━━━━━━━━━━━━━━━━━━━━━━━━━━━━━
• "Breakout detected" — fires once per bar close (confirmed, no repaint).
• "Liquidity Sweep detected" — fires once per bar (sweeps often form intrabar).
━━━━━━━━━━━━━━━━━━━━━━━━━━━━━━━━━━━━━━━━━━
SETTINGS OVERVIEW
━━━━━━━━━━━━━━━━━━━━━━━━━━━━━━━━━━━━━━━━━━
① Sessions — timezone + the three session windows + historical lookback (days)
② Engine — ATR length & multiplier, RVOL lookback & threshold
③ Market Structure — breakout body ratio, toggle sweeps/breakouts
④ Visualization — colors, line widths, box fill color & saturation,
VWAP fade-out, Focus Mode + dim color, and on/off toggles for every element
━━━━━━━━━━━━━━━━━━━━━━━━━━━━━━━━━━━━━━━━━━
HOW TO USE
━━━━━━━━━━━━━━━━━━━━━━━━━━━━━━━━━━━━━━━━━━
Best on intraday timeframes (5m–1h), where sessions are most meaningful. Watch the
dashboard for the current regime, use the Asia range + sweep/breakout markers for
structure, and the VWAP/orderflow bias to gauge who has the upper hand.
This script is an analysis tool, not financial advice. Always do your own research
and manage risk. Past behavior does not guarantee future results. อินดิเคเตอร์
Velocity Breakout Strategy (VBS)Overview
The Velocity Breakout Strategy (VBS) is a comprehensive, institutional-grade swing trading system designed to identify high-probability momentum shifts. Rather than relying on a single lagging indicator, VBS synthesizes five distinct dimensions of market data: Macro Trend, Market Structure, Smart Money Concepts (SMC) valuation, Volatility (ATR/ADX), and Intrabar Volume Delta.
The goal of VBS is to filter out low-probability "chop" and only trigger entries when structural momentum aligns with aggressive buying volume.
Core Mechanics & Underlying Logic
1. Trend & Gradient Cloud Baseline The foundation of VBS is a multi-timeframe moving average system utilizing a Micro (9), Fast (20), and Slow (50) EMA. The relationship between the Fast and Slow EMAs paints a dynamic Gradient Cloud, instantly visualizing the macro trend.
2. Intrabar Volume Delta Estimation Standard volume tells you how much was traded, but not who was in control. VBS includes a custom Volume Delta Estimation engine. It approximates buying vs. selling pressure within a single candle by analyzing where the candle closes relative to its total high-to-low range.
The Filter: VBS can be configured to strictly block any buy signals if the current candle exhibits negative Delta (where estimated selling pressure outweighs buying pressure), preventing entries into hidden institutional distribution.
3. Smart Money Concepts (SMC) Valuation Zones VBS calculates a rolling 100-bar Dealing Range to map out institutional liquidity. It splits this range to identify "Premium" (overvalued) and "Discount" (undervalued) zones. The strategy actively looks for pullback entries (Reloads) when the asset drops into the Discount zone.
4. Volatility & Dynamic ATR Trailing Stops Risk management is handled by a responsive ATR Trailing Stop that adapts to the Average Directional Index (ADX).
During trending phases, the ATR multiplier is wide to let the trade breathe.
When the ADX detects a volatility "Squeeze" (ADX < 20), VBS dynamically tightens the ATR multiplier, protecting profits before a sudden volatile expansion occurs.
5. Master Candle Consolidation VBS scans for extreme volatility contraction using a "Master Candle" concept. If the price prints 4 consecutive bars entirely within the High/Low bounds of a previous Master Candle, the system arms a Breakout Trigger.
Entry Signals (When to Buy)
VBS generates specific, visual entry signals on the chart:
A+ Buy (Lime Triangle): A Golden Cross (20/50 EMA) occurs simultaneously with a verified Higher Low in market structure, backed by positive volume delta.
Risky Buy (Orange Triangle): A Golden Cross occurs, but the strict Higher Low market structure is not yet confirmed.
Bullish Reload (Blue Arrow): A zero-lag pullback entry. Price dips into the SMC Discount zone, touches the Fast EMA, and sweeps liquidity (long lower wick), closing with positive delta.
Consolidation Breakout (Purple Arrow): Price violently breaks the bounds of a 4-bar Master Candle consolidation in the direction of the macro trend.
Exit Strategy (When to Sell)
ATR Trail Exit (Red Down Triangle): The primary exit. Triggers when price closes below the dynamic ATR Trailing Stop.
Macro Break: A failsafe exit triggered if a Death Cross (20 EMA crossing under 50 EMA) occurs while holding a position.
The Strategy Manual: How to Use the Settings
We have built a professional-grade algorithm, which means it has "levers" designed to adapt to almost any market condition. Think of these settings as the steering wheel, gas pedal, and brakes for your strategy. Here is your complete manual on exactly what each setting does, when to change it, and how to use it.
1. Moving Averages & Trend These define the "macro environment." They tell the algorithm whether it is allowed to look for long setups or if it needs to stay out.
Micro EMA Length (Default: 9): The fast-moving trigger line. Decrease to 5 if you are scalping on a 1-minute chart. Increase to 12 if you want to ignore tiny 1-bar pullbacks.
Fast/Slow EMA Length (Default: 20/50): The core trend cloud. If you are swing trading daily charts and want to catch massive, long-term trends, change these to the traditional 50 and 200.
2. Smart Triggers & Structure This is the "Brain" of the algorithm that filters out bad setups.
Real-Time Lookback (Micro) (Default: 12): How many candles backward the script looks to verify a recent "Higher Low" was made before a crossover. If the script is missing valid entries because the pullback was long and drawn out, increase this to 20.
Pivot Lookback/Forward (Macro) (Default: 5): Purely visual. It dictates how many candles are needed to confirm the HH/LL text labels on the chart.
Require Higher Low for A+ Entry (Default: Checked): The strictest safety filter. Uncheck this if you are trading highly volatile assets (like Crypto) that often V-bottom and explode upward without stopping to form a higher low.
Max Run-up % (Chase Filter) (Default: 10.0): Stops the algorithm from buying if the price has already pumped 10% from the bottom. If you are trading Small Caps that regularly pump 30% in a single candle, you must increase this to 20 or 30.
Block Entries in Gray Chop Zone (Default: Checked): The anti-whipsaw filter. Uncheck only if you are actively trying to buy at the absolute bottom of a sideways consolidation box before the momentum officially kicks in.
3. Master Candle Consolidation Your custom logic for catching coiled breakouts.
Required Follow-up Bars (Default: 4): How many candles must get trapped inside the Master Candle. Reduce to 3 on high-timeframes (Daily/Weekly) where 4 days of resting is rare. Increase to 6 or 8 on 5-minute charts to ensure the consolidation is truly exhausted.
Use Master High/Low Bounds (Default: Checked): If unchecked, it only uses the candle body (Open to Close). Uncheck this on highly volatile, "wicky" charts where a single stray wick keeps ruining your consolidation count.
Require Bull Trend & Green ATR for Breakout (Default: Checked): Uncheck this if you want to trade "Reversal Breakouts" (buying an upward breakout before the macro trend has officially flipped bullish).
4. Smart Money Concepts (SMC) Ensures you are buying at a wholesale price.
Dealing Range Lookback (Default: 100): Decrease to 50 for faster, more aggressive zone shifting during rapid market regimes.
Require SMC Zone for Reloads (Default: Checked): Uncheck this during a raging, parabolic bull market where price never pulls back deep enough to hit the discount zone.
5. Dynamic ATR Exits (ADX Squeeze) Your trailing stop-loss manager.
Base ATR Multiplier (Trend) (Default: 3.0): Change to 2.0 for tighter risk management on large-cap stocks. Increase to 4.0 or 5.0 for highly erratic Crypto assets.
Tight ATR Multiplier (Chop) (Default: 1.5): The "choke" stop. Keep this very tight (1.0 to 1.5) to protect profits when momentum dies.
ADX Squeeze Threshold (Default: 20): Increase to 25 if you want the algorithm to aggressively lock in profits the second a trend shows minor weakness.
6. Volume Analysis & POC (Visuals)
Volume Lookback & StDev Multiplier: These dictate when the Fuchsia (Distribution) and Blue (Accumulation) diamonds appear. If you are getting too many diamond alerts, increase the Multiplier to 4.0 so it only flags true anomaly volume.
POC Profile Rows (Default: 40): Resolution of the Volume Profile calculation that draws the yellow Point of Control line. Increase to 100 for a more precise POC line. Decrease to 20 if your TradingView app is lagging.
The VBS Dashboard
The script features a built-in, non-intrusive HUD (Heads Up Display) utilizing a "Lazy-Draw" architecture to prevent memory buffer crashes. It provides a real-time readout of:
Current Macro Trend & Market Structure (HH/HL/LL/LH)
Intrabar Delta State (Positive/Negative)
Volatility State (Expanding vs. ADX Squeeze)
Current SMC Zone (Premium vs. Discount)
Real-time Stop Risk (%)
Usage & Backtesting Notes
By default, the strategy is optimized for comprehensive backtesting. It utilizes a fixed quantity size (qty=1) and allows pyramiding. This ensures the Strategy Tester captures and records the success rate of every single signal generated by the engine, providing a pure, unclouded view of the strategy's mathematical edge.
Disclaimer: VBS is an educational tool designed for analyzing market structure and volume dynamics. It does not guarantee profits. Always use proper risk management and test extensively on paper before deploying real capital.
กลยุทธ์

อินดิเคเตอร์

อินดิเคเตอร์
อินดิเคเตอร์

Momentum Leader ATR Risk MapMomentum Leader ATR Risk Map is a position-management indicator designed to help traders visualize where a leading stock is trading relative to its 50-period SMA and ATR-based extension levels.
The goal is not to generate automatic buy or sell signals. Instead, this tool provides a structured risk map for momentum leaders by combining:
• ATR extension from a configurable SMA baseline
• Positive extension bands for profit-taking and risk management
• Negative extension bands for pullback, add-zone, and damage-control reference levels
• Relative strength scoring versus a benchmark such as SPY
• SMA trend status
• Optional liquidity, sector RS, and industry RS filters
• Nearest upside and downside map levels shown directly in the table
By default, the indicator uses a Daily anchor and 50-period SMA baseline, making it suitable for swing trading and longer-term position management in momentum leaders. A 24-hour / 1440-minute anchor is also available for users who prefer to evaluate instruments with extended-hours or near-24-hour trading behavior.
Core Risk Map Levels:
Positive Extension Zones:
• +2.95x ATR: High-RS leader zone
• +4.56x ATR: Super momentum zone
• +5.27x ATR: Approximate 2σ risk zone
• +7.83x ATR: Approximate 3σ profit zone
• +10.00x ATR: Extreme / trail-only zone
Negative Extension Zones:
• -1.00x ATR: Pullback
• -2.00x ATR: Add zone
• -3.00x ATR: Deep pullback
• -4.56x ATR: Damage control
• -5.27x ATR: Washout / reclaim-needed zone
The table is designed to answer a few practical questions quickly:
• Is the stock still acting like a leader?
• Is price extended, normal, or damaged relative to the SMA/ATR map?
• Is the SMA trend still constructive?
• Is relative strength still intact across multiple lookback windows?
• Where is the nearest upside ATR map level?
• Where is the nearest downside ATR map level?
Relative Strength Logic:
The RS Score compares the current symbol against a user-selected benchmark over 21, 63, 126, and 252 anchor bars. A score of 4 of 4 means the symbol is outperforming the benchmark across all four lookback windows.
Optional Advanced Inputs:
The indicator includes optional sector and industry RS inputs for users who want to manually compare the stock against relevant ETFs such as XLK, SMH, IGV, XBI, XLE, XLF, or other sector/industry proxies. These are turned off by default to keep the tool frictionless.
A liquidity filter is also available, but it is turned off by default so the indicator can remain focused on the risk map itself.
Credit and Inspiration:
This indicator was inspired by concepts shared by several market educators and traders:
• Jeff Sun / @jfsrev
x.com
• @i_manage_risk
x.com
• StratLab / @StratLaboratory
x.com
Their publicly shared work on relative strength, momentum leadership, ATR extension frameworks, risk management, and scaling into or out of leaders helped shape the conceptual foundation for this tool.
This script is an independent implementation. It is not affiliated with, sponsored by, or endorsed by Jeff Sun, @i_manage_risk, StratLab, or @StratLaboratory, and it is not intended to replicate their complete methodologies.
Suggested Use:
This indicator is best used as a position-management overlay for stocks that have already been identified as potential leaders through a separate screening process. It can help define areas where the stock may be:
• Acting normally within a leadership trend
• Becoming extended into profit-taking zones
• Pulling back toward constructive support
• Losing momentum or entering damage-control territory
Important Notes:
ATR extension levels are reference zones, not guaranteed targets or support/resistance levels. A stock can remain extended for longer than expected, especially during strong momentum regimes. Conversely, deep pullbacks can signal deterioration rather than opportunity if leadership and trend structure are no longer intact.
Use this tool alongside broader market context, earnings risk, volume behavior, trend structure, and personal risk-management rules.
This indicator is for educational and informational purposes only and does not constitute financial advice. อินดิเคเตอร์

อินดิเคเตอร์

อินดิเคเตอร์

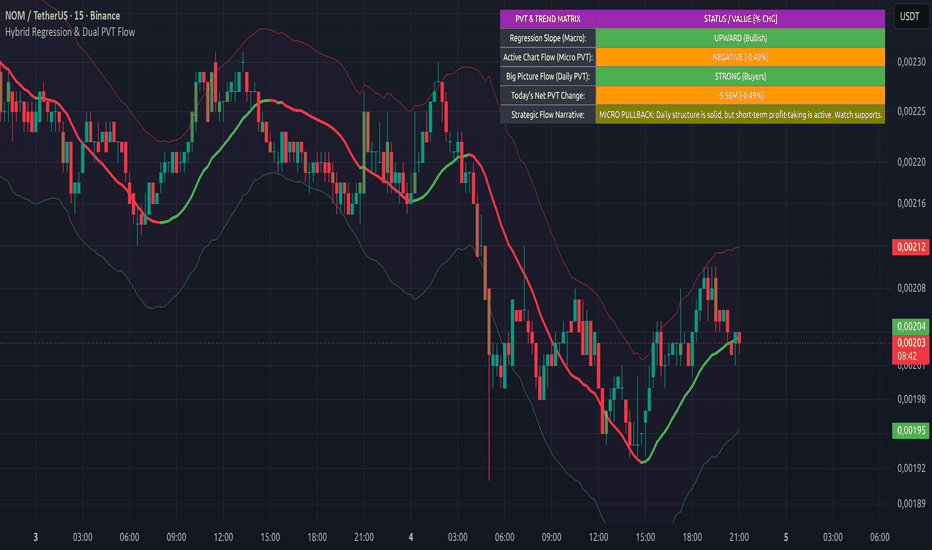
Hybrid Regression & Dual PVT Flow🇺🇸 ENGLISH DESCRIPTION TEXT
Overview
Hybrid Regression & Dual PVT Flow is an institutional-grade hybrid analysis system designed to uncover the footprints of market whales. It bridges the gap between pure price geometry and volume-weighted momentum, preventing retail traders from falling into "bull/bear traps" by exposing hidden institutional accumulation and distribution phases.
Key Technical Pillars:
Linear Regression Core: Computes a noise-filtered baseline representing the true mathematical equilibrium of price. The curve turns green during a bullish slope and red during a bearish slope.
Dynamic Fibonacci Volatility Envelope: Employs an ATR-driven deviation mechanism instead of traditional standard deviations. It projects key institutional overbought (Resistance) and oversold (Support) thresholds based on the 2.618 Fibonacci ratio.
Volume Anomaly Engine: Scans for extreme institutional anomalies where candle volume exceeds 1.5x of its 20-period moving average. These high-activity institutional bars are highlighted in Yellow on your chart.
Dual-Layer Multi-Timeframe PVT Dashboard:
Micro PVT Status: Tracks real-time smart money participation directly on your active trading timeframe (e.g., 5m, 15m, 1h).
Macro PVT Status: Permanently anchors a Daily (1D) Price Volume Trend core against its 10-period EMA, providing an unshakeable perspective of the "Big Picture" regardless of your active asset chart.
How to Read the Intelligence Dashboard:
BULLISH / BEARISH CONVERGENCE: Absolute alignment between the macro trend line and multi-timeframe capital flows. Indicates high-probability trend continuation.
HIDDEN BEARISH DIVERGENCE (Distribution Trap): Price regression slope is upward, but both macro and micro PVT metrics are flashing negative. Highly indicative of institutional selling into retail FOMO.
STRONG ACCUMULATION DIVERGENCE (Whale Accumulation): Price regression slope is sliding downward, but dual-layer PVT inflows are accelerating heavily. Signals structural retail liquidation being absorbed by institutional market makers right before a major reversal.
🇹🇷 TÜRKÇE AÇIKLAMA METNİ
Özet Giriş
Hybrid Regression & Dual PVT Flow, piyasada sıklıkla karşılaşılan "fiyat yükselirken kurumsal oyuncuların arka kapıdan mal çıkması" (dağıtım) veya "fiyat düşerken balinaların dipten gizlice mal toplaması" (akümülasyon) durumlarını yakalamak için tasarlanmış hibrit bir takip sistemidir. Matematiksel gücünü Doğrusal Regresyon Eğrisi ve Çift Katmanlı Price Volume Trend (PVT) momentum motorunun sentezinden alır.
Ana Özellikler:
Doğrusal Regresyon Hattı (Linear Regression Trend): Piyasanın ana dengesini ve makro yönünü gürültüden arındırılmış bir eğri olarak sunar. Eğim yukarıysa yeşil (Boğa), aşağıysa kırmızı (Ayı) olarak grafiğe işlenir.
Dinamik Fibonacci Volatilite Bantları: Klasik Bollinger bantları yerine, ATR (Average True Range) tabanlı dinamik volatilite sınırları kullanır. Üst kırılımlar kurumsal aşırı alım/direnç, alt bantlar ise kurumsal güvenli alım/destek bölgelerini işaret eder.
Hacim Anomalisi Mum Boyama: Son 20 mumun ortalama hacmini %150 aşan ani balina aktivitelerinde, mumlar otomatik olarak Sarı renge boyanarak dikkat çeker.
Çift Katmanlı PVT ve Trend Matris Paneli: * Mikro PVT: Bulunduğunuz anlık aktif grafik zaman dilimindeki (5dk, 15dk, 1sa vb.) para akışı yönünü ölçer.
Makro PVT: Grafiğiniz ne olursa olsun, arka planda Günlük (1D) kurumsal para akışının 10 günlük ortalamasını denetler.
Panel Strateji Notları Nasıl Okunur?
TAM UYUM (BOĞA / AYI): Trend yönü ile tüm vadelerdeki para akışları aynı yöndedir. Güvenli katılım bölgesidir.
GİZLİ AYI UYUMSUZLUĞU (Dağıtım Tuzağı): Regresyon eğrisi yukarı bakarken, hem günlük hem anlık para akışları negatif yönlüdür. Balinaların küçük yatırımcıya mal devrettiği tepe tuzaklarını gösterir.
GİZLİ BOĞA UYUMSUZLUĞU (Mal Toplama): Grafik aşağı akarken, hem günlük hem anlık PVT'nin güçlü yönlü yukarı gitmesidir. Balinaların dipten toplama yaptığını ve sert bir yükselişin yakın olduğunu gösterir. อินดิเคเตอร์
อินดิเคเตอร์

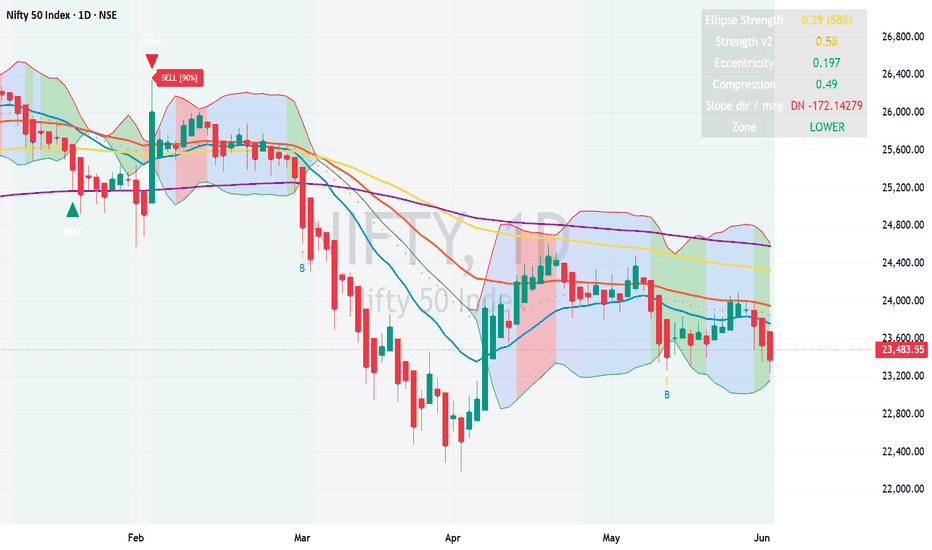
Adaptive Trend Structure Engine v2Adaptive Market Structure Engine (ATSE) is a technical analysis tool designed to help visualize and interpret evolving market structure in real time. It focuses on detecting shifts in price behavior by constructing a synthetic structure model that reacts dynamically to volatility and directional movement.
Unlike traditional indicators that rely solely on fixed moving averages or standard oscillators, this script builds a behavior-based price structure that adapts to changing market conditions. It does this by generating dynamic upper and lower structure thresholds, which act as reference boundaries for price movement.
📊 How It Works
The core of the indicator is a synthetic price model that simulates structural movement based on a configurable sensitivity parameter. Price action is continuously evaluated against adaptive upper and lower levels, which are recalculated according to selected structure logic (ATR-based, fixed sensitivity, or price fraction methods).
When price breaks beyond these adaptive boundaries, the system interprets this as a potential structural shift in market direction. These shifts are then classified as trend transitions.
🔄 Trend Detection Logic
The indicator tracks directional changes in the synthetic structure and identifies when a transition occurs from upward to downward structure (or vice versa). These transitions are visually marked on the chart to highlight potential changes in market behavior.
To improve readability, only the first bar of each structural shift is marked, reducing noise and repetitive signals.
📐 Fibonacci Structure Visualization
After each confirmed trend shift, the indicator generates a set of Fibonacci-based dynamic zones starting from the current reference price. These levels are not predictive targets but are instead used as visual framework zones, helping to understand possible areas of price interaction during a trend phase.
Each zone is spaced proportionally based on user-defined sensitivity settings, allowing the structure to expand or contract depending on volatility conditions.
📉 Momentum Context (Optional)
The script also includes an internal momentum calculation based on deviation from a dynamic center line. This helps provide additional context to structural movements without acting as a standalone signal generator.
A normalization option is available to smooth momentum behavior across extended trend phases.
⚙️ Customization Options
Users can adjust:
Structure sensitivity (brick size behavior)
Calculation method (ATR / price-based / classic)
Price source model (close-based or OHLC hybrid)
Fibonacci spacing intensity
Momentum normalization and oscillation behavior
This allows the indicator to be adapted across different assets and timeframes.
🎯 Purpose
The main goal of this tool is to:
Visualize market structure transitions
Provide a clearer view of trend shifts
Offer adaptive structural zones for context
Reduce noise from traditional indicator-based signals
It is intended for educational and analytical use to assist in understanding price behavior rather than to generate direct trading signals.
⚠️ Disclaimer
This script does not provide financial advice. All signals and visual elements are based on mathematical transformations of price data and should be used as part of a broader analysis framework. อินดิเคเตอร์

อินดิเคเตอร์
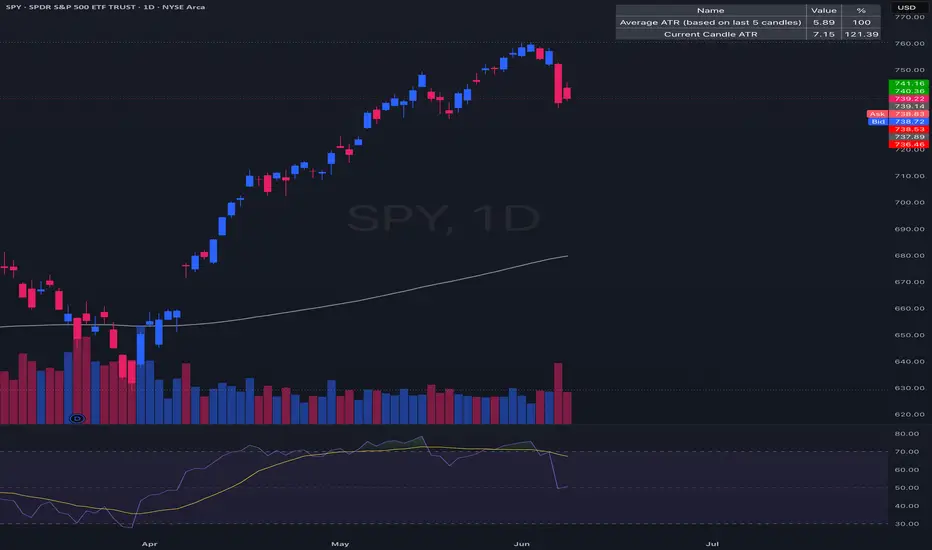
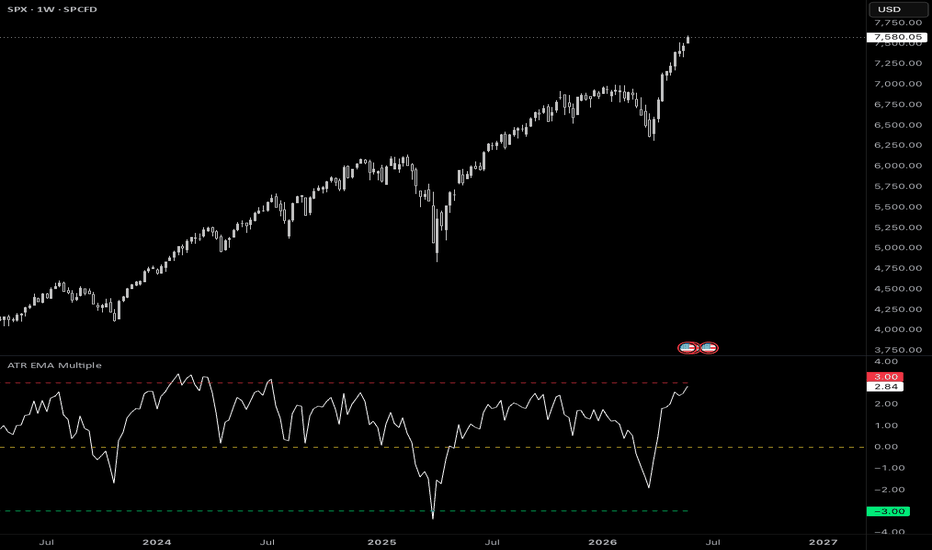
ATR EMA MultipleA TradingView (Pine Script v6) oscillator that measures how far price has stretched from its moving average, expressed in units of ATR (Average True Range).
Instead of asking "how many dollars/points is price away from its average?", this indicator asks "how many typical bars of volatility is price away from its average?" That makes the reading comparable across different symbols, timeframes, and volatility regimes.
WHAT IT PLOTS
The main line (white) is the oscillator:
oscillator = (close - EMA(close, maPeriod)) / ATR(atrPeriod)
A value of +2 means price is currently 2 ATRs above its EMA.
A value of -1.5 means price is 1.5 ATRs below its EMA.
The yellow line at 0 marks price sitting exactly on its EMA.
A red line above and a green line below act as reference bands. How those two
bands are placed is controlled by the Line Mode setting (see below).
Typical use: when the oscillator pushes into or beyond the red band, price is
unusually extended to the upside; the green band marks unusual extension to the
downside. How you act on that (mean-reversion, breakout confirmation, etc.) is
up to your strategy.
SETTINGS
ATR and EMA Settings
ATR Period (default 14)
Lookback for the ATR used as the volatility unit.
Moving Average Period (default 21)
Lookback for the EMA that price is measured against.
Reference Lines
Line Mode (default Manual)
Chooses how the red/green bands are positioned:
"Manual" or "Std Deviations".
Manual mode
You set the band levels directly, in ATR units.
Manual: red line ATR level (default 3)
Red band drawn at this fixed oscillator value (e.g. +3 ATRs).
Manual: green line ATR level (default -3)
Green band drawn at this fixed oscillator value (e.g. -3 ATRs).
The bands are flat, fixed horizontal lines. Good when you want a constant, opinionated threshold.
Std Deviations mode
The bands adapt to the symbol's recent behaviour. You specify how many standard deviations from 0 each band should sit, and the script measures the actual standard deviation from the data.
Std Dev: red line std devs above 0 (default 2)
Red band at this many standard deviations above 0.
Std Dev: green line std devs below 0 (default 2)
Green band at this many standard deviations below 0.
Std Dev: lookback length (bars) (default 200)
How many recent bars are sampled to measure the standard deviation.
The bands move over time as volatility behaviour changes, automatically tightening in calm conditions and widening in stretched ones.
HOW "STD DEVIATIONS" MODE IS CALCULATED
This is worth understanding before you rely on it, because it is a deliberate, slightly non-standard choice.
The standard deviation is measured separately for the positive and negative sides of the oscillator, and anchored at 0 (not at each side's own average):
sigma_positive = sqrt( mean( oscillator^2 over bars where oscillator > 0 ) )
sigma_negative = sqrt( mean( oscillator^2 over bars where oscillator < 0 ) )
red band = (+ std devs above) x sigma_positive
green band = (- std devs below) x sigma_negative
Two consequences of this design:
Anchored at 0, not at the mean. Because the bands are described as "N standard deviations above 0 / below 0", the spread is measured as the root-mean-square of values around 0 -- not the textbook standard deviation around the sample mean. This keeps 0 (price = EMA) as the true center of the scale.
Asymmetric by design. The upside and downside are measured independently, so a market that stretches further on rallies than on sell-offs (or vice versa) will get an asymmetric pair of bands that reflects that.
On a freshly loaded chart the bands stay blank until the lookback window contains at least one positive and one negative reading.
READING THE COLOURS
Oscillator White Price distance from EMA, in ATR units.
Upper band Red Upside extension threshold.
Lower band Green Downside extension threshold.
Zero line Yellow Price equals its EMA.
NOTES & LIMITATIONS
The indicator is not a standalone trading system -- it's a normalization/context tool. Combine it with your own entry/exit logic and risk management.
Readings are only comparable when the ATR Period and Moving Average Period are held constant.
The red/green reference bands are drawn as dashed lines to distinguish them from the solid white oscillator.
On instruments with periods of zero volatility (ATR = 0), the oscillator value is undefined for those bars.
LICENSE
Open source -- published for the TradingView community. Attribution appreciated.
อินดิเคเตอร์
อินดิเคเตอร์
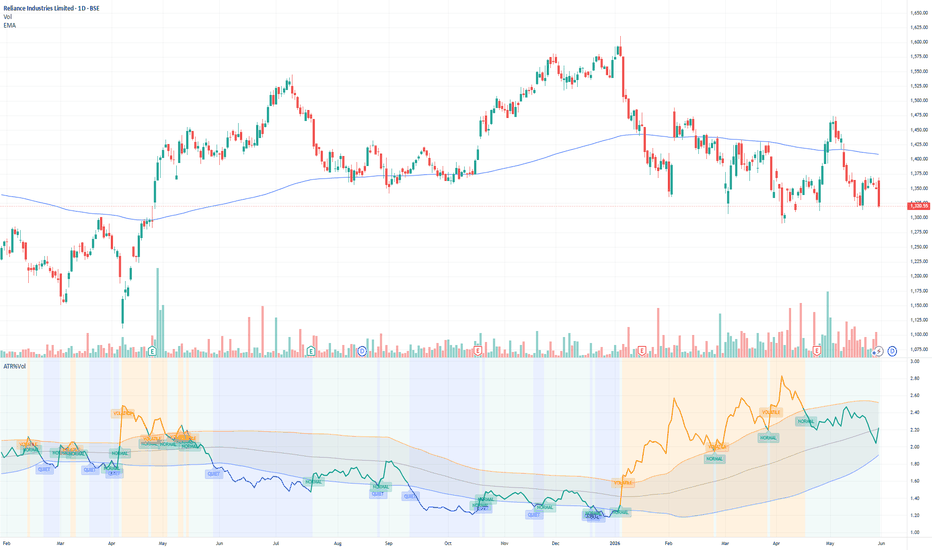
EMA Ribbon with ATR ExtensionsThis indicator is an EMA ribbon framework combined with multi-timeframe trend structure and volatility-normalized distance measurements using ATR.
The core component is a configurable exponential moving average ribbon, allowing multiple EMA lengths to be plotted simultaneously across different timeframes. This includes both intraday EMAs and optional higher-timeframe EMAs such as daily and weekly periods. The purpose of this structure is to provide a layered view of trend behavior across multiple time horizons, helping visualize alignment, compression, and expansion within broader market structure.
In addition to standard EMA visualization, the indicator integrates a volatility context layer using the Average True Range (ATR). This allows price distance from each EMA to be expressed not only in percentage terms, but also in ATR-normalized form. The ATR extension metric is derived from the relationship between percentage deviation from the moving average and current ATR percentage, enabling comparison of movement intensity across different instruments regardless of price scale.
The included table presents a structured breakdown for each selected EMA:
EMA value based on configurable length and timeframe
Percentage distance between price and each EMA
ATR-normalized extension value representing volatility-adjusted deviation
This structure allows users to observe how price interacts with multiple trend references simultaneously, while also understanding whether movement is occurring within normal volatility conditions or represents an expanded deviation relative to recent market behavior.
A visual marker is included to highlight conditions where price is significantly extended above a selected higher timeframe EMA relative to ATR-based expansion. This is intended to assist with quickly identifying periods of elevated trend extension within the broader EMA framework.
The header display optionally shows symbol, description, and active chart timeframe to maintain contextual awareness when analyzing multiple assets or timeframes.
Overall, the tool is designed as a multi-layer trend and volatility visualization system combining moving averages, relative distance metrics, and ATR-based normalization to better contextualize price positioning within ongoing market structure. อินดิเคเตอร์