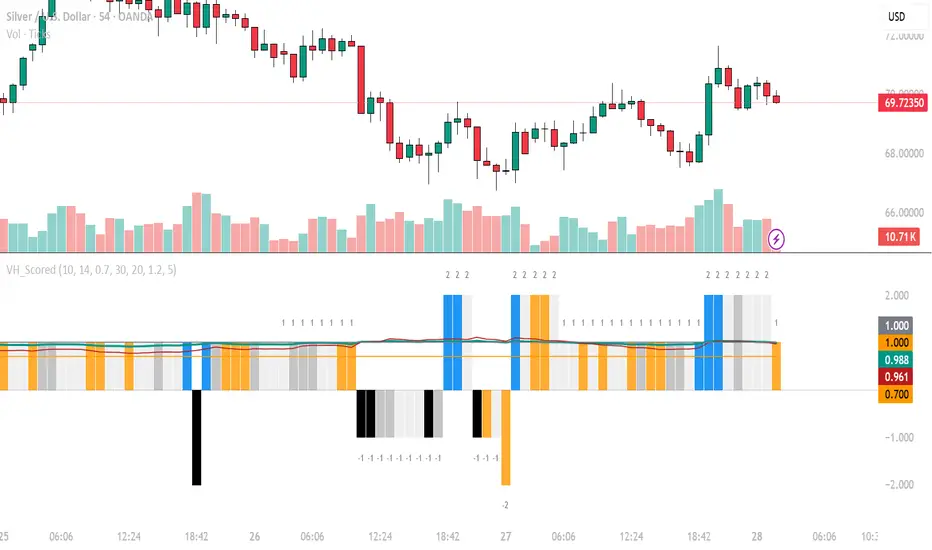
Swing Control ScreenerThis screener scores any stock against a structured 10-point swing trading framework, helping you objectively identify high-quality long setups before applying manual confirmation.
The framework was built around one core principle — every condition must align simultaneously. A valid SFP trigger on a weak stock is not a trade. This script filters the structure so you only spend time visually reviewing stocks that deserve your attention.
How it works
The script evaluates 10 conditions across four categories and displays a live scorecard label on your chart. The background colour updates automatically based on the score.
MA Alignment (3 points)
Price must be above the EMA 20, SMA 100, and SMA 200 simultaneously. All three moving averages must also be sloping upward. This ensures you are trading with the trend across multiple timeframes, not against it.
Volatility (2 points)
The ATR must have peaked and be in decline at the point of entry. A rising ATR into a swing point means sellers are still aggressive. A declining ATR means the selling is exhausting — the conditions where reversals are most reliable.
Relative Strength (2 points)
The stock's RSC line must be above its 21-period MA, confirming the stock is outperforming the S&P 500. Stocks with deteriorating relative strength tend to fail at swing points even when the technical structure looks clean. This filter was the single most consistent differentiator between winning and losing trades in backtesting.
Liquidity and Proximity (2 points)
Average daily volume must exceed 1 million shares to ensure sufficient liquidity for clean entry and exit. Price must also be within a configurable percentage of the recent swing low, confirming the stock is approaching a potential entry zone rather than extended from it.
Scoring tiers
8 to 10 — High Conviction. Consider full position size.
6 to 7 — Decent Setup. Consider half position size.
4 to 5 — Watch Only. Monitor but do not enter.
0 to 3 — Skip entirely.
What this script does not do
The score reflects structural conditions only. Before entering any trade you must confirm manually:
A valid SFP trigger candle — wick below the swing low closing back above it
Above average volume on the confirmation candle
No major macro risk events scheduled
Settings
All parameters are fully adjustable including MA lengths, ATR lookback, RSC benchmark symbol, minimum volume threshold, and swing proximity percentage. The default benchmark is SPX but can be changed to QQQ or any other symbol.
Best used on the daily timeframe. อินดิเคเตอร์

อินดิเคเตอร์

อินดิเคเตอร์

อินดิเคเตอร์

อินดิเคเตอร์

อินดิเคเตอร์

กลยุทธ์
ATR Trailing Stops for Hyperliquid Spot + Perps [HYPR-run]DESCRIPTION:
A drop-in ATR trailing exits module. Four architectures that maximize
profit on winning trades using volume weighted volatility instead of fixed levels or
plain ATR. Built modular; the trailing logic is self-contained so you
can drop it into any existing indicator or strategy as a plug-and-play
exits block. Two independent stops (long/short), spot and perps.
DISCOVERING EDGE
ATR trailing exits are popular, everyone uses them, but this indicator doesn't just trail on volatility, it trails on meaningful volatility that very few people measure. In order to gain a persistent, mechanical edge in how winners run and protect capital on the trades that don't work, we explored a more meaningful expression of ATR trailing exits.
VOLUME-WEIGHTED ATR vs PLAIN ATR
Plain ATR treats every candle equally. Volume-weighted ATR will only expand stops when volume validates the volatility, preventing premature exits on noise and letting winners run further on real moves. Over hundreds of trades this single difference can compound in the spirit of letting winners run further, losers stay controlled versus fixed levels or vanilla ATR.
- Four modes (A3.1, A4.0, A4.1, A4.2) cover different trailing
behaviors: ratcheting, chandelier anchor, free-floating, and raw
baseline. All size stop distance from volatility, not fixed levels.
- Modular engine. The trailing logic is self-contained; drop it into
any existing indicator or strategy as a plug-and-play exits block.
- Alerts fire built-in JSON webhook payloads. Paste your webhook URL,
create the alert, execute on the exchange of your choice.
ATR MODES
A3.1: LinReg + plain ATR, no ratchet. The baseline. Linear regression
projects where price is heading, plain ATR sets the distance. Stop moves
freely in both directions. Use as a reference or when you want a raw
trailing stop.
A4.0: LinReg + VWATR + Efficiency Ratio + ratchet (default). The
all-rounder. Volume-weighted ATR discounts low-liquidity candles. The
Efficiency Ratio (Kaufman) measures trend quality: in a clean trend it
widens the stop to let price run; in chop it tightens. Ratchet floor
means the stop only moves in your favor.
A4.1: Chandelier + VWATR + ratchet + first-bar multiplier. Anchored to
the highest high (longs) or lowest low (shorts). First-bar multiplier
sets a tighter initial stop, then the standard multiplier takes over as
the ratchet locks in gains. Use when entering off key levels.
A4.2: LinReg + VWATR, no ratchet. Same as A4.0 but without ratchet
floor or Efficiency Ratio. Stop moves freely with the projection, giving
the trade room through consolidation at the cost of less locked profit.
FEATURES
- Four ATR architectures selectable via dropdown
- Volume-weighted ATR: low-liquidity candles contribute less
- Efficiency Ratio: tightens in chop, widens in trend (A4.0)
- Ratchet floor: stop only moves in your favor (A4.0, A4.1)
- First-bar multiplier for tighter initial protection (A4.1)
- Separate ATR lookbacks for longs and shorts
- Separate multipliers for longs and shorts
- Two-bar confirmation prevents single-wick fakeouts
- Gradient fill between price and stop (intensifies near danger)
- Stop line color shifts with ATR regime (green stable, amber expanding)
- Ratchet circles mark each new locked-in level on the stop line
- Dashboard: mode, stop price, gap %, ER, VWATR %, regime state
- Dark/light theme toggle for any chart background
- Independent long/short alert toggles
- No JSON snippet needed; close payload is built into the script
HOW IT WORKS
Volume-weighted ATR scales each bar's true range by its volume relative
to the lookback average. High-volume bars contribute more; thin candles
contribute less. This prevents low-liquidity spikes from inflating stop
distance. Separate lookbacks for longs (default 14) and shorts (default
26) reflect that crypto drops faster than it climbs.
The Efficiency Ratio measures directional movement versus noise on a 0-1
scale. It scales the ATR multiplier between 0.8x (choppy) and 1.2x
(trending), adapting stop width to market regime. Only active in A4.0.
Two-bar confirmation requires a confirmed close beyond the stop level.
A single wick does not trigger the exit. The cross must hold for at
least one additional bar close.
ALERTS
Close Long fires as SPOT (sell spot position). Close Short fires as
PERPS (close short; spot is long-only). Toggle each independently.
Alert payload is built into the script as JSON; works with any webhook
receiver that accepts market/ticker/position fields.
CREDITS
ATR: J. Welles Wilder (1978)
Efficiency Ratio: Perry Kaufman อินดิเคเตอร์

อินดิเคเตอร์

อินดิเคเตอร์

Momentum Confluence SystemCredit: This indicator builds upon the Moving Average Shaded
Fill Area Crossover concept originally developed by @aballard11 The core visual
approach of using filled EMA ribbons to represent trend states was adapted and
significantly expanded with institutional-grade filtering, multi-layered
confluence logic, and professional risk management tools.
What This Indicator Does
The Momentum Confluence System is a multi-timeframe
trend-following indicator designed for day trading across all markets. It
identifies high-probability trade entries by requiring alignment across three
distinct layers of analysis before generating a signal:
-Macro Layer: A higher-timeframe directional filter that
determines whether the broader trend favors longs or shorts
-Slow Momentum Layer: An intermediate EMA ribbon that
confirms the underlying trend on the current timeframe
-Fast Momentum Layer: A responsive EMA ribbon that
generates the actual entry trigger when it crosses in the direction confirmed
by the other layers
A signal only fires when all three layers agree. This triple
confluence approach filters out many false signals that occur in
single-indicator systems.
How It Works - The Core Mechanism
The indicator operates on a hierarchical confirmation
system:
-Macro Bias
The script pulls data from a configurable higher timeframe
(default: 4-hour) and calculates an EMA. When the current price is above this
higher-timeframe EMA, the macro bias is bullish and only long signals are
permitted. When price is below, the macro bias is bearish and only short
signals are allowed. An optional background color overlay (disabled by default
for a cleaner chart) can be enabled to provide immediate visual feedback on the
current macro state—white for bullish, black for bearish.
-Slow Trend and Fast Momentum (Dual EMA Ribbon System)
Two separate EMA ribbons are calculated on the current
timeframe:
-The Slow Trend ribbon uses longer-period EMAs (default: 16
and 30) and represents the intermediate trend. The area between these EMAs is
filled with color—green tones when the fast EMA is above the slow, red tones
when below.
-The Fast Momentum ribbon uses shorter-period EMAs
(default: 8 and 16) and captures momentum shifts. When the fast EMA of this
ribbon crosses above the slow EMA, it generates a potential long signal. A
cross below generates a potential short signal.
Signal Generation
A confirmed long entry requires:
-Macro Bias bullish (price > higher-timeframe EMA)
-Slow Trend bullish (16 EMA > 30 EMA)
-Fast Momentum crossover (8 EMA crosses above 16 EMA)
All active confluence filters passing (volume, ADX,
session, cooldown)
A confirmed short entry requires the inverse conditions
across all layers.
Signal Visualization
When a signal triggers, a small circle marker appears on the
chart:
-Long signals appear as tiny green circles at the very
bottom of the chart pane
-Short signals appear as tiny red circles at the very top
of the chart pane
This positioning ensures signals remain clearly visible
regardless of price action and do not overlap with candles or indicators.
-Confluence Filters - The Edge
Beyond the core triple-layer system, the indicator includes
several optional filters that add further confluence requirements:
-Volume Confirmation
When enabled, signals only trigger if the current bar's
volume exceeds a moving average of volume. This filters out signals occurring
during low-participation periods, where price moves are more likely to fail or
reverse. You can adjust the lookback period and require volume to be a multiple
above average (e.g., 1.2x means volume must be 20% above the average). This
filter is disabled by default to provide cleaner out-of-the-box signals—enable
it if you want additional volume-based confluence.
-ADX Trend Strength Filter
The Average Directional Index measures trend strength
regardless of direction. When enabled, signals only fire when ADX is above your
threshold (default: 20). ADX below 20 typically indicates a ranging or choppy
market where trend-following entries have lower probability. ADX above 25-30
indicates a strong trend where momentum strategies tend to perform well. This
filter is disabled by default to allow signals in all market conditions—enable
it to restrict signals to confirmed trending environments.
-RSI Divergence Confirmation
This optional filter looks for divergences between price and
RSI. For long signals, it checks whether price is making lower lows while RSI
makes higher lows (bullish divergence), suggesting downward momentum is
exhausting. For shorts, it looks for the opposite pattern. This adds a
mean-reversion element to the momentum-based system.
-Signal Cooldown
Prevents consecutive signals within a specified number of
bars. This serves two purposes: it prevents overtrading in volatile conditions,
and it ensures that once you enter a position, you have time for the trade to
develop before the system suggests another entry.
-Session Filter
Restricts signals to specific hours of the trading day.
Useful for focusing on high-liquidity sessions (such as the overlap between
London and New York for forex) or avoiding pre-market and after-hours periods
for stocks where spreads widen and false breakouts are more common.
Risk Management System
ATR-Based Stop Loss and Take Profit
The indicator calculates Average True Range and uses it to
set dynamic stop loss and take profit levels that adapt to current volatility.
In high-volatility conditions, stops and targets widen automatically to avoid
premature exits. In low-volatility conditions, they tighten to protect profits.
Multi-Target System
Rather than a single take profit level, the indicator
displays three targets:
-TP1 (default: 1.5x ATR) - Suggested for taking 50% of the
position off to lock in profit
-TP2 (default: 2.5x ATR) - Suggested for taking another 30%
and moving stop to breakeven
-TP3 (default: 4.0x ATR) - Runner target for the remaining
20%
Each target displays its risk-to-reward ratio on the chart,
helping you assess whether the trade setup meets your minimum RR requirements.
Trailing Stop Visualization
When enabled, displays a trailing stop line that follows
price by a configurable ATR distance. This is a visualization tool—you execute
the trailing stop manually or via your broker's platform.
Historical Signal Zones
The indicator can draw persistent boxes on the chart showing
the TP and SL zones from previous signals. This lets you review how past setups
played out relative to their projected targets, which is useful for refining
your settings.
Non-Repainting Architecture
The indicator includes a "Wait for Bar Close"
toggle that is enabled by default. When active, signals only fire after the
current bar has closed and all conditions are confirmed. This prevents signals
from appearing during bar formation and then disappearing—a phenomenon known as
repainting that can lead to false backtesting results.
For live trading, always keep this enabled. The only reason
to disable it is for visual exploration of real-time crossover detection during
chart study.
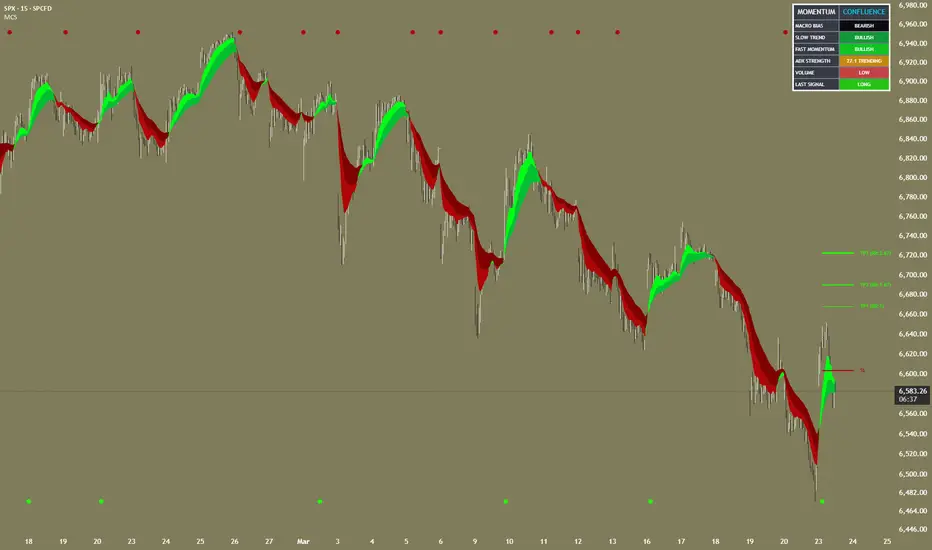
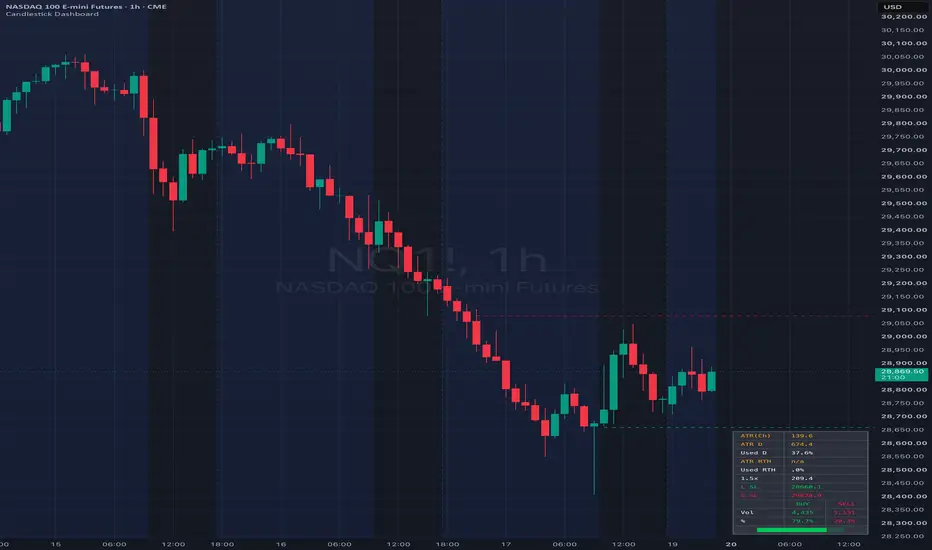
Dashboard Panel
A real-time information panel displays:
-Current macro bias state (bullish or bearish based on
higher timeframe)
-Slow trend state (direction of the intermediate EMA
ribbon)
-Fast momentum state (direction of the responsive EMA
ribbon)
ADX value and strength classification
(Weak/Trending/Strong)
Volume status relative to average (Low/Normal/High)
Last signal direction (Long/Short/None)
The dashboard provides all confluence conditions at a
glance, allowing you to quickly assess whether the market structure supports
your trading direction without scanning the chart.
Alert System
The following alerts can be configured:
-Long Entry Signal (fully filtered, confirmed signal)
-Short Entry Signal (fully filtered, confirmed signal)
-Any Entry Signal (either direction)
-Fast EMA Bullish Cross (unfiltered, for early awareness)
-Fast EMA Bearish Cross (unfiltered, for early awareness)
-Macro Trend Change (price crossing the higher-timeframe
EMA)
-ADX Entered Trending Zone
-ADX Exited Trending Zone
Alert messages include the ticker symbol, timeframe, and
price level for immediate context.
Recommended Settings by Style
-Day Trading (Primary Use Case - Default Settings)
-Macro Timeframe: 240 (4-hour)
-Fast Ribbon: 8/16
-Slow Ribbon: 16/30
-Volume Filter: Disabled by default (enable for additional
confluence)
-ADX Filter: Disabled by default (enable to filter ranging
markets)
Works across all liquid markets including forex majors,
indices, commodities, and large-cap stocks
Scalping Adaptation
Macro Timeframe: 60 (1-hour)
Fast Ribbon: 5/10
Slow Ribbon: 10/20
ADX Threshold: 25 (require stronger trend)
Cooldown: 3 bars
Best on high-liquidity pairs with tight spreads
Swing Trading Adaptation
Macro Timeframe: D (Daily)
Fast Ribbon: 10/21
Slow Ribbon: 21/50
ADX Threshold: 18
Cooldown: 10 bars
Session Filter: Disabled
What Makes This Indicator Unique
The value of this system lies not in any single
component—EMAs and ADX are well-established tools—but in how the components are
structured to work together as a coherent decision framework:
The hierarchical three-layer confirmation prevents the
common problem of entering trades against the prevailing trend
The confluence filters add further gates that signals must pass, reducing noise
The ATR-based risk management automatically adjusts to volatility
The multi-target system provides a complete trade
management framework rather than just entries
The dashboard consolidates state information that would
otherwise require multiple indicators
The non-repainting architecture ensures that what you see
in backtesting reflects actual live behavior
The combination creates a complete trading workflow in a
single indicator: trend identification, entry timing, position sizing guidance
(via RR ratios), and exit management.
Disclaimer
This indicator is a technical analysis tool, not financial
advice. No indicator can predict future price movement with certainty. Always
use proper risk management, never risk more than you can afford to lose, and
consider paper trading any new system before committing real capital. Past
performance of any trading system is not indicative of future results. The
indicator is suitable for all markets including forex, stocks, commodities,
indices, and cryptocurrencies. Performance will vary based on market conditions,
timeframe selection, and user-configured settings.
อินดิเคเตอร์

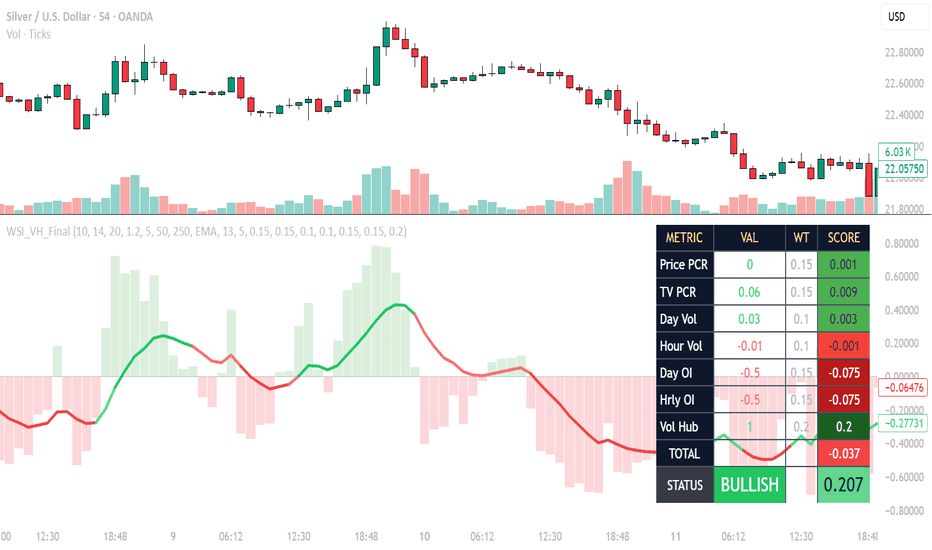
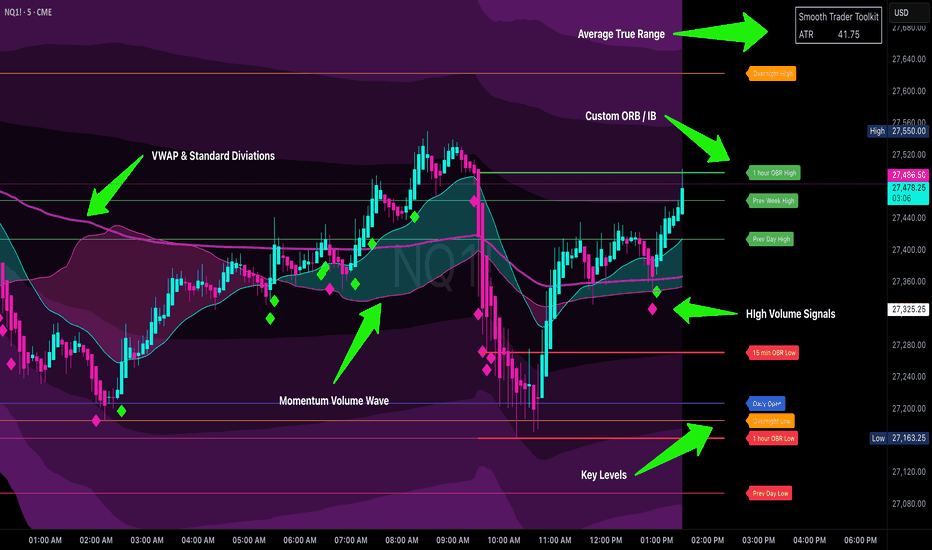
Smooth Trader - Volume Toolkit Smooth Trader Lite – Volume at a Glance ToolkitThis open-source toolkit is designed for one purpose: helping traders read volume behavior and market control at a single glance — no clutter, no signal overload, just clear visual context to support any trading style.
The five core components work in harmony to reveal volatility, momentum vs volume interaction, institutional volume entries, reversal zones, and directional pressure — all optimized for speed and readability.
Core Components & How They Connect
1. ATR Volatility Baseline
Displays Average True Range (default 14) in a compact top-right table.
Sets the "normal" movement scale so you instantly know whether current volume is significant relative to typical volatility — the foundation for judging every other element.
2. Momentum/Volume Wave (MV Cloud)
Plots a 21-period EMA against a dynamic running VWAP (50/100/200 length based on preset aggression).
The filled envelope shows how momentum is pushing against (or with) volume-weighted price — bullish fills when EMA leads, bearish when VWAP dominates.
Acts as the central "wave" that ties momentum to volume flow, giving immediate context for high-volume events.
3. PVSRA-Style High-Volume Candles
Classifies candles by volume relative to recent average and range magnitude. High volume (≥2× avg or max magnitude) → strong bull/bear color or diamond marker
Medium volume (≥1.5× avg) → lighter color
Instantly flags when big volume enters — often institutional buying/selling or manipulation setups (spikes followed by quick reversals).
4. Initial Balance (OBR) Reversal Levels
Plots the high/low of the regular session's opening range on selectable higher timeframes (default 15m & 60m).
Historical lines optional. These levels show where early volume was stopped and reversed — key reference points for judging later volume aggression or exhaustion.
5. Directional Volume Trend Coloring
Applies a smooth gradient to candle bodies based on multi-timeframe VIDYA z-score average (presets processed only on first bar for efficiency).
Colors shift gradually: neutral gray → strong bullish teal → strong bearish magenta.
Reveals whether volume pressure is consistently building in one direction, providing the "big picture" bias to interpret high-volume events and MV Cloud shifts.
Why These Components Work Together
ATR gives the volatility scale to judge "high volume."
MV Cloud shows momentum clashing with or riding volume-weighted levels.
PVSRA candles pinpoint the exact moments big volume arrives.
Initial Balance levels mark where that volume was previously rejected.
Trend coloring confirms if the volume flow is one-sided and gaining conviction.
The result: a lightweight, glanceable system that simplifies volume reading and helps spot control shifts, climaxes, or manipulation without generating explicit signals.
Optimizations
Enum-based inputs for clean, intuitive configuration
Calculations refactored for performance (first-bar preset evaluation, removed duplicates)
Lower-TF library upgraded to v5
Toggleable visuals with customizable colors and optional elements
How to Use
Add to chart → adjust presets and toggles → glance at the chart: Is volume high relative to ATR?
Is momentum breaking VWAP?
Are PVSRA candles firing?
Were Initial Balance levels respected?
Is trend coloring strengthening?
Ideal as a visual support layer on 5m–4h timeframes for stocks, forex, or crypto.This open-source toolkit provides clean volume and structure context. For traders seeking advanced delta-pressure signals and proprietary entry logic.
Disclaimer
For educational and informational purposes only. No trading advice or performance guarantees. Trading involves substantial risk of loss. Use at your own risk.
อินดิเคเตอร์
อินดิเคเตอร์

อินดิเคเตอร์

อินดิเคเตอร์

อินดิเคเตอร์
อินดิเคเตอร์

อินดิเคเตอร์

8:00-8:15 ORB Retest on 5m Time Frame v1.3 by Alf_AlgoORB Retest on 5m Time Frame
Breakout → Retest → Confirm → Enter
A structured session indicator designed to trade continuation after an opening range breakout using midpoint retests and confirmation.
Opening Range defines session structure
Breakout sets directional bias (with multiple detection modes)
Midpoint retest provides entry location
Momentum confirmation triggers signals
Triple ATR-based TP levels and structure-based SL manage risk
The system avoids chasing breakouts and instead waits for price acceptance and momentum confirmation.
━━━━━━━━━━━━━━━━━━━━━━━━
Timeframe
Pine Script®
Designed exclusively for the 5-minute chart.
The opening range is built using the first three 5-minute candles.
━━━━━━━━━━━━━━━━━━━━━━━━
Opening Range Levels
OR High — upper boundary (teal)
OR Low — lower boundary (red)
OR Midpoint — primary retest level (amber, dashed)
Shaded zone between High and Low for visual clarity
The midpoint acts as the primary retest level for entries.
━━━━━━━━━━━━━━━━━━━━━━━━
Breakout Direction Mode (New in v1.2)
Four modes to determine how directional bias is set after the opening range:
First Break — original behavior; whichever direction breaks out first locks the bias
Last Break — bias updates with each new breakout before the entry window opens, capturing the final sentiment
Strongest Break — the breakout with the largest candle body wins; more conviction = more significant
Directional Preference — manually select Bullish or Bearish; bias is set when the OR locks regardless of price action
For Last Break and Strongest Break modes, triangle markers appear on the chart each time the bias flips, so you can visually track the tug-of-war between bulls and bears before the entry window.
━━━━━━━━━━━━━━━━━━━━━━━━
Bias Logic
Close above OR High → Bullish Bias
Close below OR Low → Bearish Bias
Depending on the selected Breakout Direction Mode, the bias may lock on the first break, update with subsequent breaks, follow the strongest candle body, or be manually chosen.
━━━━━━━━━━━━━━━━━━━━━━━━
Entry Logic
Wait for midpoint retest
Require confirmation
Signal triggers within the active session window
Three confirmation modes are available:
Retest Close Reclaim
Break Retest Candle
Hybrid (default)
━━━━━━━━━━━━━━━━━━━━━━━━
Risk Management — Triple TP System (New in v1.2)
Three take-profit levels are automatically calculated using ATR, all shown on the chart from the moment a signal fires:
TP1 — 2× ATR (default) — solid line
TP2 — 3× ATR (default) — dashed line
TP3 — 5× ATR (default) — dotted line
SL — structure-based, remains fixed throughout the trade
Each TP and SL level gets a label when hit (TP1 ✓, TP2 ✓, TP3 ✓, SL ✗), so you can see exactly where targets were reached or where the stop was triggered. All ATR multipliers are fully adjustable in the settings.
Alert conditions are available for each individual TP hit and SL hit.
━━━━━━━━━━━━━━━━━━━━━━━━
Chart Elements
Opening Range High / Low / Mid with shaded zone
Breakout markers (triangles)
Retest markers (diamonds)
Buy / Sell signal labels
TP1 / TP2 / TP3 and SL levels with hit labels
On-chart dashboard with full state tracking
━━━━━━━━━━━━━━━━━━━━━━━━
Dashboard
The on-chart dashboard displays real-time state:
Session preset
Breakout Direction Mode
First break direction
Current bias
Retest status
Signal status
Confirmation mode
Individual TP1 / TP2 / TP3 and SL hit status
TP ATR multiplier values
━━━━━━━━━━━━━━━━━━━━━━━━
Typical Workflow
Apply on a 5-minute chart
Select your session and breakout direction mode
Allow opening range to form
Observe breakout(s) and bias assignment
Wait for midpoint retest
Enter after confirmation
Monitor TP1 → TP2 → TP3 progression
━━━━━━━━━━━━━━━━━━━━━━━━
v1.2 Release Notes
Added Breakout Direction Mode with four options: First Break, Last Break, Strongest Break, Directional Preference
Added triple take-profit system (TP1, TP2, TP3) with independent ATR multipliers
TP and SL hit labels appear on chart when each level is reached
Added alert conditions for each TP hit and SL hit
Styled OR lines with updated color palette (teal / red / amber)
Added shaded zone between OR High and Low
Updated dashboard with Breakout Direction Mode, individual TP status, and ATR multiplier display
v1.1 Release Notes
Added ORB session selection (New York, London, Asia)
Replaced breakout text labels with directional triangle icons
Replaced retest text labels with diamond icons
Added on-chart dashboard
Dashboard now shows directional state instead of checkmarks
Added Buy / Sell signal display in dashboard
Added color-coded dashboard values (green bullish, red bearish)
Updated Buy/Sell signal label colors
Added TP / SL outcome tracking in dashboard
━━━━━━━━━━━━━━━━━━━━━━━━
Feedback
This script is shared publicly to help traders study structured opening range continuation setups.
Feedback and suggestions are welcome
Ideas for improvements or additional features are appreciated
อินดิเคเตอร์

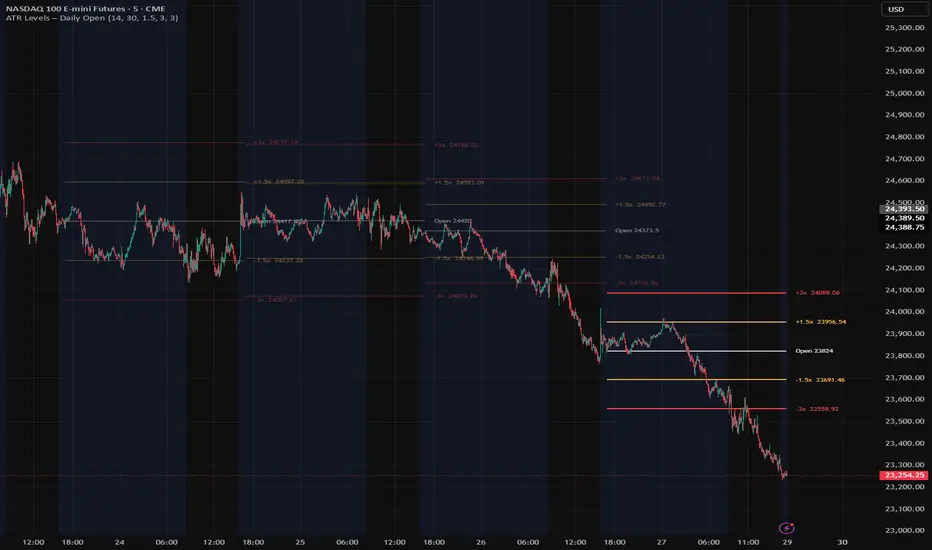
Round Numbers ATR Plotter v3Description
The Round Numbers ATR Plotter v3 is an advanced tool designed to visualise dynamic price levels based on market volatility.
Instead of relying on fixed-point or pip-based intervals, this indicator builds its structure using the Average True Range (ATR), allowing levels to automatically adapt to changing market conditions across all asset classes — Forex, indices, crypto, and commodities.
Each level acts as a volatility-adjusted psychological zone, where price is statistically more likely to react, consolidate, or transition.
How it works
The distance between levels is calculated as:
Step = ATR (Daily or Weekly) × Multiplier
This step is then optionally rounded to clean round numbers, producing levels that are both:
- mathematically consistent with volatility
- visually intuitive and easy to interpret
Key Features
🔹 ATR-Based Dynamic Levels
- Levels automatically adjust to volatility
- No need to define points, pips, or instrument-specific scaling
- Works seamlessly across all markets
🔹 Smart Step Rounding
- Optional alignment to clean round numbers (e.g. 314 → 300)
- Improves readability and psychological relevance
🔹 Gravitation Zones
- Each level is surrounded by a configurable gravitational range
- Defined as a percentage of the step (default: 25%)
- Highlights areas where price tends to cluster before moving
🔹 Optional Zone Fill
- Visual shading between gravitation lines
- Helps identify equilibrium zones at a glance
🔹 Adaptive to Any Market
- No need to adjust pip size (including JPY pairs)
- No manual tuning per asset
🔹 Step Label on Chart
- Displays the current ATR-based step directly on the chart
- Positioned near the central level for quick reference
Inputs Overview
- Number of Levels (per side): Number of levels plotted above and below price
- ATR Timeframe: Choose between Daily or Weekly ATR
- ATR Length: Period used for ATR calculation
- ATR Multiplier: Controls spacing between levels
- Align levels to round numbers: Enables rounding of the step to clean values
- Gravitation Zones (%): Defines the size of the zone around each level
- Gravitation Lines Style: Colour, width, and style customisation
- Zone Fill (optional): Enable/disable shading between gravitation lines
Improvements vs Previous Versions
✅ Replaced fixed step (points/pips) with ATR-based dynamic spacing
✅ Eliminated the need for pip size configuration (including JPY pairs)
✅ Added automatic adaptation to volatility regimes
✅ Introduced smart step rounding for cleaner levels
✅ Added gravitation zones around each level
✅ Added optional zone fill visualisation
✅ Improved usability across all instruments without manual adjustments
✅ Added on-chart ATR step display
อินดิเคเตอร์

อินดิเคเตอร์

Regime Classifier [JOAT]Regime Classifier
Introduction
The Regime Classifier is a sophisticated market state detection system designed to identify and classify market conditions into distinct operational regimes. Understanding the current market regime is perhaps the most critical factor in successful trading - a strategy that works beautifully in a trending market will fail miserably in a ranging market, and vice versa. This indicator solves that fundamental problem by providing clear, actionable classification of market states, allowing traders to adapt their approach to current conditions.
This tool is built for traders who understand that markets are not random but move through distinct phases, each requiring different strategies and risk management approaches. Whether you're a systematic trader needing regime filters, a discretionary trader seeking market context, or a portfolio manager adjusting exposure, this classifier provides the institutional-grade market intelligence needed to navigate any market environment successfully.
Why This Indicator Exists
Most traders apply the same strategy regardless of market conditions, then wonder why their performance is inconsistent. This indicator addresses that critical flaw by:
Regime Classification: Identifies four distinct market states with clear characteristics
Regime Strength: Measures how strongly the market exhibits regime characteristics
Regime Persistence: Tracks how long the current regime has been in place
Regime Quality: Evaluates the reliability of the current regime classification
Session Awareness: Considers session context for regime analysis
Regime Transitions: Detects and signals regime changes for strategy adaptation
The classifier transforms the complex, often subjective process of market analysis into an objective, systematic framework that can be consistently applied across all instruments and timeframes.
Core Components Explained
1. ADX-Based Trend Detection
The Average Directional Index (ADX) is the primary tool for trend detection:
// ADX calculation
float atr_val = ta.rma(ta.tr(true), i_adx_period)
float up_move = high - high
float down_move = low - low
float plus_dm = up_move > down_move and up_move > 0 ? up_move : 0
float minus_dm = down_move > up_move and down_move > 0 ? down_move : 0
float plus_di = 100 * ta.rma(plus_dm, i_adx_period) / atr_val
float minus_di = 100 * ta.rma(minus_dm, i_adx_period) / atr_val
float adx = 100 * ta.rma(math.abs(plus_di - minus_di) / (plus_di + minus_di), i_adx_period)
ADX components:
ADX Value: Trend strength (0-100), regardless of direction
+DI: Bullish directional movement
-DI: Bearish directional movement
Trend Threshold: Minimum ADX for trend classification (default 25)
Directional Bias: +DI vs -DI for trend direction
ADX above 25 indicates a trending market, while below 25 suggests ranging or volatile conditions.
2. ATR-Based Volatility Analysis
The Average True Range (ATR) measures volatility and helps distinguish between different non-trending states:
// ATR analysis
float atr_current = ta.atr(i_atr_period)
float atr_average = ta.sma(atr_current, i_atr_period * 3)
float atr_ratio = atr_average > 0 ? atr_current / atr_average : 1.0
// Volatility thresholds
float expansion_threshold = i_atr_expansion_mult
float contraction_threshold = i_atr_contraction_mult
ATR components:
Current ATR: Recent volatility measurement
Average ATR: Long-term volatility baseline
ATR Ratio: Current volatility relative to average
Expansion Threshold: Ratio indicating high volatility (default 1.4)
Contraction Threshold: Ratio indicating low volatility (default 0.6)
ATR analysis helps distinguish between ranging (low volatility) and volatile (high volatility) markets when ADX is below the trend threshold.
3. Regime Classification Logic
The indicator classifies markets into four distinct regimes:
// Regime classification
int market_regime = 0
if adx >= i_adx_trend
market_regime := 1 // Trending
else if atr_ratio >= expansion_threshold and adx < i_adx_trend
market_regime := 3 // Volatile
else if atr_ratio <= contraction_threshold and adx < i_adx_trend
market_regime := 2 // Ranging
else
market_regime := 0 // Neutral
Regime types:
Trending (ADX ≥ 25): Strong directional movement with clear trend
Ranging (ADX < 25, ATR ratio ≤ 0.6): Low volatility, sideways movement
Volatile (ADX < 25, ATR ratio ≥ 1.4): High volatility, erratic movement
Neutral (ADX < 25, 0.6 < ATR ratio < 1.4): Transition between defined states
Each regime has distinct characteristics that require different trading approaches.
4. Regime Strength Measurement
Not all regimes are created equal - some are stronger and more reliable than others:
// Regime strength calculation
float regime_strength = 0.0
switch market_regime
1 => regime_strength := math.min(adx / 50.0 * 100, 100) // Trending strength
2 => regime_strength := math.min((1 - atr_ratio) / (1 - contraction_threshold) * 100, 100) // Ranging strength
3 => regime_strength := math.min((atr_ratio - 1) / (expansion_threshold - 1) * 100, 100) // Volatile strength
0 => regime_strength := 50.0 // Neutral default
Strength interpretation:
Trending Strength: Based on ADX value (higher ADX = stronger trend)
Ranging Strength: Based on how low volatility is (lower ATR = stronger range)
Volatile Strength: Based on how high volatility is (higher ATR = stronger volatility)
Neutral Strength: Fixed at 50% as baseline
Strength Range: 0-100% indicating regime confidence
Higher strength values indicate more reliable regime classification.
5. Regime Persistence Analysis
The duration of a regime provides additional context about its reliability:
// Regime persistence tracking
var int regime_bars = 0
var int regime_start_bar = 0
if market_regime == market_regime
regime_bars := regime_bars + 1
else
regime_bars := 1
regime_start_bar := bar_index
// Persistence score
float persistence_score = math.min(float(regime_bars) / i_persistence_lookback * 100, 100)
Persistence features:
Regime Bars: Number of consecutive bars in current regime
Regime Start: When the current regime began
Persistence Score: Normalized duration (0-100%)
Lookback Period: Reference period for normalization (default 50)
Mature Regimes: Higher persistence indicates established conditions
Long-lasting regimes are more reliable than newly formed ones.
6. Regime Quality Assessment
Quality evaluates how well the current market fits the regime characteristics:
// Quality assessment
float quality_score = 0.0
float adx_quality = adx / 50.0 * 50 // 50% weight
float atr_quality = market_regime == 2 ? (1 - atr_ratio) / (1 - contraction_threshold) * 50 :
market_regime == 3 ? (atr_ratio - 1) / (expansion_threshold - 1) * 50 : 25
quality_score := adx_quality + atr_quality
Quality components:
ADX Quality: How well trend strength matches regime expectations
ATR Quality: How well volatility matches regime expectations
Quality Score: Combined assessment (0-100%)
High Quality: Clear regime characteristics
Low Quality: Ambiguous or transitioning conditions
High quality scores indicate clear, unambiguous market conditions.
7. Session Context Integration
Market behavior varies significantly across trading sessions:
// Session analysis
bool asian_session = time(timeframe.period, "0000-0800")
bool london_session = time(timeframe.period, "0700-1600")
bool ny_session = time(timeframe.period, "1200-2100")
// Session-specific adjustments
float session_multiplier = 1.0
if london_session
session_multiplier := 1.2 // Higher volatility expected
else if asian_session
session_multiplier := 0.8 // Lower volatility expected
Session features:
Session Detection: Identifies major trading sessions
Session Multipliers: Adjusts expectations based on session characteristics
Session Persistence: Tracks regime duration within current session
Session Quality: Evaluates regime quality within session context
Session Transitions: Identifies regime changes at session opens/closes
Session context helps interpret regime changes and anticipate behavior.
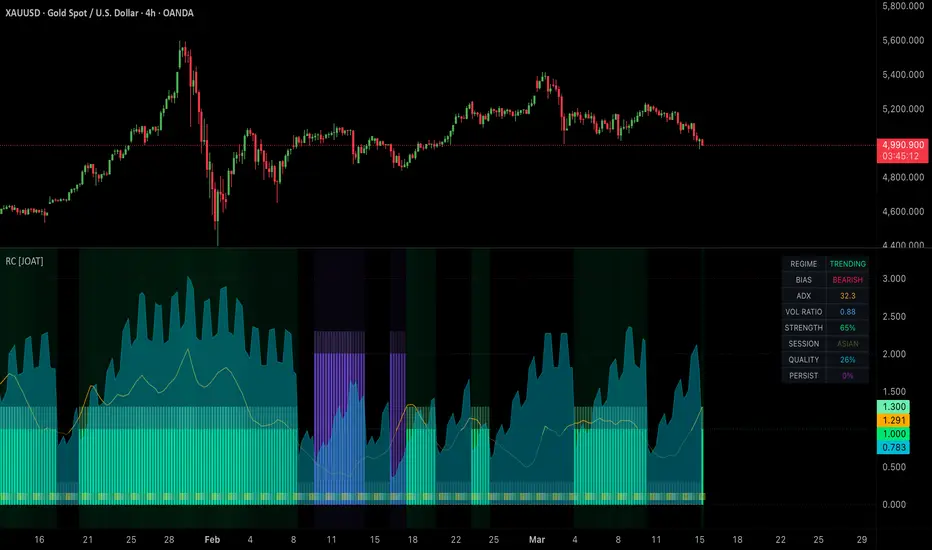
Visual Elements
Regime Histogram: Color-coded bars showing current regime
Strength Meter: Visual representation of regime strength
Persistence Line: Shows regime duration over time
Quality Gauge: Quality score visualization
Background Colors: Regime-based background shading
Session Markers: Visual session boundaries
Dashboard: Real-time regime metrics
Transition Alerts: Visual regime change notifications
The dashboard displays:
1. Current market regime and confidence
2. Regime strength and persistence
3. Quality score and trend direction
4. Session context and behavior
5. Regime history and transitions
6. Recommended strategies for current regime
7. Risk management adjustments
8. Regime forecast based on patterns
Input Parameters
ADX Settings:
ADX Period: Trend strength calculation (default: 14)
Trend Threshold: Minimum ADX for trend regime (default: 25)
ADX Smoothing: Additional smoothing for ADX (default: 3)
ATR Settings:
ATR Period: Volatility calculation (default: 14)
Expansion Multiplier: High volatility threshold (default: 1.4)
Contraction Multiplier: Low volatility threshold (default: 0.6)
Analysis Settings:
Persistence Lookback: Reference for persistence score (default: 50)
Quality Smoothing: Smoothing for quality calculation (default: 5)
Session Awareness: Enable session analysis (default: true)
Visual Settings:
Color Scheme: Customizable regime colors
Background Shading: Enable regime backgrounds
Dashboard Display: Show metrics panel
Alert Settings: Configure regime change alerts
How to Use This Indicator
Step 1: Identify Current Regime
Check the dashboard for the current market regime. Each regime requires a different approach:
Trending: Use trend-following strategies, let winners run
Ranging: Use mean-reversion strategies, take profits at levels
Volatile: Reduce position size, use wider stops, or avoid trading
Neutral: Wait for clarity, reduce trading activity
Step 2: Assess Regime Strength
Higher strength indicates more reliable conditions. In strong regimes (80%+), you can be more aggressive with position sizing. In weak regimes (<50%), reduce exposure and wait for confirmation.
Step 3: Monitor Persistence
Newly formed regimes (<10 bars) may be false signals. Mature regimes (>20 bars) are more established and reliable. Consider regime persistence in your strategy selection.
Step 4: Evaluate Quality
High quality scores (>75%) indicate clear market conditions. Low quality scores (<50%) suggest ambiguity - reduce trading or wait for clarity.
Step 5: Consider Session Context
Regimes that persist across multiple sessions are more significant. Regime changes at session opens often set the tone for the session.
Step 6: Watch for Transitions
Regime transitions signal strategy changes. A shift from trending to ranging requires switching from trend-following to range-bound strategies.
Best Practices
Always adapt your strategy to the current regime - don't use a trending strategy in ranging markets
High strength + high quality = maximum confidence in regime classification
Low persistence regimes (<10 bars) may be false - wait for confirmation
Session transitions often trigger regime changes - be alert at session opens
Volatile regimes are dangerous for most traders - consider reducing activity
Regime persistence is key - the longer a regime persists, the more reliable it is
Quality scores below 50% suggest waiting for clarity
Combine regime analysis with your existing strategy for better results
Keep a regime journal to track how each instrument behaves in different regimes
Use regime transitions as signals to adjust your entire trading approach
Strategy Applications by Regime
Trending Regime:
Trend-following strategies (moving averages, ADX, momentum)
Let winners run to maximum targets
Use trailing stops to capture extended moves
Add to positions on pullbacks in trend direction
Higher position sizing due to clear direction
Ranging Regime:
Mean-reversion strategies (RSI, Stochastic, Bollinger Bands)
Take profits at support/resistance levels
Use fixed targets - don't let winners turn into losers
Fade extreme moves toward the range middle
Smaller position sizing due to limited moves
Volatile Regime:
Reduce position size significantly (50% or less)
Use wider stops to avoid premature exits
Consider sitting out until conditions improve
Focus on volatility breakout patterns if trading
Quick profit taking - volatile conditions reverse quickly
Neutral Regime:
Wait for clarity before taking new positions
Manage existing positions more actively
Reduce trading frequency
Look for regime transition signals
Focus on longer timeframe analysis for direction
Technical Implementation
Built with Pine Script v6 featuring:
Advanced ADX calculation with directional movement analysis
Multi-timeframe ATR analysis for volatility assessment
Regime classification with confirmation logic
Strength, persistence, and quality scoring systems
Session awareness with timezone handling
Comprehensive visualization with multiple display modes
Real-time dashboard with 10 key metrics
Alert conditions for regime changes and thresholds
Export functions for strategy integration
Historical regime tracking and pattern recognition
The code uses confirmed bars for all calculations to prevent repainting and ensure reliable regime classification.
Originality Statement
This indicator is original in its comprehensive approach to regime classification and market state analysis. While ADX and ATR are established tools, this indicator is justified because:
It synthesizes trend and volatility analysis into a unified regime classification system
The strength, persistence, and quality scoring provides multi-dimensional regime assessment
Session awareness adds critical context often missing from regime analysis
Regime transition detection helps traders adapt strategy changes proactively
The four-regime classification (Trending, Ranging, Volatile, Neutral) covers all market states
Quality assessment helps distinguish between clear and ambiguous market conditions
Persistence analysis identifies mature, reliable regimes versus new, potentially false ones
Comprehensive visualization makes complex regime analysis accessible and actionable
Export functions enable regime-based strategy filtering and adaptation
Each component provides unique insights: ADX shows trend, ATR shows volatility, strength shows conviction, persistence shows duration, and quality shows clarity
The indicator's value lies in transforming the abstract concept of "market conditions" into concrete, actionable classifications that traders can use to adapt their strategies systematically and consistently.
Disclaimer
This indicator is provided for educational and informational purposes only. It is not financial advice or a recommendation to buy or sell any financial instrument. Regime classification is a tool for understanding market conditions, not a prediction system.
Market regimes can change suddenly due to news events, economic data, or changes in market structure. Past regime behavior does not guarantee future patterns. The indicator's classifications are mathematical calculations based on historical patterns and should be used in conjunction with other forms of analysis.
Always use proper risk management, including stop losses and position sizing appropriate for current market conditions. Different regimes require different risk approaches - volatile regimes may require smaller positions and wider stops.
The author is not responsible for any losses incurred from using this indicator. Users assume full responsibility for all trading decisions made using this system.
-Made with passion by officialjackofalltrades
อินดิเคเตอร์
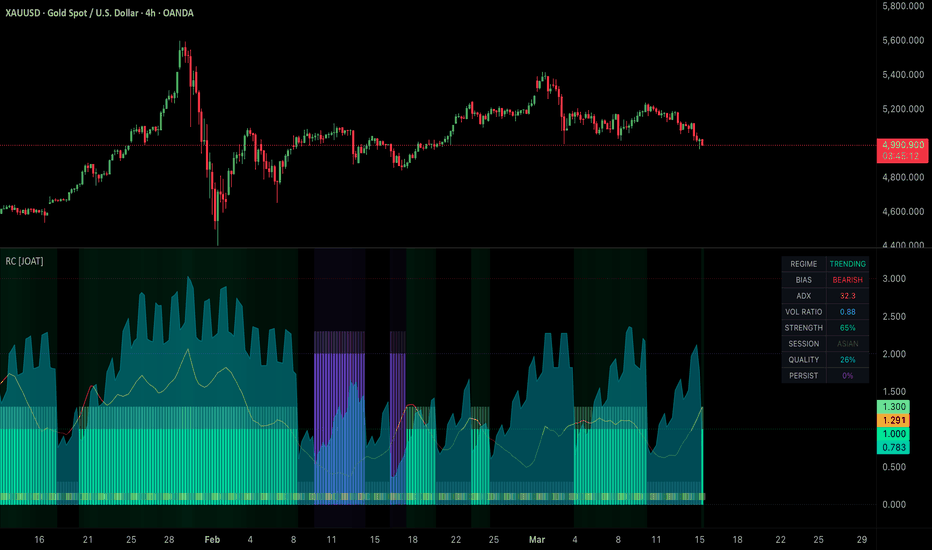
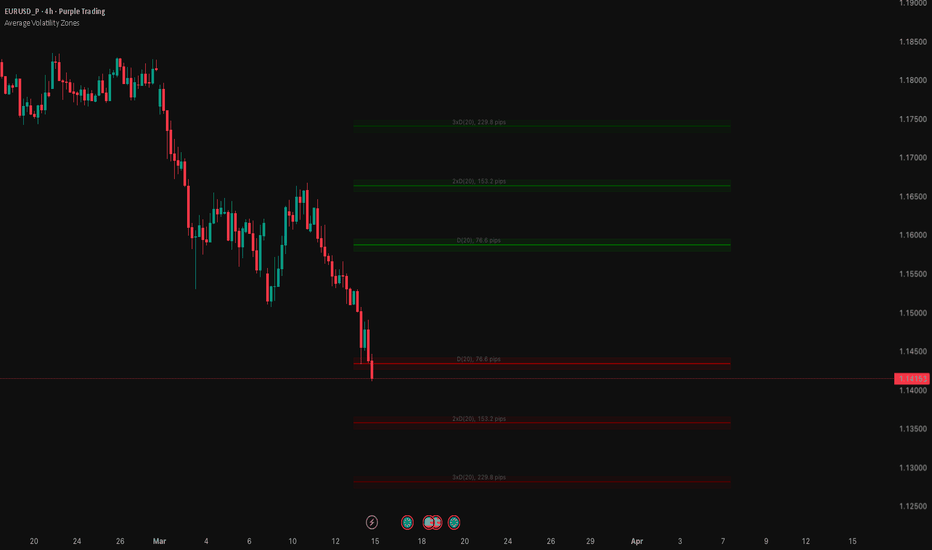
Average Volatility ZonesDisplays the average volatility range directly on the chart as horizontal levels projected from the current period's open.
The indicator calculates the average candle size (High-Low or True Range) over a configurable period and timeframe (default: Daily, 20 bars), then draws upper and lower lines at that distance from the current timeframe open — showing how far price typically moves within one period.
Key features:
- Multi-timeframe support — measure volatility from any timeframe (M15 to Monthly)
- Scalable levels — optional 2x, 3x, and custom multiplier levels for extended volatility zones
- Zone mode — converts lines into shaded bands based on a percentage of the average volatility
- Automatic pip detection for forex pairs (supports 5-digit and 3-digit brokers)
- Each level is labeled with its timeframe, period, and value in pips
- Fully customizable colors, line styles, label positioning, and zone transparency
Useful for gauging intraday range potential, setting realistic targets, identifying overextended moves, and filtering entries near volatility extremes. อินดิเคเตอร์