อินดิเคเตอร์
อินดิเคเตอร์

BB Volatility Squeeze MomentumBB Volatility Squeeze / Expansion
This indicator highlights periods when Bollinger Bands are tight relative to price (a volatility squeeze) versus wider expansion phases. Squeeze conditions can be based on Keltner Channels, a percentile of BB width, or both.
What it shows on the chart
Bollinger Bands (upper, lower, SMA basis) drawn on price. Band and fill colors switch with squeeze state: cool tones (blue) when a squeeze is active, warm tones (orange) when it is not.
Small dots under each bar summarize how each underlying squeeze method reads that bar:
Green: neither Keltner nor percentile squeeze
Red: Keltner squeeze only
Orange: percentile squeeze only
Yellow: both methods agree (squeeze on both)
Dot vertical position is controlled as a percentage of the bar range below the low.
Squeeze logic (summary)
Keltner-based: Squeeze when the Bollinger envelope sits inside the Keltner envelope (BB lower above KC lower and BB upper below KC upper).
Percentile-based: Computes BB width as (upper - lower) / basis. Squeeze when the percent rank of that width over the lookback is below your threshold (e.g. unusually narrow vs. recent history).
Squeeze method input chooses Keltner only, percentile only, or either (fires if either condition is true). The active squeeze used for band coloring follows that choice; the dots always show both methods for comparison.
Multi-timeframe (MTF) table
A table in the top-right shows four user-selected timeframes. For each TF it reports whether Keltner and percentile squeezes are on (SQZ) or off (—), with red/green cell backgrounds. Calculations use request.security() with no lookahead.
Inputs (by group)
Bollinger Bands: length, standard-deviation multiplier.
Keltner Channels: length, ATR multiplier.
Percentile method: lookback bars for the percent rank, squeeze threshold (percentile).
Squeeze method: Keltner / percentile / both.
MTF table: four timeframe strings (defaults: 15m, 1h, 4h, daily).
Visuals: squeeze dot offset below the bar (% of range).
License
This source code is subject to the terms of the Mozilla Public License 2.0.
อินดิเคเตอร์

Bollinger Bands Bull/Bear B2Bollinger Bands Bull/Bear
by MasterTony
Overview & How It Works:
This indicator enhances classic Bollinger Bands by the legendary John Bollinger with emphasizing dynamic bull/bear coloring, gradient strength fills, overextension highlights, and an orange squeeze overlay to visualize volatility contraction.
Core Calculations:
Basis Line: User-selectable moving average (SMA by default) of the source (close by default).
Upper / Lower Bands: Basis ± (Multiplier × Standard Deviation over the chosen length). Default multiplier = 2.0.
Bull / Bear State Determination: Price position relative to the basis and outer or lower bollinger bands, smoothed with a short EMA.
Hysteresis is applied to prevent rapid flipping during consolidation.
Result: stable bullish state when price is convincingly above the basis, bearish when below.
Proximity & Gradient Strength: Distance from price to each band is measured and normalized against current band width.
The closer price is to a band, the stronger the signal and the more opaque the fill becomes.
Colored Band Fills: Bullish state → mint-green fills around both bands (brighter/opaquer when price hugs the upper band).
Bearish state → red fills around both bands (brighter/opaquer when price hugs the lower band).
Special Overextension Fill:
When price is very close (>85%) to the "active" band (upper in bull, lower in bear) and the state is confirmed, a Brighter gradient of the band green (bull) or lred (bear).
Strong Vs Weak Bollinger
Thicker the Bollinger Band stronger the trend, thinner the weaker. Gradient going from brighter to more transparent highlights potential exhaustion of strong Bollinger.
Squeeze Detection (Orange Overlay):
Bollinger Band Width Percentile (BBWP) is calculated over a user-defined lookback (default 100 bars).
Squeeze = BBWP ≤ 25% (bands are historically narrow).
Tight squeeze = BBWP < 15% → brighter orange.
Orange fill covers the entire area between upper and lower bands during squeeze periods.
Toggle available to hide squeeze fills if desired.
How to Read & Trade This Indicator
Visual Interpretation:
Green-dominant chart (mint fills + possible light-green basis-to-band fill) = bullish bias. The brighter and fuller the green, the stronger the momentum (price pushing against or touching the upper band).
Red-dominant chart (red fills + possible light-red basis-to-band fill) = bearish bias. Brighter/fuller red = stronger downward pressure.
Light special fills (light green or light red from basis to band) = overextension zone. Often seen near trend extremes — watch for continuation (breakout) or reversal (failure to hold the band).
Orange overlay = low volatility / squeeze. Two shades:
Lighter orange = regular squeeze (potential move brewing).
Brighter orange = very tight squeeze (high probability of imminent explosive move).
Trading Guidelines:
Trend Following (Shows Bull Zone and Bear Zones):
In green fills → favor longs or hold existing longs.
In red fills → favor shorts or hold existing shorts.
Strength increases as fills become more opaque (price near the outer band).
Squeeze Breakouts (Highest Probability Setups):
Wait for orange squeeze to appear.
When price closes outside the bands (breakout), enter in the direction of the break.
Bias the trade toward the prevailing color:Breakout upward during green fills = strong long signal.
Breakout downward during red fills = strong short signal.
If breakout direction opposes the color bias, be cautious (lower probability).
Entry/Exits:
Follow the Band color, Band color with special fill green or red is strong to determining Bull or Bear states. Green=price up Red= Price down
Risk Management:
Use the basis line as dynamic support/resistance.
Stops can be placed just beyond the opposite band or basis during strong trends.
Combine with volume or other confirmation for higher conviction.
This visual upgrade makes Bollinger Bands far more intuitive — the chart literally colors itself bullish or bearish while highlighting volatility cycles and overextension zones. Great for trend, breakout, and mean-reversion strategies across any timeframe.
Enjoy fellow traders, this is V1 more versions will be updated.
Please also boost and comment would love your ideas on advancements to this.
Cheers,
MasterTony อินดิเคเตอร์

Lumina Trend Channels [Pineify]Lumina Trend Channels
The Lumina Trend Channels is a dynamic, volatility-adaptive channel system that combines an Exponential Moving Average (EMA) baseline with Average True Range (ATR) band projections and slope-based trend detection to create a visually intuitive, all-in-one trend-following overlay. Unlike static channel indicators that use fixed-width bands, Lumina Trend Channels automatically expands and contracts its four-band envelope in real time as market volatility changes, keeping the channel structure relevant across all market conditions. The channel color shifts between bullish and bearish states based on the direction of the baseline slope, and buy/sell signals are generated only when price crosses the baseline in alignment with the confirmed trend — filtering out counter-trend noise and providing cleaner entry timing for trend traders.
Key Features
EMA baseline with ATR-scaled bands — a responsive center line surrounded by four symmetrical bands whose width adapts dynamically to current volatility via ATR measurement.
Slope-based trend detection — trend direction is determined by whether the EMA baseline has risen or fallen for two consecutive bars, providing a simple yet effective trend filter.
Trend-aligned buy/sell signals — BUY signals trigger only when price crosses above the baseline during a confirmed uptrend; SELL signals trigger only during a confirmed downtrend, eliminating counter-trend false entries.
Gradient-style visual channel — layered fills with progressive transparency create a glowing channel effect that fades outward from the baseline, making trend direction and volatility state immediately visible.
Trend change markers — circle markers appear on the baseline at the exact bar where the trend flips, providing clear visual anchors for regime changes.
Built-in alert conditions — configurable alerts for buy signals, sell signals, and trend changes for hands-free monitoring.
How It Works
The indicator follows a three-stage calculation process to construct the channel and generate signals:
Baseline calculation via EMA: The closing price is smoothed using an Exponential Moving Average with a configurable period (default: 21). The EMA was chosen over SMA because it assigns greater weight to recent prices, producing a center line that reacts faster to price changes while maintaining smoothness. This baseline serves as both the channel center and the reference line for signal generation.
Volatility measurement via ATR: The Average True Range is calculated over the same lookback period as the EMA. ATR measures the average bar range (accounting for gaps), providing a robust volatility metric. Four bands are then projected symmetrically around the baseline: inner bands at basis ± ATR × inner multiplier (default: 1.0) and outer bands at basis ± ATR × outer multiplier (default: 2.0). As volatility expands, the bands widen; as it contracts, they narrow — keeping the channel proportional to actual market conditions.
Trend detection via baseline slope: The trend state is determined by checking whether the EMA baseline has been rising (increasing for 2 consecutive bars) or falling (decreasing for 2 consecutive bars). If rising, the trend is set to bullish; if falling, bearish. If neither condition is met, the previous trend state is maintained. This persistence mechanism prevents rapid trend flipping during sideways consolidation.
Trading Ideas and Insights
The Lumina Trend Channels is designed to serve multiple trading approaches across different timeframes and markets:
Trend-following entries: The primary use case — when a BUY triangle appears below a bar, it means price has crossed above the EMA baseline while the channel is green (bullish). This confirms that the immediate price action and the broader trend are aligned. Enter long and consider the upper inner or outer band as a potential profit target. The SELL triangle is the mirror setup for short entries during bearish channels.
Volatility-based position sizing: The ATR-driven band width provides a built-in volatility gauge. When the channel is wide, the market is volatile — consider smaller position sizes or wider stops. When the channel is narrow, volatility is compressed — tighter stops may be appropriate, and a breakout from the narrow channel often precedes a strong directional move.
Dynamic support and resistance: The inner and outer bands act as dynamic support/resistance levels. In an uptrend, pullbacks to the lower inner band often find support; in a downtrend, rallies to the upper inner band often meet resistance. The outer bands represent extreme volatility extensions where price is statistically stretched.
Trend change detection: The circle markers on the baseline highlight the exact moment the trend flips. These are valuable for swing traders who want to exit positions when the trend turns against them, or for traders looking to enter early in a new trend direction.
How Multiple Indicators Work Together
The Lumina Trend Channels integrates three technical components into a unified system, each serving a distinct analytical role:
Exponential Moving Average (trend center): The EMA provides the structural backbone of the channel. It defines the center line around which all bands are constructed and serves as the crossover reference for signal generation. Its low-lag property ensures the channel tracks price closely, keeping the entire system responsive to current market conditions.
Average True Range (volatility scaling): ATR transforms the channel from a fixed-width envelope into a volatility-adaptive one. By scaling band distances with ATR, the channel automatically adjusts to the market's current behavior — wide during volatile periods, narrow during quiet ones. This means the bands always represent statistically meaningful distance from the baseline, regardless of the instrument or timeframe.
Slope-based trend filter (directional bias): The trend detection layer adds a directional gate to the entire system. Without it, every EMA crossover would generate a signal — including counter-trend ones during choppy markets. By requiring the baseline to be actively rising (for buys) or falling (for sells), the trend filter ensures signals only fire when the broader directional context supports the trade.
The synergy is layered: EMA establishes the trend center → ATR scales the channel to current volatility → slope detection determines the trend state → signals fire only when price action and trend direction agree. This multi-layer filtering produces a system where each component reinforces the others, resulting in higher-conviction signals than any single component could provide alone.
Unique Aspects
Volatility-adaptive channel with trend coloring: While many channel indicators use either fixed bands (like Bollinger Bands with standard deviation) or trend coloring separately, Lumina Trend Channels combines ATR-driven dynamic width with slope-based trend coloring in a single overlay. The result is a channel that communicates both volatility state and trend direction simultaneously through its shape and color.
Gradient transparency design: The four-layer fill system uses progressive transparency — inner zones are more opaque, outer zones more transparent — creating a natural visual gradient that draws the eye toward the baseline. This design choice makes it immediately obvious where the channel center is and how far price has extended from it.
Trend-gated signals: Rather than generating signals on every baseline crossover, the indicator requires trend confirmation before triggering entries. This simple but effective filter dramatically reduces false signals during sideways or transitional market phases, where most crossover-based systems struggle.
Minimal parameter design: With only three calculation inputs (length, outer multiplier, inner multiplier), the indicator avoids over-parameterization. The single length parameter controls both the EMA and ATR simultaneously, ensuring the baseline and volatility measure are always in sync.
How to Use
Add the indicator to your chart. It overlays directly on the price chart, displaying a four-band channel with a central baseline, all colored according to the current trend direction.
Observe the channel color: green indicates a bullish trend (baseline is rising), red indicates a bearish trend (baseline is falling). Trade in the direction of the channel color for higher-probability setups.
Watch for BUY triangles (green, below bars) — these appear when price crosses above the baseline during a confirmed uptrend. Consider entering long with a stop below the lower inner or outer band.
Watch for SELL triangles (red, above bars) — these appear when price crosses below the baseline during a confirmed downtrend. Consider entering short with a stop above the upper inner or outer band.
Use the circle markers on the baseline to identify trend changes. These mark the exact bar where the channel flipped color, useful for timing exits or preparing for new trend entries.
Monitor the channel width as a volatility gauge — wide channels mean high volatility, narrow channels mean low volatility and potential breakout setups.
Set up alerts using the built-in alert conditions for buy signals, sell signals, and trend changes to automate your monitoring.
Customization
Channel Length (default: 21): Controls both the EMA baseline period and the ATR lookback. Lower values (e.g., 10–14) make the channel more responsive and generate more signals, suitable for shorter timeframes or scalping. Higher values (e.g., 34–55) produce a smoother, more stable channel for swing trading or higher timeframes.
Outer Band Multiplier (default: 2.0): Scales the distance of the outer bands from the baseline. Increase for wider outer bands that capture more extreme price extensions; decrease for tighter outer bands that stay closer to price action.
Inner Band Multiplier (default: 1.0): Scales the distance of the inner bands from the baseline. Adjust to control the width of the inner channel zone. A value of 0.5 creates a narrow inner zone; a value of 1.5 widens it.
Bullish Color (default: green): The color applied to all channel elements during uptrends. Customize to match your chart theme.
Bearish Color (default: red): The color applied to all channel elements during downtrends. Customize to match your chart theme.
Conclusion
The Lumina Trend Channels delivers a clean, volatility-adaptive channel overlay that combines EMA-based trend tracking, ATR-driven dynamic band scaling, and slope-based trend detection into a single, cohesive indicator. Its gradient-style visual design provides immediate, at-a-glance understanding of trend direction, volatility state, and price position within the channel. By gating buy and sell signals with trend confirmation, the indicator filters out counter-trend noise and delivers higher-conviction entries aligned with the prevailing market direction. Whether you trade stocks, forex, crypto, or futures, the Lumina Trend Channels adapts to your instrument and timeframe, offering a refined approach to trend-following and volatility-aware trading decisions.
อินดิเคเตอร์

GCM RSI Ultra ScalperDescription:
Title: GCM RSI Ultra Scalper (GCM RUS)
"Engineering Edge. Executing Precision."
-uniGram
📌 Overview
The GCM RSI Ultra Scalper is an institutional-grade momentum and volatility engine engineered for precision trading. Unlike traditional static oscillators that fail during strong trends, this hybrid system dynamically adapts to market conditions by layering real-time price action over an advanced dual-ribbon architecture.
Designed to eliminate cognitive load, it visually synthesizes trend direction, momentum shifts, and volatility extremes into one cohesive control panel, powered by a highly optimized, zero-lag backend.
⚙️ Core Mechanics
• Dynamic Volatility Bands: Eliminates the flaw of static overbought/oversold levels. By utilizing Bollinger Bands (1.5 & 2.0 Standard Deviations) mapped directly onto a smoothed RSI, the indicator highlights high-probability mean-reversion zones relative to recent market volatility.
• Dual-Ribbon Architecture: The Macro Ribbon defines the broader market regime (the background gradient), while the Micro Ribbon isolates immediate short-term momentum shifts. This intrinsic filtering ensures that scalping entries are strictly aligned with the dominant institutional flow.
• Algorithmic Divergence Detection: A hyper-sensitive, computation-optimized divergence engine (1-bar default lookback) automatically identifies both hidden and regular pivot shifts, offering deeper context into momentum exhaustion and trend continuations.
• Real-Time Pro Dashboard: A sleek, institutional-grade widget that actively tracks exact RSI mathematical values, immediate micro signals, and the overarching macro regime. It dynamically color-shifts to alert you the moment price enters overextended zones.
📖 How to Trade Like a Pro
This indicator is built to be an execution trigger, best paired with your existing support/resistance or supply/demand analysis on the main chart.
🟢 High-Probability Long (Buy) Setup:
1. Macro Filter: Ensure the background Macro Ribbon is trending upwards (above the 50 Mid Line).
2. Volatility Stretch: Look for the Smoothed RSI to dip into the bottom green Bollinger Band ribbon (80% transparent zone), indicating an oversold extreme relative to current volatility.
3. The Trigger: Enter when the Micro Ribbon turns Bullish (Green) and crosses above the Short MA. A Bullish Divergence label ("R" or "H") adds heavy confluence.
🔴 High-Probability Short (Sell) Setup:
1. Macro Filter: Ensure the background Macro Ribbon is trending downwards (below the 50 Mid Line).
2. Volatility Stretch: Look for the Smoothed RSI to push up into the top red Bollinger Band ribbon, indicating it is mathematically overextended.
3. The Trigger: Enter when the Micro Ribbon turns Bearish (Red) and crosses below the Short MA.
🛠️ Customization & Settings
The GCM RUS is highly modular. In the settings panel, you can adjust:
• Smoothing Types: Choose between 10 different moving average algorithms (LSMA, EMA, ALMA, etc.) for both the RSI and the Signal Line.
• Divergence Sensitivity: Adjust the Left/Right lookback periods (defaulted to an ultra-fast 1,1 for scalping).
• Dashboard Control: Instantly reposition the Pro Dashboard to any corner of your screen or adjust its text scaling to perfectly fit your monitor.
• Clean UI: All complex background matrix calculations are hard-coded to remain hidden from the Style tab, leaving you with only the core toggles.
Disclaimer:
This script is an analytical tool and does not constitute financial advice. Always backtest strategies and manage your risk.
HAPPY TRADING
________________________________________
(Explanation in Kannada Language/ ಕನ್ನಡ ಭಾಷೆಯಲ್ಲಿ ವಿವರಣೆ)
Title: GCM RSI ಅಲ್ಟ್ರಾ ಸ್ಕಾಲ್ಪರ್ (GCM RUS)
"ತಾಂತ್ರಿಕತೆಯ ಶಕ್ತಿ. ಟ್ರೇಡಿಂಗ್ನಲ್ಲಿ ನಿಖರತೆ."
-uniGram
📌 ಅವಲೋಕನ
GCM RSI ಅಲ್ಟ್ರಾ ಸ್ಕಾಲ್ಪರ್ ನಿಖರವಾದ ಟ್ರೇಡಿಂಗ್ಗಾಗಿ ವಿನ್ಯಾಸಗೊಳಿಸಲಾದ ಸಾಂಸ್ಥಿಕ-ಮಟ್ಟದ (institutional-grade) ಮೊಮೆಂಟಮ್ ಮತ್ತು ವೊಲಟಿಲಿಟಿ ಎಂಜಿನ್ ಆಗಿದೆ. ಬಲವಾದ ಟ್ರೆಂಡ್ಗಳಲ್ಲಿ ವಿಫಲವಾಗುವ ಸಾಂಪ್ರದಾಯಿಕ ಸ್ಟ್ಯಾಟಿಕ್ ಆಸಿಲೇಟರ್ಗಳಿಗಿಂತ ಭಿನ್ನವಾಗಿ, ಈ ಹೈಬ್ರಿಡ್ ಸಿಸ್ಟಮ್ ಅತ್ಯಾಧುನಿಕ ಡ್ಯುಯಲ್-ರಿಬ್ಬನ್ ಆರ್ಕಿಟೆಕ್ಚರ್ ಬಳಸಿ ಮಾರುಕಟ್ಟೆಯ ನೈಜ-ಸಮಯದ ಬದಲಾವಣೆಗಳಿಗೆ ಕ್ರಿಯಾತ್ಮಕವಾಗಿ ಹೊಂದಿಕೊಳ್ಳುತ್ತದೆ.
ಟ್ರೆಂಡ್ ದಿಕ್ಕು, ಮೊಮೆಂಟಮ್ ಬದಲಾವಣೆಗಳು ಮತ್ತು ಮಾರುಕಟ್ಟೆಯ ವೊಲಟಿಲಿಟಿಯನ್ನು ಒಂದೇ ಸ್ಕ್ರೀನ್ನಲ್ಲಿ ಸ್ಪಷ್ಟವಾಗಿ ತೋರಿಸುವ ಮೂಲಕ ಟ್ರೇಡರ್ಗಳಿಗೆ ತ್ವರಿತ ಮತ್ತು ನಿಖರ ನಿರ್ಧಾರ ತೆಗೆದುಕೊಳ್ಳಲು ಇದು ಸಹಾಯ ಮಾಡುತ್ತದೆ.
⚙️ ಮುಖ್ಯ ಲಕ್ಷಣಗಳು ಮತ್ತು ಕಾರ್ಯವಿಧಾನ
• ಡೈನಾಮಿಕ್ ವೊಲಟಿಲಿಟಿ ಬ್ಯಾಂಡ್ಗಳು: ಇದು ಸಾಂಪ್ರದಾಯಿಕ ಓವರ್ಬಾಟ್/ಓವರ್ಸೋಲ್ಡ್ (80/20) ಲೆವೆಲ್ಗಳ ದೋಷವನ್ನು ನಿವಾರಿಸುತ್ತದೆ. ಸ್ಮೂತ್ ಮಾಡಲಾದ RSI ಮೇಲೆ ನೇರವಾಗಿ ಬೋಲಿಂಜರ್ ಬ್ಯಾಂಡ್ಗಳನ್ನು (1.5 ಮತ್ತು 2.0 SD) ಅನ್ವಯಿಸುವ ಮೂಲಕ, ಮಾರುಕಟ್ಟೆಯ ವಾಸ್ತವಿಕ ವೊಲಟಿಲಿಟಿಗೆ ಅನುಗುಣವಾಗಿ ಹೈ-ಪ್ರಾಬಬಿಲಿಟಿ ರಿವರ್ಸಲ್ ವಲಯಗಳನ್ನು ನಿಖರವಾಗಿ ಗುರುತಿಸುತ್ತದೆ.
• ಡ್ಯುಯಲ್-ರಿಬ್ಬನ್ ಆರ್ಕಿಟೆಕ್ಚರ್: ಮ್ಯಾಕ್ರೋ ರಿಬ್ಬನ್ (ಹಿನ್ನೆಲೆಯ ಬಣ್ಣ) ಮಾರುಕಟ್ಟೆಯ ಪ್ರಮುಖ ಟ್ರೆಂಡ್ ಅನ್ನು ಸೂಚಿಸಿದರೆ, ಮೈಕ್ರೋ ರಿಬ್ಬನ್ ಅಲ್ಪಾವಧಿಯ ಮೊಮೆಂಟಮ್ ಬದಲಾವಣೆಗಳನ್ನು ಪ್ರತ್ಯೇಕಿಸುತ್ತದೆ. ಇದು ಪ್ರಮುಖ ಟ್ರೆಂಡ್ಗೆ ಅನುಗುಣವಾಗಿ ಮಾತ್ರ ಸ್ಕಾಲ್ಪಿಂಗ್ ಎಂಟ್ರಿಗಳನ್ನು ತೆಗೆದುಕೊಳ್ಳಲು ಖಚಿತಪಡಿಸುತ್ತದೆ.
• ಅಲ್ಗಾರಿದಮಿಕ್ ಡೈವರ್ಜೆನ್ಸ್ ಡಿಟೆಕ್ಷನ್: ಅತ್ಯಂತ ವೇಗವಾದ (zero-lag) ಡೈವರ್ಜೆನ್ಸ್ ಎಂಜಿನ್ (ಡೀಫಾಲ್ಟ್ 1-ಬಾರ್ ಲುಕ್ಬ್ಯಾಕ್) ಮಾರುಕಟ್ಟೆಯ ಹಿಡನ್ (hidden) ಮತ್ತು ರೆಗ್ಯುಲರ್ (regular) ಪಿವೋಟ್ ಬದಲಾವಣೆಗಳನ್ನು ಸ್ವಯಂಚಾಲಿತವಾಗಿ ಗುರುತಿಸಿ, ಟ್ರೆಂಡ್ ಅಂತ್ಯಗೊಳ್ಳುವ ಅಥವಾ ಮುಂದುವರೆಯುವ ಮುನ್ಸೂಚನೆಯನ್ನು ನೀಡುತ್ತದೆ.
• ರಿಯಲ್-ಟೈಮ್ ಪ್ರೊ ಡ್ಯಾಶ್ಬೋರ್ಡ್: ಇದು ಒಂದು ಸ್ಲೀಕ್ (sleek) ಮತ್ತು ವೃತ್ತಿಪರ ವಿಜೆಟ್ ಆಗಿದ್ದು, ನಿಖರವಾದ RSI ಮೌಲ್ಯ, ಮೈಕ್ರೋ ಸಿಗ್ನಲ್ ಮತ್ತು ಮ್ಯಾಕ್ರೋ ಟ್ರೆಂಡ್ ಅನ್ನು ನೈಜ-ಸಮಯದಲ್ಲಿ ಟ್ರ್ಯಾಕ್ ಮಾಡುತ್ತದೆ. ಮಾರುಕಟ್ಟೆ ಓವರ್ಬಾಟ್/ಓವರ್ಸೋಲ್ಡ್ ವಲಯಗಳನ್ನು ತಲುಪಿದಾಗ ಎಚ್ಚರಿಸಲು ಇದರ ಬಣ್ಣಗಳು ಸ್ವಯಂಚಾಲಿತವಾಗಿ ಬದಲಾಗುತ್ತವೆ.
📖 ವೃತ್ತಿಪರರಂತೆ ಟ್ರೇಡ್ ಮಾಡುವುದು ಹೇಗೆ
ಈ ಇಂಡಿಕೇಟರ್ ಅನ್ನು ಎಂಟ್ರಿ ಟ್ರಿಗ್ಗರ್ ಆಗಿ ಬಳಸಲು ವಿನ್ಯಾಸಗೊಳಿಸಲಾಗಿದೆ. ನಿಮ್ಮ ಮುಖ್ಯ ಚಾರ್ಟ್ನಲ್ಲಿರುವ ಸಪೋರ್ಟ್/ರೆಸಿಸ್ಟೆನ್ಸ್ (Support/Resistance) ಜೊತೆಗೆ ಇದನ್ನು ಬಳಸಿದಾಗ ಅತ್ಯುತ್ತಮ ಫಲಿತಾಂಶ ಸಿಗುತ್ತದೆ.
🟢 ಹೈ-ಪ್ರಾಬಬಿಲಿಟಿ ಲಾಂಗ್ (Buy) ಸೆಟಪ್:
1. ಮ್ಯಾಕ್ರೋ ಫಿಲ್ಟರ್: ಹಿನ್ನೆಲೆಯ ಮ್ಯಾಕ್ರೋ ರಿಬ್ಬನ್ ಮೇಲ್ಮುಖವಾಗಿರಬೇಕು (50 ಮಿಡ್ ಲೈನ್ನ ಮೇಲೆ).
2.ವೊಲಟಿಲಿಟಿ ಸ್ಟ್ರೆಚ್: ಸ್ಮೂತ್ ಮಾಡಲಾದ RSI ಕೆಳಗಿನ ಹಸಿರು ಬೋಲಿಂಜರ್ ಬ್ಯಾಂಡ್ ರಿಬ್ಬನ್ (80% ಪಾರದರ್ಶಕ ವಲಯ) ಒಳಗೆ ಪ್ರವೇಶಿಸುತ್ತದೆಯೇ ಎಂದು ಗಮನಿಸಿ. ಇದು ಪ್ರಸ್ತುತ ವೊಲಟಿಲಿಟಿಗೆ ಅನುಗುಣವಾಗಿ ಓವರ್ಸೋಲ್ಡ್ (oversold) ಸ್ಥಿತಿಯನ್ನು ಸೂಚಿಸುತ್ತದೆ.
3. ಟ್ರಿಗ್ಗರ್ (ಎಂಟ್ರಿ): ಮೈಕ್ರೋ ರಿಬ್ಬನ್ ಹಸಿರು ಬಣ್ಣಕ್ಕೆ ತಿರುಗಿ ಶಾರ್ಟ್ MA ಯನ್ನು ಮೇಲಕ್ಕೆ ಕ್ರಾಸ್ ಮಾಡಿದಾಗ ಎಂಟ್ರಿ ತೆಗೆದುಕೊಳ್ಳಿ. ಬುಲ್ಲಿಶ್ ಡೈವರ್ಜೆನ್ಸ್ ("R" ಅಥವಾ "H" ಲೇಬಲ್) ಇದ್ದರೆ ಅದು ನಿಮ್ಮ ಟ್ರೇಡ್ನ ಖಚಿತತೆಯನ್ನು ಹೆಚ್ಚಿಸುತ್ತದೆ.
🔴 ಹೈ-ಪ್ರಾಬಬಿಲಿಟಿ ಶಾರ್ಟ್ (Sell) ಸೆಟಪ್:
1. ಮ್ಯಾಕ್ರೋ ಫಿಲ್ಟರ್: ಹಿನ್ನೆಲೆಯ ಮ್ಯಾಕ್ರೋ ರಿಬ್ಬನ್ ಕೆಳಮುಖವಾಗಿರಬೇಕು (50 ಮಿಡ್ ಲೈನ್ನ ಕೆಳಗೆ).
2. ವೊಲಟಿಲಿಟಿ ಸ್ಟ್ರೆಚ್: ಸ್ಮೂತ್ ಮಾಡಲಾದ RSI ಮೇಲಿನ ಕೆಂಪು ಬೋಲಿಂಜರ್ ಬ್ಯಾಂಡ್ ರಿಬ್ಬನ್ ಒಳಗೆ ಪ್ರವೇಶಿಸುತ್ತದೆಯೇ ಎಂದು ಗಮನಿಸಿ. ಇದು ಓವರ್ಬಾಟ್ (overbought) ಸ್ಥಿತಿಯನ್ನು ಸೂಚಿಸುತ್ತದೆ.
3. ಟ್ರಿಗ್ಗರ್ (ಎಂಟ್ರಿ): ಮೈಕ್ರೋ ರಿಬ್ಬನ್ ಕೆಂಪು ಬಣ್ಣಕ್ಕೆ ತಿರುಗಿ ಶಾರ್ಟ್ MA ಯನ್ನು ಕೆಳಕ್ಕೆ ಕ್ರಾಸ್ ಮಾಡಿದಾಗ ಎಂಟ್ರಿ ತೆಗೆದುಕೊಳ್ಳಿ.
🛠️ ಗ್ರಾಹಕೀಕರಣ ಮತ್ತು ಸೆಟ್ಟಿಂಗ್ಗಳು (Customization)
GCM RUS ಅನ್ನು ಸುಲಭವಾಗಿ ಕಸ್ಟಮೈಸ್ ಮಾಡಬಹುದು. ಸೆಟ್ಟಿಂಗ್ಸ್ ಪ್ಯಾನೆಲ್ನಲ್ಲಿ ನೀವು ಈ ಕೆಳಗಿನವುಗಳನ್ನು ಬದಲಾಯಿಸಬಹುದು:
• ಸ್ಮೂಥಿಂಗ್ ಆಯ್ಕೆಗಳು: RSI ಮತ್ತು ಸಿಗ್ನಲ್ ಲೈನ್ಗಾಗಿ 10 ವಿಭಿನ್ನ ಮೂವಿಂಗ್ ಆವರೇಜ್ಗಳನ್ನು (LSMA, EMA, ALMA ಇತ್ಯಾದಿ) ಆಯ್ಕೆ ಮಾಡಬಹುದು.
• ಡೈವರ್ಜೆನ್ಸ್ ಸೆನ್ಸಿಟಿವಿಟಿ: ಲೆಫ್ಟ್/ರೈಟ್ ಲುಕ್ಬ್ಯಾಕ್ ಅವಧಿಗಳನ್ನು ಬದಲಾಯಿಸಬಹುದು (ಸ್ಕಾಲ್ಪಿಂಗ್ಗಾಗಿ ಡೀಫಾಲ್ಟ್ ಆಗಿ 1,1 ಗೆ ಹೊಂದಿಸಲಾಗಿದೆ).
• ಡ್ಯಾಶ್ಬೋರ್ಡ್ ಕಂಟ್ರೋಲ್: ಡ್ಯಾಶ್ಬೋರ್ಡ್ ಅನ್ನು ನಿಮ್ಮ ಸ್ಕ್ರೀನ್ನ ಯಾವುದೇ ಮೂಲೆಗೆ ಸುಲಭವಾಗಿ ವರ್ಗಾಯಿಸಬಹುದು ಮತ್ತು ಟೆಕ್ಸ್ಟ್ ಗಾತ್ರವನ್ನು ಸರಿಹೊಂದಿಸಬಹುದು.
• ಕ್ಲೀನ್ UI: ಟ್ರೇಡಿಂಗ್ಗೆ ಅಗತ್ಯವಿರುವ ಮುಖ್ಯ ಸೆಟ್ಟಿಂಗ್ಗಳನ್ನು ಮಾತ್ರ ಒದಗಿಸಿ, ಎಲ್ಲಾ ಸಂಕೀರ್ಣ ಲೆಕ್ಕಾಚಾರಗಳನ್ನು ಸ್ಟೈಲ್ (Style) ಟ್ಯಾಬ್ನಿಂದ ಮರೆಮಾಡಲಾಗಿದೆ.
ಹಕ್ಕು ನಿರಾಕರಣೆ:
ಈ ಸ್ಕ್ರಿಪ್ಟ್ ಒಂದು ವಿಶ್ಲೇಷಣಾತ್ಮಕ ಸಾಧನವಾಗಿದೆ ಮತ್ತು ಯಾವುದೇ ಆರ್ಥಿಕ ಸಲಹೆಯಲ್ಲ. ಟ್ರೇಡ್ ಮಾಡುವ ಮೊದಲು ಯಾವಾಗಲೂ ನಿಮ್ಮದೇ ಆದ ಬ್ಯಾಕ್ಟೆಸ್ಟ್ ಮಾಡಿ ಮತ್ತು ರಿಸ್ಕ್ ಮ್ಯಾನೇಜ್ಮೆಂಟ್ ಪಾಲಿಸಿ.
ಹ್ಯಾಪಿ ಟ್ರೇಡಿಂಗ್
อินดิเคเตอร์

Adaptive Volatility Matrix [JOAT]Adaptive Volatility Matrix
Introduction
The Adaptive Volatility Matrix (AVM) is an advanced open-source volatility regime classification indicator that combines Bollinger Band Width Percentile (BBWP), ATR percentile analysis, regime transition prediction, volatility clustering detection, and historical regime statistics to classify market conditions into distinct volatility regimes. This indicator helps traders adapt their strategies to current market conditions by systematically identifying when volatility is expanding, contracting, or transitioning between regimes.
Unlike basic volatility indicators that simply plot ATR or Bollinger Bands, AVM employs a sophisticated dual-metric system that combines BBWP (measuring price range compression/expansion) with ATR percentile (measuring absolute volatility) to create a combined volatility score (0-100%). The indicator then classifies this score into five distinct regimes and predicts regime transitions through momentum analysis.
Why This Indicator Exists
This indicator addresses the challenge of adapting trading strategies to volatility conditions. Different market regimes require different approaches - mean reversion works in low volatility, breakout strategies work in expansion, and risk management becomes critical in extreme volatility. AVM systematically reveals:
BBWP Analysis: Measures Bollinger Band width percentile to identify compression/expansion cycles
ATR Percentile: Tracks normalized ATR percentile to measure absolute volatility levels
Combined Volatility Score: Weighted average (60% BBWP, 40% ATR) for robust regime classification
Regime Classification: Five distinct regimes (Extreme Expansion, Expansion, Normal, Contraction, Extreme Contraction)
Transition Prediction: Momentum-based forecasting of next regime with probability
Volatility Clustering: Detects sustained high/low volatility periods
Historical Statistics: Tracks regime duration and frequency for context
Each component provides unique intelligence. BBWP shows compression cycles, ATR shows absolute volatility, combined score provides robust classification, regime system categorizes conditions, transition prediction anticipates changes, clustering detects persistence, and statistics provide historical context.
Core Components Explained
1. BBWP (Bollinger Band Width Percentile) Calculation
BBWP measures where current Bollinger Band width ranks relative to historical width:
f_calculate_bbwp(int length, int lookback) =>
float basis = ta.sma(close, length)
float dev = ta.stdev(close, length)
float bb_width = (dev * 2) / basis * 100
// Calculate percentile rank
int count = 0
for i = 1 to lookback
if bb_width > nz(bb_width )
count += 1
float bbwp = (count / lookback) * 100
BBWP ranges from 0-100%:
- 0-20%: Extreme compression (volatility squeeze)
- 20-40%: Contraction (below average volatility)
- 40-60%: Normal (average volatility)
- 60-80%: Expansion (above average volatility)
- 80-100%: Extreme expansion (volatility breakout)
2. ATR Percentile Analysis
ATR percentile measures where current normalized ATR ranks historically:
f_atr_percentile(int period, int lookback) =>
float atr_val = ta.atr(period)
float natr = close > 0 ? (atr_val / close) * 100 : 0.0
float percentile = ta.percentrank(natr, lookback)
Normalized ATR (NATR) accounts for price level differences, making volatility comparable across different price ranges. Percentile ranking shows where current volatility sits in historical distribution.
3. Combined Volatility Score & Regime Classification
The combined score weights BBWP more heavily than ATR percentile:
float combined_score = (bbwp_value * 0.6) + (atr_percentile * 0.4)
f_classify_regime(float bbwp_val, float atr_perc, float exp_th, float con_th, float ext_th) =>
string regime = "Normal"
int regime_code = 0
if bbwp_val >= ext_th or atr_perc >= ext_th
regime := "Extreme Expansion"
regime_code := 4
else if bbwp_val >= exp_th or atr_perc >= exp_th
regime := "Expansion"
regime_code := 3
// Additional classifications...
Five regime classifications:
1. Extreme Contraction (code 1): Both metrics <30%, volatility squeeze
2. Contraction (code 2): One metric <40%, below average volatility
3. Normal (code 0): Both metrics 40-60%, average conditions
4. Expansion (code 3): One metric >70%, above average volatility
5. Extreme Expansion (code 4): Both metrics >85%, volatility breakout
4. Regime Transition Prediction
AVM predicts next regime through momentum analysis:
float regime_momentum = combined_score - combined_score
string momentum_direction = regime_momentum > 2 ? "Accelerating" :
regime_momentum < -2 ? "Decelerating" : "Stable"
string predicted_regime = regime_code == 4 and regime_momentum < -5 ? "→ Expansion" :
regime_code == 3 and regime_momentum < -3 ? "→ Normal" :
// Additional predictions...
"Stable"
float transition_prob = math.min(math.abs(regime_momentum) * 10, 100)
Transition probability (0-100%) based on momentum magnitude. >50% probability triggers warning.
5. Volatility Clustering Detection
Clustering identifies sustained high/low volatility periods:
int cluster_lookback = 20
float cluster_threshold = 70.0
int high_vol_count = 0
for i = 0 to cluster_lookback - 1
if combined_score >= cluster_threshold
high_vol_count += 1
float cluster_ratio = high_vol_count / cluster_lookback * 100
bool in_vol_cluster = cluster_ratio >= 60 // 60% of bars are high vol
string cluster_strength = cluster_ratio >= 80 ? "Strong" :
cluster_ratio >= 60 ? "Moderate" :
cluster_ratio >= 40 ? "Weak" : "None"
Clusters indicate persistent volatility conditions that tend to continue.
6. Historical Regime Statistics
AVM tracks regime history for context:
var array regime_history = array.new_int(0)
var array regime_durations = array.new_int(0)
if regime_changed
array.push(regime_history, regime_code)
array.push(regime_durations, bars_in_regime)
// Calculate statistics
float avg_expansion_duration = exp_sum / exp_cnt
float avg_contraction_duration = con_sum / con_cnt
float duration_ratio = bars_in_regime / avg_expansion_duration
bool regime_extended = duration_ratio > 1.5
Statistics show if current regime is extended (>1.5x average duration), suggesting potential transition.
Visual Elements
Combined Score Line: Main plot (0-100%) with regime-based coloring
ATR Percentile Overlay: Circles showing ATR percentile for comparison
Histogram: Gradient-colored bars showing volatility score with regime colors
Reference Lines: 70% (expansion), 50% (neutral), 30% (contraction), 85% (extreme)
Background Zones: Regime-colored backgrounds (purple for expansion, yellow for contraction)
Transition Warnings: ⚠ symbols when transition probability >50%
BBWP Percentile Bands: 20th, 50th, 80th percentile circles for context
Dashboard: Real-time metrics including regime, score, BBWP, ATR%, trend, duration, momentum, transition prediction, cluster status, duration ratio, historical stats
Input Parameters
BBWP Parameters:
BBWP Length: Bollinger Band period (default: 13)
BBWP Lookback: Historical comparison period (default: 252)
ATR Analysis:
ATR Period: ATR calculation period (default: 14)
ATR Percentile Lookback: Historical ranking period (default: 100)
Regime Classification:
Expansion Threshold: Score for expansion regime (default: 70%)
Contraction Threshold: Score for contraction regime (default: 30%)
Extreme Threshold: Score for extreme regimes (default: 85%)
Visualization:
Show Regime Zones: Toggle background coloring
Show Histogram: Toggle volatility histogram
Show ATR Overlay: Toggle ATR percentile circles
How to Use This Indicator
Step 1: Identify Current Regime
Check dashboard "Regime" row. Adjust strategy based on classification.
Step 2: Monitor Combined Score
Score >70% = expansion (use breakout strategies)
Score <30% = contraction (use mean reversion)
Score 40-60% = normal (use balanced approach)
Step 3: Check Momentum Direction
"Accelerating" = volatility increasing
"Decelerating" = volatility decreasing
"Stable" = no significant change
Step 4: Watch for Transition Warnings
⚠ symbols indicate >50% probability of regime change. Prepare to adjust strategy.
Step 5: Assess Cluster Status
"Strong" or "Moderate" cluster = persistent conditions likely to continue
Step 6: Consider Duration Ratio
Ratio >1.5x = extended regime, higher probability of mean reversion
Best Practices
Use regime classification to select appropriate trading strategies
Extreme contraction often precedes volatility breakouts - prepare for expansion
Extreme expansion often mean-reverts - reduce position sizes
Transition warnings provide early signal to adjust risk management
Volatility clusters suggest persistence - don't fight the regime
Extended regimes (>1.5x average) have higher reversal probability
BBWP and ATR percentile divergence suggests regime uncertainty
Historical statistics provide context for current regime duration
Combine with directional indicators - AVM shows conditions, not direction
Indicator Limitations
Regime classification is backward-looking - transitions lag actual changes
BBWP calculation is computationally intensive on large lookback periods
Transition predictions are probabilistic, not deterministic
Extreme regimes can persist longer than expected during major events
Historical statistics require sufficient data (50+ regime changes)
Clustering detection has fixed lookback - may miss longer-term patterns
Combined score weighting (60/40) may not be optimal for all instruments
Regime thresholds may need adjustment for different markets
Technical Implementation
Built with Pine Script v6 using:
Custom BBWP calculation with percentile ranking
ATR percentile analysis with normalized ATR
Weighted combined score (60% BBWP, 40% ATR)
Five-tier regime classification system
Momentum-based transition prediction with probability
Volatility clustering detection (20-bar lookback)
Historical regime tracking with arrays (last 50 regimes)
Duration ratio calculation vs historical averages
BBWP percentile bands (20th, 50th, 80th)
Adaptive background coloring based on regime and duration
Comprehensive dashboard with 12 metrics
The code is fully open-source and can be modified to suit individual trading styles.
Originality Statement
This indicator is original in its comprehensive volatility regime classification approach. While BBWP and ATR are established concepts, this indicator is justified because:
It combines BBWP and ATR percentile into weighted combined score for robust classification
The five-tier regime system provides granular volatility categorization
Momentum-based transition prediction with probability quantification is unique
Volatility clustering detection identifies persistent regime conditions
Historical regime statistics provide context for current regime duration
Duration ratio calculation identifies extended regimes with mean reversion potential
BBWP percentile bands add additional context layers
Adaptive background intensity based on regime stability
Each component contributes unique information: BBWP shows compression cycles, ATR shows absolute volatility, combined score provides robust classification, regime system categorizes conditions, transition prediction anticipates changes, clustering detects persistence, statistics provide context, and duration ratio identifies extremes. The indicator's value lies in presenting these complementary perspectives simultaneously with unified regime framework.
Disclaimer
This indicator is provided for educational and informational purposes only. It is not financial advice. Regime classifications do not guarantee future volatility behavior. Trading involves substantial risk of loss. Past performance does not guarantee future results. Always use proper risk management and never risk more than you can afford to lose.
-Made with passion by officialjackofalltrades อินดิเคเตอร์

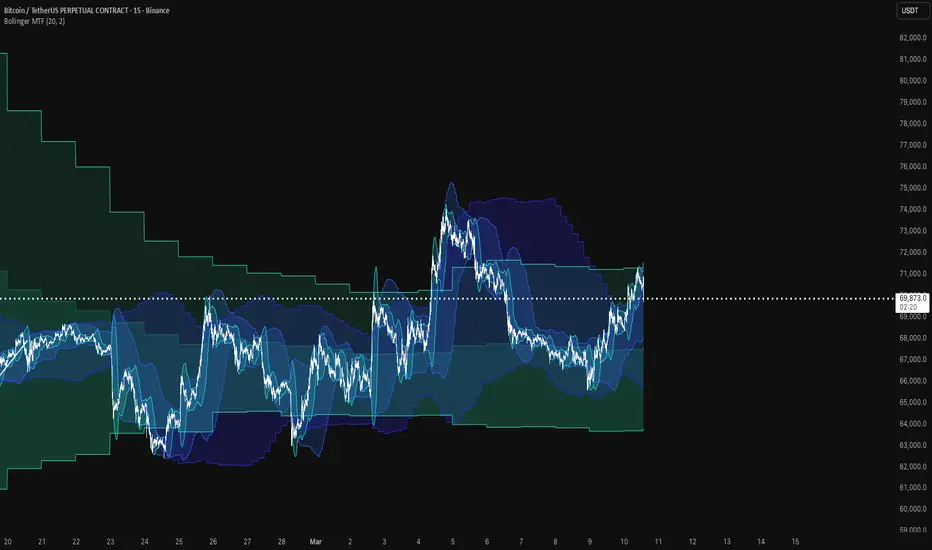
Bollinger MTFThe Bollinger MTF indicator is a versatile volatility and trend analysis tool that allows traders to overlay Bollinger Bands from multiple timeframes onto a single chart. This provides a comprehensive view of market structure, identifying key support and resistance levels across various durations—from intraday scalping ranges to long-term institutional cycles.
By centralizing multi-timeframe (MTF) Bollinger Bands, this indicator eliminates the need to switch tabs constantly, allowing for better alignment checks and regime identification.
█ WHAT MAKES THIS ORIGINAL
1. Comprehensive MTF Integration
Unlike standard Bollinger Band indicators that only show a single timeframe, this tool supports up to seven simultaneous overlays:
- Chart BB: Matches the current chart resolution.
- Intraday: 15-minute and 1-hour.
- Swing: 4-hour and Daily.
- Macro: Weekly and Monthly.
2. Dynamic High-Visibility Design
Each timeframe is assigned a distinct, curated color palette with adjustable fills. This allows for clear "nesting" of bands, making it easy to identify when price is compressed within multiple timeframe extremes or expanding into a broad trend.
3. Optimized Data Fetching
The script uses efficient security calls with `barmerge.gaps_off` to ensure that higher-timeframe data is correctly aligned with the current chart without creating visual distortion or repainting artifacts on historical bars.
█ USAGE
Volatility Compression (Squeeze)
Look for areas where multiple timeframe bands are tightening simultaneously. This indicates a period of low volatility often followed by an explosive move. If the 4h and Daily bands are both squeezing, the subsequent breakout is likely to be significant.
Trend Alignment
A strong trend is often confirmed when price remains positioned between the basis line and the upper/lower bands of multiple timeframes. For example, a "Power Trend" occurs when price respects the 1h BB Upper while staying above the 4h BB Basis.
Mean Reversion Levels
The outer bands of higher timeframes (Daily/Weekly) act as significant exhaustion points. When price reaches a Weekly Band extreme during an intraday move, the probability of a reversal or consolidation increase substantially.
█ DETAILS
Calculation Logic
The core engine utilizes the standard `ta.bb` function, calculating the Simple Moving Average (SMA) and Standard Deviation (StdDev) for each requested timeframe. The results are then synchronized to the current chart using `request.security`.
Display Logic
The script features advanced plotting controls where each timeframe's visibility, color, and center-line display can be toggled independently. This allows for a clean workspace where only the most relevant tiers are visible.
█ SETTINGS
General BB Settings
- Length: The lookback period for the SMA and StdDev calculation (Default: 20).
- StdDev: The multiplier for the bands (Default: 2.0).
Timeframe Toggles
Each timeframe section (Chart, 15m, 1h, 4h, 1d, 1w, 1M) includes:
- Toggle: Enable or disable the specific timeframe.
- Colors: Independent selection for lines and fills.
- Center Line: Optional toggle to show the basis (SMA) line.
█ DISCLAIMER
This indicator is for informational purposes only and does not constitute financial advice. Trading involves significant risk. Always use a holistic approach that includes risk management and additional technical or fundamental confirmation.
อินดิเคเตอร์

Advanced Volatility Squeeze Pro v2 [identityKa]Overview
The Advanced Volatility Squeeze Pro v2 is a comprehensive breakout and momentum oscillator. It is designed to identify periods of market consolidation (volatility compression) and mathematically anticipate the direction of the ensuing breakout. This script improves upon traditional squeeze models by replacing the often-lagging linear regression momentum with a highly responsive dual-EMA momentum engine.
Core Mathematical Concepts
This indicator relies on the mathematical relationship between two distinct volatility envelopes:
Bollinger Bands (Standard Deviation): Calculates the standard deviation of price around a Simple Moving Average (default length 20, multiplier 2.0). These bands expand and contract rapidly based on immediate price variance.
Keltner Channels (True Range): Calculates an envelope based on the Simple Moving Average of the True Range (default multiplier 1.5). These bands are less sensitive to sudden spikes and represent the baseline volatility.
The Squeeze Logic (Dots)
The script continuously compares the width of the Bollinger Bands to the Keltner Channels:
Squeeze ON (Red Dots): Triggered when the Bollinger Bands completely contract inside the Keltner Channels. This signifies a severe drop in volatility. The market is consolidating, building energy for a future move.
Squeeze OFF (Gray Dots): Triggered when the Bollinger Bands expand back outside the Keltner Channels. This mathematical event is known as the squeeze "firing," indicating a release of volatility and the start of a new directional trend.
The Momentum Engine (Histogram)
To determine the direction of the breakout, the script calculates the spread between a Fast EMA (default 8) and a Slow EMA (default 21).
The histogram plots this exact difference.
A rising positive histogram (Bright Green) indicates accelerating bullish momentum, while a falling negative histogram (Bright Red) indicates accelerating bearish momentum.
HUD Dashboard & AI Logic
The on-chart panel aggregates these calculations into an actionable state:
Dangerous: Displayed whenever the Squeeze is "ON". This warns traders that the market is range-bound and breakout direction is mathematically uncertain.
LONG: Triggered when the Squeeze fires (OFF), the momentum is positive (Fast EMA > Slow EMA), and the momentum value is actively rising compared to the previous bar.
SHORT: Triggered when the Squeeze fires (OFF), the momentum is negative, and actively falling.
How to Use It
Traders should avoid entering trend-continuation setups while the red dots (Squeeze ON) are present. The optimal setup occurs when a red dot transitions to a gray dot (Squeeze fires) in confluence with the AI Suggestion outputting a clear "LONG" or "SHORT" signal, allowing the trader to capture the explosive expansion in volatility. อินดิเคเตอร์

อินดิเคเตอร์

Adaptive ALMA 2.0This script is a indicator that builds upon the Arnaud Legoux Moving Average (ALMA). Unlike a standard ALMA, which uses fixed settings, this version is "Adaptive" and "Evasive."
Here is a breakdown of what the code is doing:
1. The Adaptive Engine (Efficiency Ratio)
The core logic uses an Efficiency Ratio (ER) to measure market noise versus trend strength:
High Volatility/Clear Trend: The ER is high. The script automatically shortens the length and reduces the offset to make the line react faster (minimizing lag).
Low Volatility/Consolidation: The ER is low. The script increases the length and sigma to make the line smoother, preventing "whipsaws" (fake signals).
2. Global Evasion Engine (Noise Filtering)
This is the most unique part of the script. It uses two ATRs (Fast and Slow) to create a "Noise Zone":
Auto-Tune Evasion: It calculates a visual_noise_th (threshold). If the price is wiggling inside this gray/aqua band, the trend state won't change easily.
Volatility-Based Sensitivity: In "noisy" markets, it requires a larger price move (determined by d_atr) to flip the trend from Bullish to Bearish.
PS1: ATR is calculated on the full range of candle prices - open + close
3. Trend Logic & Signals
Bullish (Green): When the ALMA is rising, the price is above it, and the move exceeds the noise threshold.
Bearish (Red): When the ALMA is falling, the price is below it, and the move exceeds the noise threshold.
Neutral (Gray): When the price is stuck within the "Noise Band."
4. Extra Layers
It includes Medium (50) and Long (200) ALMA lines to give you a broader context of the trend (e.g., only taking Buy signals when the Long ALMA is also green).
Source: It uses a custom price source (open + close + close) / 3 to give more weight to the closing price while maintaining some "breath" from the open.
PS2: the sample chart is for BTC with a 5-minute interval
PS3: Works on any interval - you only need to adjust the parameters, default values are for fast-moving and liquid assets (e.g. BTC intervals 1 minute - 1 day and higher) and suggested Japanese candles (including Heikin Ashi) อินดิเคเตอร์

Adaptive Bollinger Bands [by Oberlunar]Adaptive Bollinger Bands by Oberlunar extends a classical Bollinger-style framework by building structured envelopes on highs and lows and then interpreting them through flow and regime context rather than through band touches alone. The script combines two moving-average bases, adaptive volume-distribution logic above and below price, a normalized TRIX component, and a multi-timeframe directional filter to distinguish between mean-reversion conditions and breakout conditions in a more organized way.
Its original value is not in any single component taken in isolation, but in the way these elements are fused into one coherent visual system. The bands define the price structure, the heatmap and tape show where directional pressure is stronger, the regime engine helps separate quieter rejection environments from more persistent expansion, and the support, resistance, and compression areas help mark zones where market behavior becomes more interpretable.
The indicator is designed to be read directly on standard charts. It does not use future-looking logic, and higher-timeframe requests are made with no lookahead. It is meant as a decision-support tool for chart reading, not as a promise of performance or as a substitute for risk management.
A common way to use the script is to observe how price behaves when it reaches the outer parts of the envelope and then compare that location with the active regime, the side-specific flow, and the multi-timeframe bias. In quieter conditions, signals near the edge of the channel can be interpreted as possible rejection areas. In stronger directional conditions, the same area can instead be read as part of a continuation or breakout sequence. The heatmap and tape help show whether pressure is building above or below price, while the marked zones can help the user keep track of relevant local structure.
Enjoy
by Oberlunar ✦👁 อินดิเคเตอร์

Dual Bollinger Trend Oscillator - BBTrend | TR🎯 Overview
Dual Bollinger Trend Oscillator - BBTrend | TR is an innovative oscillator developed by Tiagorocha1989 that leverages two Bollinger Bands® with different periods and standard deviation multipliers to create a unique measure of trend strength and momentum. By comparing the relative positions of short‑term and long‑term bands, BBTrend captures the expansion or contraction of volatility in a way that highlights underlying trend dynamics. With dual display modes (histogram or line), a comprehensive moving average engine, and rich visual customization, this indicator helps traders identify trend direction, strength, and potential reversals with clarity.
🔧 How It Works
BBTrend is built upon two classic Bollinger Bands calculations applied to the same price source:
Short Bollinger Bands – length Short_Len_BB, multiplier Short_Mult_BB
Long Bollinger Bands – length Long_Len_BB, multiplier Long_Mult_BB
From these bands, the indicator computes the absolute differences between the lower bands (shortLo and longLo) and between the upper bands (shortUp and longUp). The core oscillator value is then:
text
BBTrend = (abs(shortLo - longLo) - abs(shortUp - longUp)) / shortMid * 100
where shortMid is the middle line of the short Bollinger Bands (used for normalisation). The result is a dimensionless oscillator that oscillates around zero:
BBTrend > 0 → The gap between lower bands exceeds the gap between upper bands, typically associated with bullish momentum.
BBTrend < 0 → The gap between upper bands exceeds the gap between lower bands, typically associated with bearish momentum.
The indicator can be displayed either as a histogram (default) or as a line. When shown as a histogram, four shades of the bullish/bearish colours indicate the strength of the trend based on whether the value is increasing or decreasing.
An optional moving average (MA_BB) of the BBTrend line can be added (enabled via showMA). Crossovers between BBTrend and this MA provide additional trading signals.
✨ Key Features
🔹 Dual Display Modes
Histogram Mode (default): Visualises BBTrend as coloured columns. The colour intensity reflects trend strength:
Dark shades → strong momentum (value increasing in the same direction)
Light shades → weakening momentum (value decreasing towards zero)
Line Mode: Plots BBTrend as a continuous line, coloured by its position relative to its moving average.
🔹 Customizable Bollinger Bands
Separate control over short and long Bollinger Bands:
Short BB Length (default 10) and Short StdDev (default 1.0)
Long BB Length (default 50) and Long StdDev (default 2.0)
Price Source (default Close)
🔹 Moving Average Engine
When enabled, the indicator plots a moving average of BBTrend with 12 selectable types:
EMA, SMA, RMA, WMA, VWMA, HMA, DEMA, TEMA, TRIMA, FRAMA, SWMA, T3
The T3 MA includes an adjustable T3 Factor for fine‑tuning smoothness.
🔹 Crossover Signals
Zero‑Line Crossovers: Triangles appear on the price chart when BBTrend crosses above or below zero (bullish/bearish signals).
MA Crossovers: When showMA is true, small circles mark crossovers between BBTrend and its moving average.
🔹 Comprehensive Visual Feedback
Color‑Coded Histogram/Line: Uses one of eight color themes (Classic, Modern, Robust, etc.) for bullish and bearish states.
Dynamic Zone Fills: Semi‑transparent fills between the BBTrend line and its moving average when line mode is active.
Background Shading: The chart background changes colour based on the prevailing bias (bullish/bearish).
Color‑Coded Candles: Bars reflect the current BBTrend bias (above/below zero in histogram mode, or above/below MA in line mode).
Live Value Display: Current BBTrend value shown in a floating label near the last bar.
Trend Table: Bullish/Bearish status displayed in a table on the chart.
🔹 Ready‑to‑Use Alerts
Built‑in alert conditions trigger LONG on bullish zero‑line crossovers and SHORT on bearish zero‑line crossovers, as well as for MA crossovers when enabled.
⚙️ Settings Summary
Setting Description Default
Color Choice Select from eight visual themes Classic
Show Histogram If true, display as histogram; if false, as a line true
Show Moving Average Display the moving average of BBTrend false
Price Source Source for Bollinger Bands calculations Close
Short BB Length Period for short Bollinger Bands 10
Long BB Length Period for long Bollinger Bands 50
Short StdDev Standard deviation multiplier for short bands 1.0
Long StdDev Standard deviation multiplier for long bands 2.0
Length MA Moving average period for BBTrend 14
Moving Average Type of moving average (12 options) EMA
T3 Factor Factor for T3 moving average (0–1) 0.7
📈 Practical Applications
🔹 Trend Direction Identification
The sign of BBTrend provides a clear directional bias:
Positive values → bullish trend
Negative values → bearish trend
The magnitude indicates trend strength, with larger absolute values reflecting stronger momentum.
🔹 Zero‑Line Crossovers
Crossovers above/below zero offer simple, intuitive signals:
Crossover above zero → bullish momentum strengthening, potential trend reversal up.
Crossunder below zero → bearish momentum strengthening, potential trend reversal down.
These are highlighted by triangle markers on the price chart.
🔹 Signal‑Line Crossovers (MA Mode)
When the moving average is enabled, crossovers between BBTrend and its MA provide filtered signals:
BBTrend crosses above its MA → bullish signal.
BBTrend crosses below its MA → bearish signal.
These signals help reduce whipsaws in choppy markets.
🔹 Trend Strength & Momentum
The histogram’s shading reveals momentum acceleration:
Darkening colours → increasing momentum in the current direction.
Lightening colours → momentum slowing, possible trend exhaustion or reversal.
🔹 Divergence Trading
Like many oscillators, BBTrend can form divergences with price:
Bullish Divergence: Price makes a lower low while BBTrend makes a higher low → potential upside reversal.
Bearish Divergence: Price makes a higher high while BBTrend makes a lower high → potential downside reversal.
Divergences are most significant when BBTrend is at extreme levels (far from zero).
🔹 Multiple Timeframe Analysis
Compare BBTrend readings across different timeframes: higher‑timeframe BBTrend defines the primary trend direction, while lower‑timeframe BBTrend can be used for entry timing.
🎯 Ideal For
✅ Bollinger Bands Enthusiasts looking for a novel way to compare short‑term and long‑term volatility.
✅ Trend Traders seeking a clear, visual representation of trend direction and strength.
✅ Momentum Traders wanting to measure acceleration and deceleration.
✅ Divergence Traders who rely on oscillator‑price divergences for reversals.
✅ Swing Traders capturing medium‑term trend shifts.
✅ System Developers needing a customisable, dual‑signal oscillator.
✅ Beginner Traders who appreciate straightforward signals and colour‑coded visuals.
📌 Key Takeaways
Dual Bollinger Concept: Combines short and long Bollinger Bands to create a unique momentum oscillator.
Dual Display Modes: Choose histogram (with strength shading) for quick visual assessment, or line mode with moving average for crossover‑based trading.
Normalised Scale: Values are normalised by the short middle band, making readings comparable across instruments and timeframes.
Extensive MA Options: 12 moving average types give complete control over signal smoothing.
Rich Visuals: Colour themes, intensity‑shaded histogram, candle colouring, and background fills provide immediate market context.
Divergence Capability: The oscillator’s unbounded nature makes it suitable for spotting regular and hidden divergences.
Alert‑Ready: Pre‑built alerts for both zero‑line and MA crossovers.
⚠️ Important Notes
BBTrend is an unbounded oscillator; its scale can vary depending on market volatility and the chosen Bollinger Bands parameters. The zero line remains the fixed reference.
The default parameters (short: 10/1.0, long: 50/2.0) are a starting point. Adjust them to match your trading style and instrument characteristics.
When using the moving average, the default length of 14 offers a balanced response; longer lengths smooth the line but increase lag.
Divergences should be confirmed with other technical tools and are most reliable after extended trends.
Always combine BBTrend with proper risk management and additional confirmation before live deployment.
Disclaimer: This indicator is provided for educational and informational purposes only. Past performance does not guarantee future results. Always test thoroughly and align with your personal risk management strategy. อินดิเคเตอร์

อินดิเคเตอร์
อินดิเคเตอร์

อินดิเคเตอร์

อินดิเคเตอร์

Liquidity Bands1. CONCEPT & PURPOSE
Liquidity Bands is a volume-weighted volatility envelope indicator. Unlike standard Bollinger Bands that use a Simple Moving Average and equal-weighted standard deviation, this indicator weights every price observation by its liquidity (volume × true range). This means:
High-volume, high-volatility bars have a stronger influence on the bands
Low-volume, quiet bars contribute less to the calculation
The bands naturally gravitate toward price levels where real trading activity occurred
This makes the bands more responsive to institutional activity and genuine supply/demand zones rather than treating every bar equally.
2. CORE CALCULATIONS
2.1 Liquidity Proxy
text
liquidity = volume × true_range
Each bar's "weight" is determined by multiplying its volume by its true range. This captures dollar-flow intensity — a bar with high volume AND wide range represents significant market participation. If volume is unavailable (e.g., some crypto pairs), it defaults to 1 so the indicator still functions.
2.2 Liquidity-Weighted Moving Average (LMA)
text
LMA = Σ(price × liquidity, n) / Σ(liquidity, n)
Instead of a simple average where each bar counts equally, the LMA is a weighted mean where high-liquidity bars pull the average toward their price level more strongly. This is the center line (basis) of the bands.
Interpretation:
LMA represents the fair value based on where the most trading activity occurred
Price above LMA → bullish bias
Price below LMA → bearish bias
2.3 Liquidity-Weighted Standard Deviation
text
variance = Σ(price² × liquidity, n) / Σ(liquidity, n) − LMA²
std_dev = √variance
The standard deviation is also liquidity-weighted, meaning volatility is measured relative to where liquidity actually participated, not just raw price swings.
2.4 Band Construction
Band Formula Purpose
Upper Band LMA + (mult × std_dev) Overbought / resistance zone
Lower Band LMA − (mult × std_dev) Oversold / support zone
Inner Upper LMA + (inner_mult × std_dev) First standard deviation — early warning
Inner Lower LMA − (inner_mult × std_dev) First standard deviation — early warning
Default multipliers: Outer = 2.0, Inner = 1.0
This creates four zones:
Above upper band → extreme overbought
Upper band to inner upper → overbought zone
Inner upper to inner lower → neutral / fair value zone
Inner lower to lower band → oversold zone
Below lower band → extreme oversold
3. SIGNAL MODES
3.1 Mean Reversion Mode
Philosophy: Price tends to return to the mean after touching extremes.
Signal Condition Logic
LONG Previous close was at or below the lower band, current close is back above it Price was rejected at the lower extreme and is recovering — buy the bounce
SHORT Previous close was at or above the upper band, current close is back below it Price was rejected at the upper extreme and is fading — sell the rejection
Best used in: Ranging/sideways markets, mean-reverting instruments, when squeeze is active.
3.2 Breakout Mode
Philosophy: When price breaks through the bands with conviction, momentum follows.
Signal Condition Logic
LONG Price crosses above the upper band Bullish momentum breakout — buy the strength
SHORT Price crosses below the lower band Bearish momentum breakdown — sell the weakness
Best used in: Trending markets, after a squeeze, high-momentum instruments.
3.3 Both Mode
Fires signals from either mode. Useful for scanning all opportunities but requires additional context/filtering to avoid conflicting signals.
3.4 LMA Cross Signals (Optional)
Signal Condition
Cross Up Price crosses above the LMA basis line
Cross Down Price crosses below the LMA basis line
These are secondary/confirmation signals — a diamond shape appears. Useful for:
Confirming a mean reversion signal (price bounced off band AND crossed back above LMA)
Identifying trend direction shifts
4. BAND WIDTH & SQUEEZE DETECTION
4.1 Band Width
text
band_width = (upper_band − lower_band) / LMA × 100
Expressed as a percentage of the LMA, this normalizes volatility across different price levels and instruments. A 5% band width means the bands span 5% of the current price level.
4.2 Squeeze Detection
text
squeeze = band_width < lowest(band_width, 50) × 1.05
A squeeze is detected when the current band width is within 5% of the lowest band width in the last 50 bars. This means volatility has contracted to near-historic lows for the recent window.
What it means:
Energy is building — a large move is likely coming
Direction is unknown — wait for breakout confirmation
Displayed as a soft orange/yellow background tint across the chart
4.3 Expansion Detection
text
expansion = band_width > highest(band_width , 20) × 0.95
Bands are expanding when width is near the 20-bar high. This confirms an active trend/momentum move is underway.
4.4 Price Position Ratio
text
ratio = (close − lower_band) / (upper_band − lower_band)
Gives a 0–100% reading of where price sits within the bands:
0% = at the lower band
50% = at the LMA
100% = at the upper band
>100% = above upper band
<0% = below lower band
Displayed as a visual gauge bar ████░░░░░░ 40% in the dashboard.
5. VISUAL SYSTEM
5.1 Color Themes
Theme Character Upper Lower Best For
Cyber Futuristic neon Cyan #00e5ff Pink #ff006e Dark charts
Ocean Cool aquatic Teal #00b4d8 Deep blue #0077b6 Clean look
Lava Hot aggressive Orange #ff6b35 Red #d90429 High energy
Frost Soft pastel Light blue #a2d2ff Pale blue #bde0fe Light charts
Neon Maximum contrast Green #39ff14 Red #ff073a Visibility
Each theme defines a coordinated 7-color palette (upper, lower, basis, bull, bear, squeeze, accent) so everything matches.
5.2 Glow Effect
Three concentric layers are drawn behind each band line:
Layer Opacity Width Effect
Outer glow 92% transparent 6px Soft ambient halo
Mid glow 82% transparent 4px Intermediate diffusion
Inner glow 60% transparent 2px Concentrated glow
Core line 0% transparent 1px Sharp band edge
This creates a neon light tube effect around each band.
5.3 Zone Fills
Five separate fill regions create depth:
Zone Between Opacity Meaning
Upper zone Upper band → Inner upper 88% Overbought territory
Lower zone Lower band → Inner lower 88% Oversold territory
Core zone Inner upper → Inner lower 95% Fair value area
Upper half Upper band → LMA 94% Subtle upper bias tint
Lower half Lower band → LMA 94% Subtle lower bias tint
5.4 Dynamic Basis Color
The LMA line color shifts in real-time based on price position:
When price is near the lower band → basis turns lower band color
When price is near the upper band → basis turns upper band color
This creates an instant visual read of where price sits
5.5 Signal Visualization (Triple-Layer)
Each signal has three visual layers for maximum clarity:
Layer Element Purpose
Primary Large ▲/▼ triangle with bold "LONG"/"SHORT" text Unmissable directional signal
Accent Small circle dot at the same location Adds visual weight and layering
Context Dotted horizontal line spanning ±1 bar Marks the exact price level of the signal
Background Full-bar bgcolor tint (green/red) Makes signal bars visible even when zoomed out
5.6 Band Touch Markers
Small xcross shapes appear when price first touches a band without triggering a full signal. These serve as early warnings that price is testing an extreme.
5.7 LMA Dot Trail (Optional)
When enabled, alternating dots • appear on the LMA line every other bar, creating a stylized beaded line effect instead of a solid line.
6. DASHBOARD
A real-time information panel displayed in the corner with alternating dark row backgrounds:
Row Left Column Right Column Color Logic
Header ⚡ LIQUIDITY BANDS ━━━━━━ Theme accent
Theme Theme Active theme name + ● Upper band color
Mode Mode Active signal mode Accent color
Width Width Band width as % Orange if squeeze, green if expanding, gray if normal
Status Status ⊘ SQUEEZE / ⊕ EXPANDING / ◎ NORMAL Contextual color
Price Price ▲ ABOVE / ▼ BELOW / ◈ INSIDE Green/red/white
Ratio Ratio ████░░░░░░ 40% gauge bar Gradient from lower to upper band color
7. ALERTS
Alert Fires When
Long Signal Any long condition triggers (based on selected mode)
Short Signal Any short condition triggers (based on selected mode)
LMA Cross Up Price crosses above the LMA
LMA Cross Down Price crosses below the LMA
Squeeze Band width hits squeeze threshold
All alert messages include the ticker symbol via {{ticker}}.
8. INPUT REFERENCE
Input Default Range Description
Lookback Length 20 1+ Number of bars for LMA and std dev calculation
StdDev Multiplier 2.0 0.1+ Width of outer bands (higher = wider)
Price Source Close Any Which price to use for calculations
Inner Band Multiplier 1.0 0.1+ Width of inner bands
Signal Mode Mean Reversion 3 options Which signal logic to use
Show Signals ✓ Toggle Display signal markers
Show LMA Cross ✗ Toggle Display LMA cross diamonds
Color Theme Cyber 5 options Visual color scheme
Band Glow Effect อินดิเคเตอร์

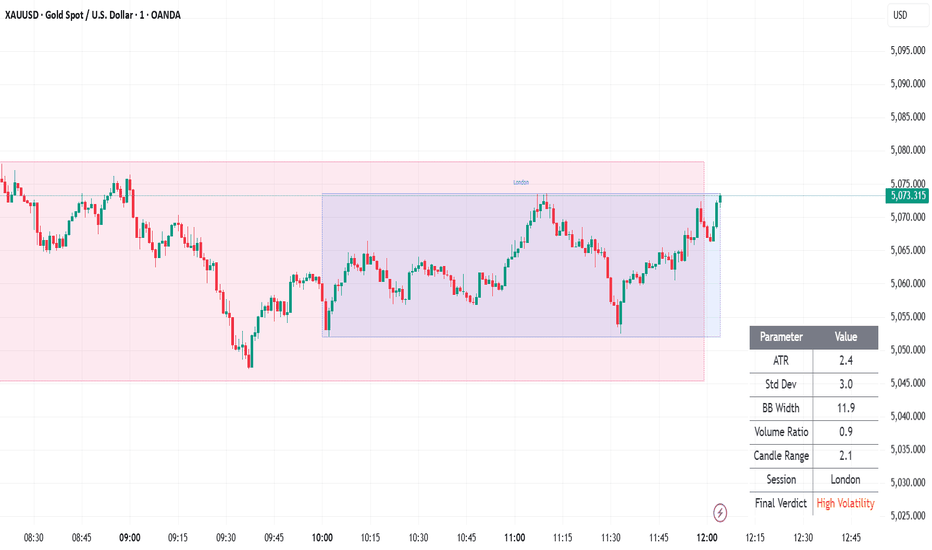
Volatility Regime DashboardVolatility Regime Dashboard
Real-Time Multi-Factor Volatility Analyzer for Crypto, Forex & Stocks
This indicator provides a structured, real-time volatility assessment using multiple market dynamics combined into a single regime-based verdict.
It is designed for traders in crypto, forex, and stocks who want a quick, objective read on whether the market is quiet, tradable, expanding, or explosive.
Instead of relying on one indicator alone, this dashboard evaluates volatility through range, deviation, volume expansion, session timing, and momentum-based expansion metrics, then produces a final regime classification:
Low | Normal | High | Extreme Volatility
📋 Table Parameters Explained
The table displays two columns:
Parameter | Value
Below is what each parameter means and how to interpret it:
1️⃣ ATR (Average True Range)
Measures how much price is moving per candle.
Higher ATR = wider price swings.
Rising ATR suggests expanding volatility.
Falling ATR suggests compression or range-bound conditions.
Use: Good for determining stop distance and scalping viability.
2️⃣ Standard Deviation
Measures how far price deviates from its average.
Expanding deviation indicates increasing momentum and instability.
Contracting deviation signals consolidation.
Use: Helps detect buildup before breakouts.
3️⃣ Bollinger Band Width
Represents volatility expansion or contraction.
Bands widening = volatility increasing.
Bands squeezing = compression phase.
Use: Ideal for breakout preparation across crypto, forex, and stock markets.
4️⃣ Volume Ratio
Current volume relative to its moving average.
Above 1.0 = above-normal activity.
Rising volume confirms genuine volatility expansion.
Use: Filters fake breakouts and low-liquidity moves.
5️⃣ Candle Range
Measures the high-low spread of the current candle.
Larger candles imply active participation.
Smaller candles indicate lack of conviction.
Use: Immediate micro-volatility reading.
6️⃣ Session (Tokyo / London / NY)
Markets behave differently across sessions:
Tokyo → Generally slower, range-based conditions.
London → Increasing momentum and liquidity.
New York (NY) → Often strongest volatility and directional moves.
Session weighting helps contextualize volatility behavior in forex, crypto, and global equities.
🔥 Final Verdict – How to Use It
The dashboard combines all metrics into a structured score and classifies the market into:
🟢 Low Volatility
Compressed movement
Range-bound conditions
Better suited for mean reversion strategies
🟡 Normal Volatility
Healthy, tradeable movement
Suitable for structured intraday trading
🟠 High Volatility
Strong expansion
Breakout or trend-following strategies favored
🔴 Extreme Volatility
Explosive movement
News-driven or institutional momentum
Suitable for experienced traders only
🎯 Why This Indicator Is Useful
Instead of guessing whether the market is active or dead, this tool provides:
Structured multi-factor confirmation
Visual clarity via regime classification
Adaptability for crypto, forex, and stocks
Volatility-based trade filtering
It is ideal for:
Intraday traders
Scalpers
Breakout traders
Session-based traders
Algorithmic/system traders
🚀 Practical Usage Ideas
Trade only when verdict = High or Extreme
Reduce size when verdict = Normal
Avoid new positions during Low
Combine with trend or structure-based strategies
This indicator does not predict direction.
It helps you understand when conditions are favorable for movement.
Because in all markets — crypto, forex, or stocks —
timing volatility is as important as timing direction. อินดิเคเตอร์
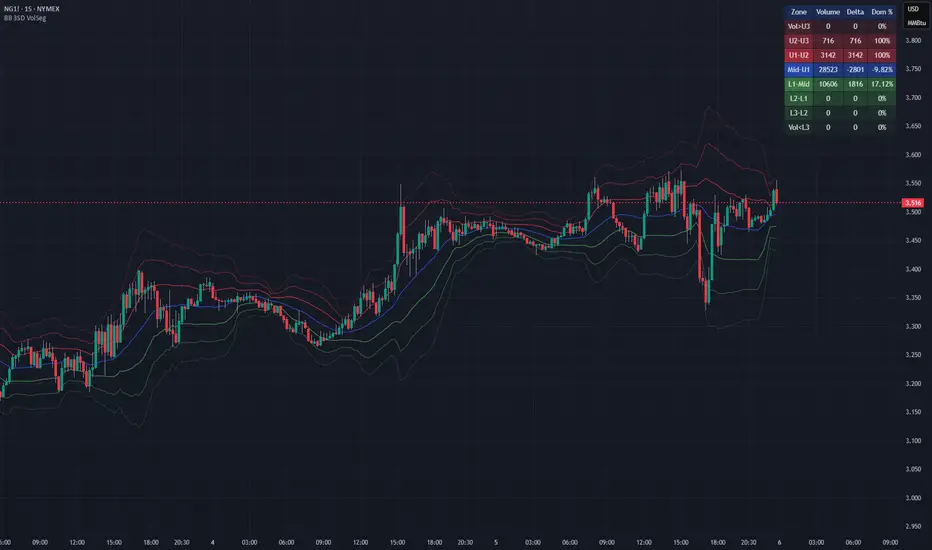
BB 3SD Volume Segmentation CurvesThis is a companion script to It's purpose is to enhance visualisation of volume and volume differential for those areas where price is most likely to react from and to showcase the differences in a succinct graphical way for quick comparisons.
Purpose
This script maps buy/sell volume, delta, and dominance into Bollinger Band zones to reveal where aggressive participation occurs relative to volatility structure. Instead of looking at raw volume or delta in isolation, it distributes flow across eight volatility buckets (from >3SD to <–3SD), allowing you to see whether buyers or sellers are dominating at extremes, mid‑zones, or mean‑reversion areas. The goal is to create a normalized, volatility‑aware flow curve that highlights exhaustion, absorption, and imbalance far more clearly than standard volume indicators.
How it works
The script builds a multi‑SD Bollinger framework (1, 2, 3 standard deviations) and reconstructs buy/sell volume to compute delta. For every bar, it assigns volume and delta to the BB zone where price closed, then sums these values over the chosen lookback window. Each zone is normalized by total volume, producing comparable curves regardless of volatility or timeframe. Depending on the selected mode (Dominance %, Delta, or Volume), the script plots eight zone‑curves plus an optional total curve, giving a full distribution of flow across volatility extremes.
Rationale
Volume and delta behave very differently depending on where price sits relative to volatility structure. Heavy selling below –2SD means something completely different from heavy selling at the mean, and dominance at +3SD often signals exhaustion rather than continuation. By decomposing flow into volatility buckets, the script exposes where real aggression is happening and whether it aligns with trend, absorption, or reversal conditions. This transforms volume/delta from a blunt tool into a structured, regime‑aware signal that integrates cleanly with multi‑TF mean‑reversion or breakout systems.
อินดิเคเตอร์
Dual Bollinger BandsDual Bollinger Bands
Dual Bollinger Bands is an advanced volatility-based indicator that plots two independent Bollinger Band sets on the same chart, allowing traders to analyze price behavior from multiple perspectives simultaneously.
Unlike standard Bollinger Bands, this indicator lets you configure each band set separately, making it especially useful for identifying asymmetric volatility, price compression/expansion zones, and dynamic support and resistance levels.
Key Features
Two fully independent Bollinger Bands
Each band has its own length, standard deviation multiplier, and moving average type.
Different price sources
BB1 can be calculated using High prices, while BB2 can use Low prices (or any source you choose), enabling a directional volatility envelope.
Custom Moving Average types
Choose between SMA, EMA, SMMA (RMA), WMA, or VWMA for each Bollinger basis.
Offset capability
Optional forward/backward offset allows visual projection or historical alignment analysis.
Clear visual separation
Each Bollinger set uses distinct colors and shaded areas for easy interpretation.
Overlay on price chart
Designed to work directly on the main chart for contextual market analysis.
How to Use
Volatility Analysis
Observe expansions and contractions between the two Bollinger sets to identify volatility regimes.
Dynamic Support & Resistance
Upper and lower bands can act as adaptive levels where price may react or revert.
Trend Context
When price consistently respects one side of a band set, it may indicate directional strength.
Mean Reversion & Breakout Zones
Convergence between bands may suggest compression, while rapid divergence can signal breakout conditions.
Best Use Cases
Intraday and swing trading
Volatility-based strategies
Trend-following or mean-reversion systems
Crypto, Forex, Indices, and Equities
Notes
This indicator does not generate signals by itself. It is designed to be used as a contextual volatility and structure tool, ideally combined with price action, market structure, or higher-level trading frameworks. อินดิเคเตอร์

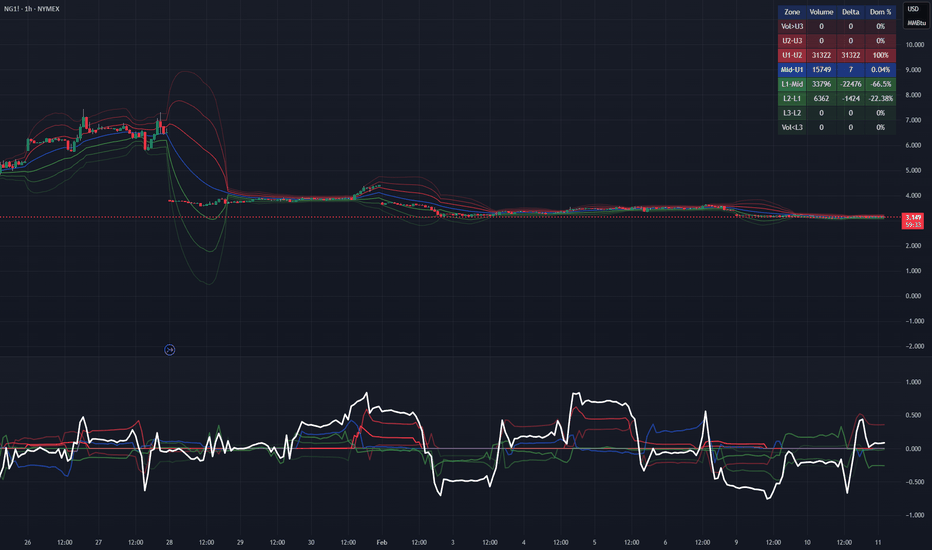
Bollinger Bands with 3SD Volume SegmentationPurpose
This script provides a structured way to analyze how real traded volume distributes across the different volatility zones defined by Bollinger Bands with three standard deviations, it reveals where activity concentrates, how pressure shifts between buyers and sellers, and how market participation behaves as price moves through expanding or contracting volatility regimes. The tool turns the bands into a mechanical segmentation system that exposes the microstructure hidden inside each volatility layer.
How it works
The script calculates Bollinger Bands at one, two, and three standard deviations, then assigns every bar’s volume to the correct volatility zone based on where price closed, it reconstructs buy and sell volume from candle behavior, computes delta as the difference between them, and aggregates these values over the chosen lookback window. Each zone displays total volume, delta, and a dominance percentage that expresses how strongly buyers or sellers controlled that region, all updated dynamically on the most recent bar. For example, if the Mid–U1 zone shows 28,450 contracts with a –2,728 delta and –9.59% dominance, that indicates mild seller control in a normally balanced rotation area, while the L1–Mid zone showing 10,606 contracts, +1,816 delta, and 17.12% dominance signals buyers absorbing pressure and defending the pullback.
Rationale
Volatility zones behave like natural boundaries where liquidity concentrates, where traders commit, hesitate, or get trapped, and where expansions or reversals often originate, so segmenting volume and delta by these zones provides a clearer picture of intent and pressure than raw volume alone. By quantifying how much buying or selling occurred in each volatility layer, the script helps identify continuation, absorption, exhaustion, and imbalance, giving traders a mechanical, objective map of market behavior rather than relying on subjective interpretation.
อินดิเคเตอร์

อินดิเคเตอร์