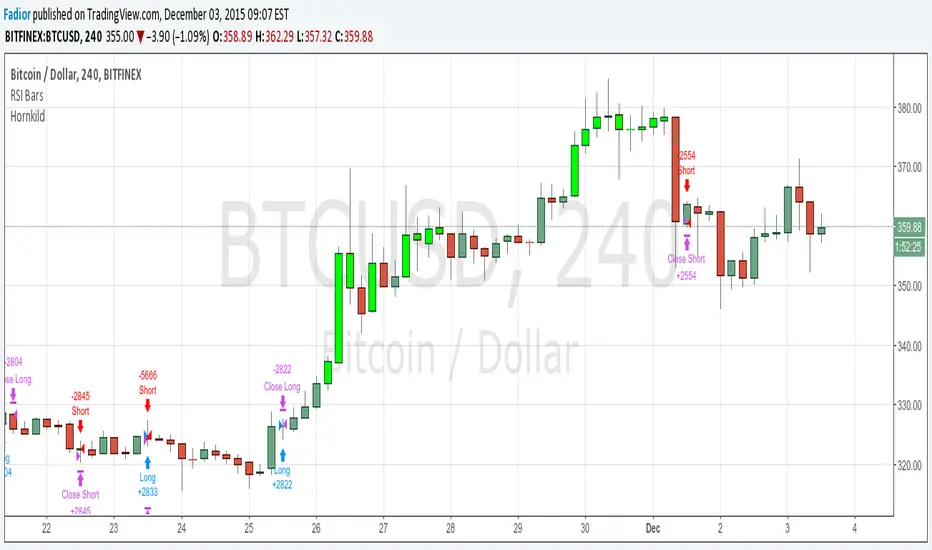
Strategy CCT Bollinger Band OscillatorThis strategy buy when ema crossover CCT BB oscillator and sell when crossunder. No SL neither TP only trailling stop at 1$. CCT BB oscillator is LaztBear indicator. Thanks to him.กลยุทธ์โดย Fadior1313247
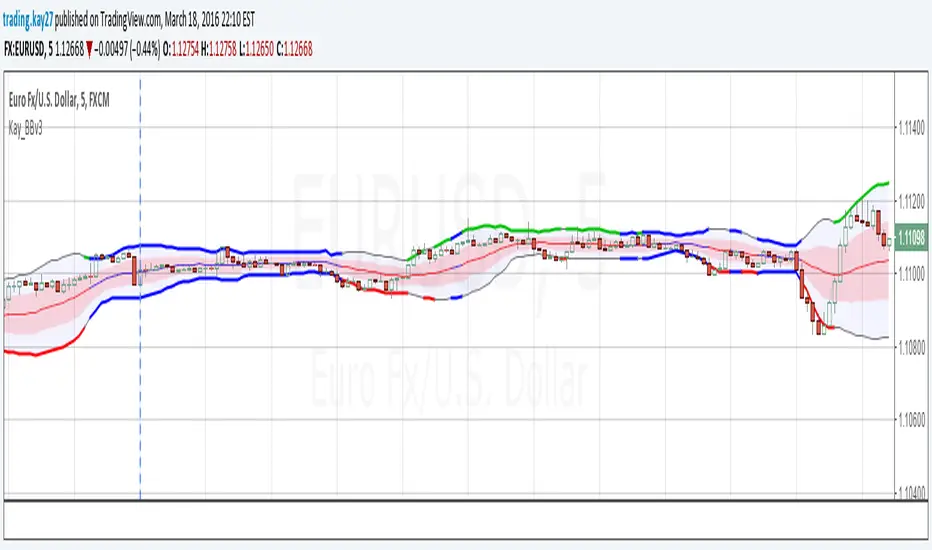
Moving averages and bandsI coded this simple indicator based on multiple ideas shared by Tim West at his "Key Hidden Levels" chatroom. We have a moving average ribbon comprised of the average of the highs and lows in 10 periods. The colored space in between acts more or less like fair value and is often where price is when consolidating. Green and red triangles at the top and bottom of the screen. The ones at the bottom, correspond to signals obtained from a 4 period moving average of the close's slope. It helps get excellent exits for trending moves by changing color with the moving average slope. The ones at the top, are green while Bollinger Band Width increases, and red while it decreases, relative to the previous bar. Background color highlights when the close moves over the moving average of the highs or under the moving average of the lows, indicating a change of trend is possible, or at least a pause/consolidation. The idea is to have multiple reasons to stay in a trade, which is normally very hard to do, specially when winning. Cheers, Ivan Labrie Time at Mode FXอินดิเคเตอร์โดย IvanLabrie44361
Capns Bollinger Bands MTF This Simple Script display higher time frame Bollinger Band on current resolution . Etc : On 1 Minutes chart BB Band is 5 Minutes Band. I use this code on my pc for scalping...Hope You like the ideaอินดิเคเตอร์โดย CapnOscar33356
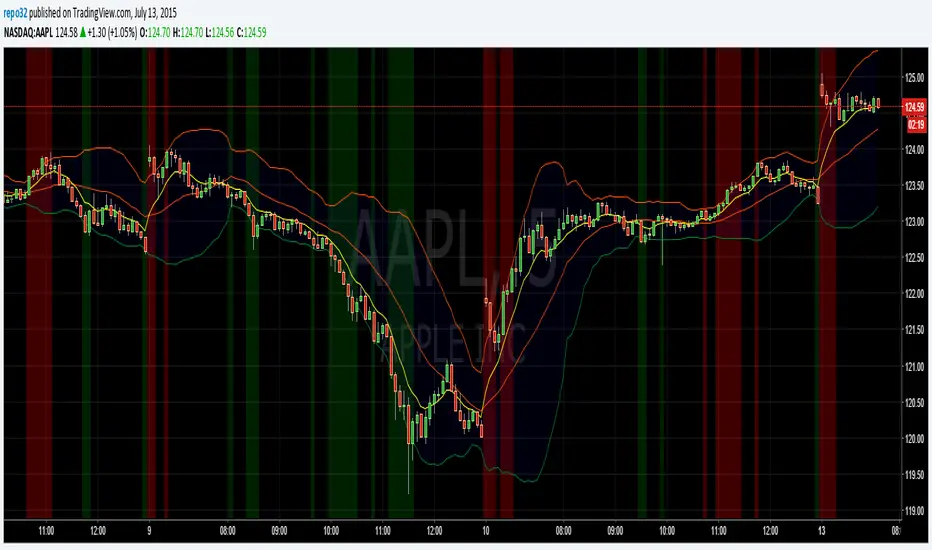
Bollinger Band TouchThis script simply colors the background when price hits or exceeds the bollinger bands. Just a nice visual cue.อินดิเคเตอร์โดย repo321010 1.1 K
Vdub_BinaryBands_v1Combined 3 x Bollinger Bands With BUY & SELL zones EMA, Wma SMA Multiplier adjustment อินดิเคเตอร์โดย vdubus514
[RS]Multiple Bollinger Bands Candles V0EXPERIMENTAL: using multiple length bollinger bands to create a better reading of ?price/range? strength?. • calculates 2 candle plots for upper and lower bands, were the high and low are the extremes of the bands, open is the previous close of the band and close is the extreme midline.อินดิเคเตอร์โดย RicardoSantosที่อัปเดต: 22391
3BBands (3 Spirolinas)The script combines 3 single Bollinger bands into one script for easy plotting and range modification. It can be used for analyzing a market with multiple time frames and ranges using Fibonacci series as the range.อินดิเคเตอร์โดย Ether11194
Madrid Bollinger Bands WidthThe contractions and expansions of the bands are represented by two different colorsอินดิเคเตอร์โดย Madridที่อัปเดต: 11290
Madrid Bollinger Bands %DBB %B : Madrid : 06/JUN/2014 23:36 : 2.0 This displays the distance from the lower band in terms of percentage. The farther it is from the basis line, the stronger the trend. When the price exceeds 100% or it's below 0% it means the price has reached an overbought (above 100) or oversold (below 0) level. อินดิเคเตอร์โดย Madrid33366
Madrid Bollinger Bands SDThis study tracks where the 5MA is relative to the Bollinger Bands Bollinger Bands are segmented in four parts, +/- 2 stdDev and +/- 1 stdDev +/- 1 : first StdDev Band +/- 4 : Second StdDev Band +/- 9 : Overbought / Oversold (Beyond 2nd SD Band) This study is used to reduce the clutter on the screen. Instead of displaying the whole band, it displays a map that shows on which band the price is located. And provides at a glance the strength of the trend. อินดิเคเตอร์โดย Madridที่อัปเดต: 241
Madrid Bollinger Bands BackgroundThis displays a background color according to the position of the closing price on the Standard Deviation band Blue for upper bands, Orange for lower bands Bold color for oversold/overbought conditions This study can be used as a standalone bar or it can be merged with other indicators or used as a chart background. The parameters it requires are simple, the length of the study, the multiplier and the kind of input, by default the closing price.อินดิเคเตอร์โดย Madridที่อัปเดต: 162
Bollinger BandsThis displays the traditional Bollinger Bands, the difference is that the 1st and 2nd StdDev are outlined with two colors and two different levels, one for each Standard Deviation. The basis line is colored depending on the direction of the moving average.อินดิเคเตอร์โดย Madridที่อัปเดต: 55 3.4 K
Exponential Bollinger BandsThese Bollinger Bands are exponential because the variance is calculated using the exponential moving average, rather than just adding the normal standard deviation to the ema. This may be more useful because the exponential standard deviation should be more sensitive to near term increases or decreases in volatility. Please do not forget that Bollinger Bands should always be combined with another method of analysis. Bollinger Bands just provide an easy way to gauge where the price could range in. At 2 standard deviations of a continuously random variable, more than 98% of data points are in this range. I am however going to test this in excel to get the average number of data points that stay in the range for Bitcoin. I will upload my findings when I complete that. Please monitor this description if your interested.อินดิเคเตอร์โดย Rashad99 1.7 K
RSI-BandsA Simple Indicator to see RSI - HH or LL with Bands - Divergence more visible อินดิเคเตอร์โดย CapnOscar195
CapnsBandsV2Here is the 2nd version of CapnsBandsV2 for Mateys... Remind you this a trend indicator NOT a BUY and SELL. Its up to you how you read it. Defaults for Smaller TF like 15Mnts. Enjoy it. :)อินดิเคเตอร์โดย CapnOscar22301
CapnsBandsIs It Uptrend or DownTrend? Are you lost? Follow the trend with CapnBands :) อินดิเคเตอร์โดย CapnOscar44957