อินดิเคเตอร์

อินดิเคเตอร์

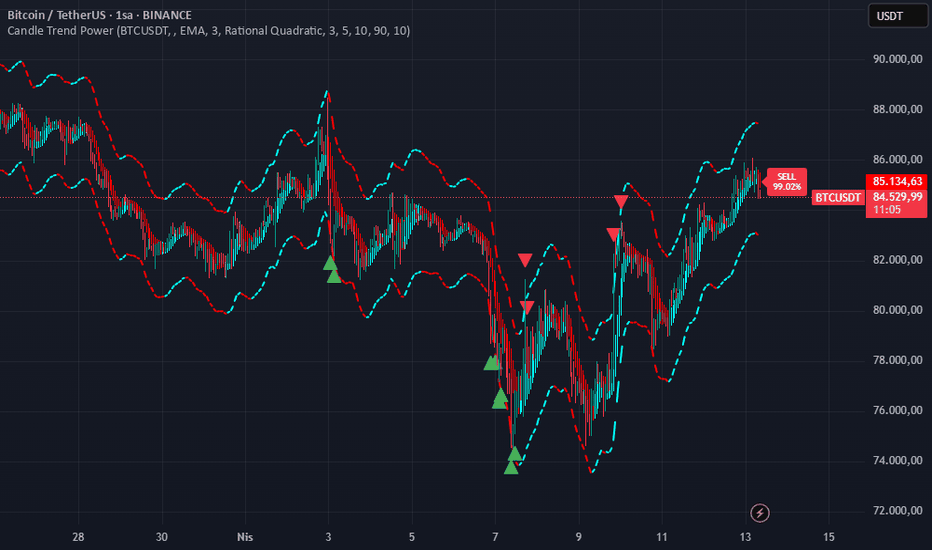
Candle Trend PowerThe Candle Trend Power is a custom technical indicator designed for advanced trend analysis and entry signal generation. It combines multiple smoothing methods, candle transformations, and volatility bands to visually and analytically enhance your trading decisions.
🔧 Main Features:
📉 Custom Candle Types
It transforms standard OHLC candles into one of several advanced types:
Normal Candles, Heikin-Ashi, Linear Regression, Rational Quadratic (via kernel filtering), McGinley Dynamic Candles
These transformations help traders better see trend continuations and reversals by smoothing out market noise.
🧮 Smoothing Method for Candle Data
Each OHLC value can be optionally smoothed using:
EMA, SMA, SMMA (RMA), WMA, VWMA, HMA, Mode (Statistical mode) Or no smoothing at all.
This flexibility is useful for customizing to different market conditions.
📊 Volatility Bands
Volatility-based upper and lower bands are calculated using:
Band = price ± (price% + ATR * multiplier)
They help identify overbought/oversold zones and potential reversal points.
📍 Candle Color Logic
Each candle is colored:
Cyan (#00ffff) if it's bullish and stronger than the previous candle
Red (#fd0000) if it's bearish and weaker
Alternating bar index coloring improves visual clarity.
📈 Trend Momentum Labels
The script includes a trend strength estimation using a smoothed RSI:
If the candle is bullish, it shows a BUY label with the overbought offset.
If bearish, it shows a SELL label with the oversold offset.
These labels are dynamic and placed next to the bar.
📍 Signal Markers
It also plots triangles when the price crosses the volatility bands:
Triangle up for potential long
Triangle down for potential short
✅ Use Case Summary
This script is mainly used for:
Visual trend confirmation with enhanced candles
Volatility-based entry signals
RSI-based trend momentum suggestions
Integrating different smoothing & transformation methods to fine-tune your strategy
It’s a flexible tool for both manual traders and automated system developers who want clear, adaptive signals across different market conditions.
💡 What's Different
🔄 Candle Type Transformations
⚙️ Custom Candle Smoothing
📉 Candle's Multi-level Volatility Bands
🔺 Dynamic Entry Signals (Buy/Sell Labels)
❗Important Note:
This script is provided for educational purposes and does not constitute financial advice. Traders and investors should conduct their research and analysis before making any trading decisions.
อินดิเคเตอร์
FVG, Swing, Target, D/W/M High Low Detector Basic by Trader Riaz"FVG, Swing, Target, D/W/M High Low Detector Basic by Trader Riaz " is a powerful TradingView indicator designed to enhance your trading strategy by identifying key market structures and levels. This all-in-one tool detects Fair Value Gaps (FVGs), Swing Highs/Lows, and previous Day, Previous Week, and Previous Month Highs/Lows, helping traders make informed decisions with ease.
Key Features:
Bullish & Bearish FVG Detection: Highlights Fair Value Gaps with customizable colors, labels, and extension options.
Swing Highs & Lows: Automatically detects and marks Swing Highs and Lows with adjustable display settings and extensions.
Next Target Levels: Identifies potential price targets based on market direction (rising or falling).
Daily, Weekly, and Monthly High/Low Levels: Displays previous day, week, and month highs/lows with customizable colors.
Customizable Settings: Fully adjustable inputs for colors, number of levels to display, and extension periods.
Clean Visuals: Intuitive and non-intrusive design with dashed lines, labels, and tooltips for better chart readability.
This indicator is ideal for traders looking to identify key price levels, improve market structure analysis, and enhance their trading strategies.
Happy Trading,
Trader Riaz อินดิเคเตอร์

อินดิเคเตอร์

อินดิเคเตอร์

อินดิเคเตอร์

อินดิเคเตอร์
Clean OHLC Lines | BaksPlots clean, non-repainting OHLC lines from higher timeframes onto your chart. Ideal for tracking key price levels (open, high, low, close) with precision and minimal clutter.
Core Functionality
Clean OHLC Lines = Historical Levels + Non-Repainting Logic
• Uses lookahead=on to anchor historical lines, ensuring no repainting.
• Displays OHLC lines for customizable timeframes (15min to Monthly).
• Optional candlestick boxes for visual context.
Key Features
• Multi-Timeframe OHLC:
Plot lines from 15min, 30min, 1H, 4H, Daily, Weekly, or Monthly timeframes.
• Non-Repainting Logic:
Historical lines remain static and never recalculate.
• Customizable Styles:
Adjust colors, line widths (1px-4px), and transparency for high/low/open/close lines.
• Candle Display:
Toggle candlestick boxes with bull/bear colors and adjustable borders.
• Past Lines Limit:
Control how many historical lines are displayed (1-500 bars).
User Inputs
• Timeframe:
Select the OHLC timeframe (e.g., "D" for daily).
• # Past Lines:
Limit historical lines to avoid overcrowding (default: 10).
• H/L Mode:
Draw high/low lines from the current or previous period.
• O/C Mode:
Anchor open/close lines to today’s open or yesterday’s close.
• Line Styles:
Customize colors, transparency, and styles (solid/dotted/dashed).
• Candle Display:
Toggle boxes/wicks and adjust bull/bear colors.
Important Notes
⚠️ Alignment:
• Monthly/weekly timeframes use fixed approximations (30d/7d).
• For accuracy, ensure your chart’s timeframe ≤ the selected OHLC timeframe (e.g., use 1H chart for daily lines).
⚠️ Performance:
• Reduce # Past Lines on low-end devices for smoother performance.
Risk Disclaimer
Trading involves risk. OHLC lines reflect historical price levels and do not predict future behavior. Use with other tools and risk management.
Open-Source Notice
This script is open-source under the Mozilla Public License 2.0. Modify or improve it freely, but republishing must follow TradingView’s House Rules.
📈 Happy trading! อินดิเคเตอร์

อินดิเคเตอร์

อินดิเคเตอร์

อินดิเคเตอร์

อินดิเคเตอร์

อินดิเคเตอร์

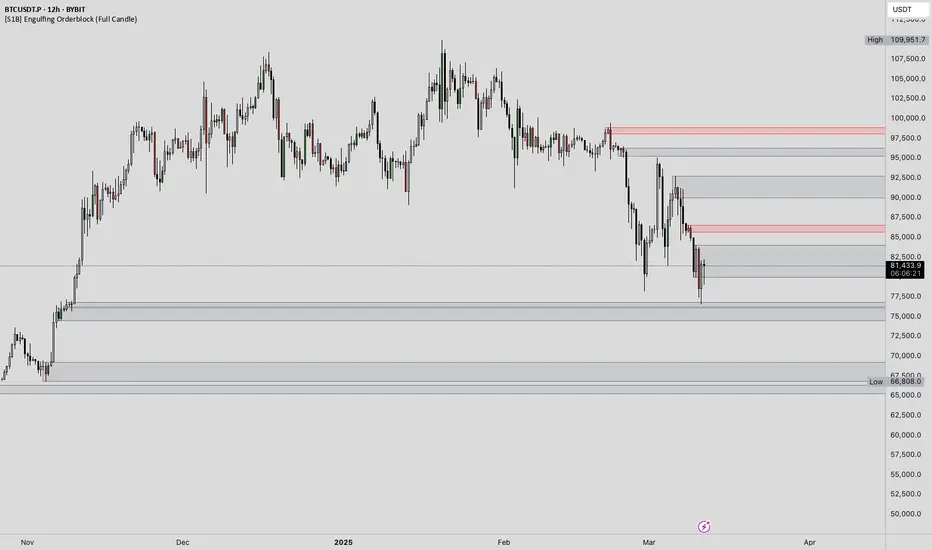
[S1B] Engulfing Orderblock
The Engulfing Orderblock indicator is a custom script designed to visually highlight and track bullish and bearish engulfing patterns on a price chart. These patterns are widely used in technical analysis to identify potential reversal points. The indicator dynamically draws colored boxes around the previous candle involved in the engulfing event, making it easier for traders to spot these setups in the price action.
Key Features:
Bullish Engulfing Pattern:
When a bearish candle (one where the open is higher than the close) is followed by a candle whose close is above the previous candle’s open, the indicator detects a bullish engulfing pattern. A green box is drawn around the previous candle.
• Box Style Options: Users can choose whether the box represents the candle’s body (from open to close) or its wick (from open to low).
Bearish Engulfing Pattern:
When a bullish candle (one where the open is lower than the close) is followed by a candle whose close is below the previous candle’s open, a bearish engulfing pattern is identified. A red box is drawn around the previous candle.
• Box Style Options: The box can be drawn using the candle’s body (from close to open) or its wick (from high to open), according to the user’s preference.
Dynamic Box Management:
Once a box is drawn, the indicator continuously monitors the price. If the price moves beyond the box’s range, the box is either deleted or its color changes to gray, indicating that the pattern’s relevance may be diminishing.
Max Pattern Tracking:
To prevent clutter, the indicator limits the number of displayed engulfing boxes to 500 by default. Older boxes are removed as new patterns are detected.
Customization:
Users can adjust the number of previous bars scanned for engulfing patterns as well as the maximum number of patterns displayed. An option is also provided to select whether the box should reflect the candle’s body or include the wick.
How It Works:
Pattern Detection:
The script compares the current price with the previous candle’s data to detect either a bullish or bearish engulfing pattern.
Box Creation:
When a pattern is detected, a colored box is drawn around the previous candle’s price range (using the user-selected style) to visually highlight the orderblock.
Pattern Expiry and Cleanup:
The indicator monitors each drawn box, deleting or modifying it (changing the color to gray) if the price moves significantly beyond the box’s range.
Remark:
The original concept for this indicator is from daisukeburn . อินดิเคเตอร์

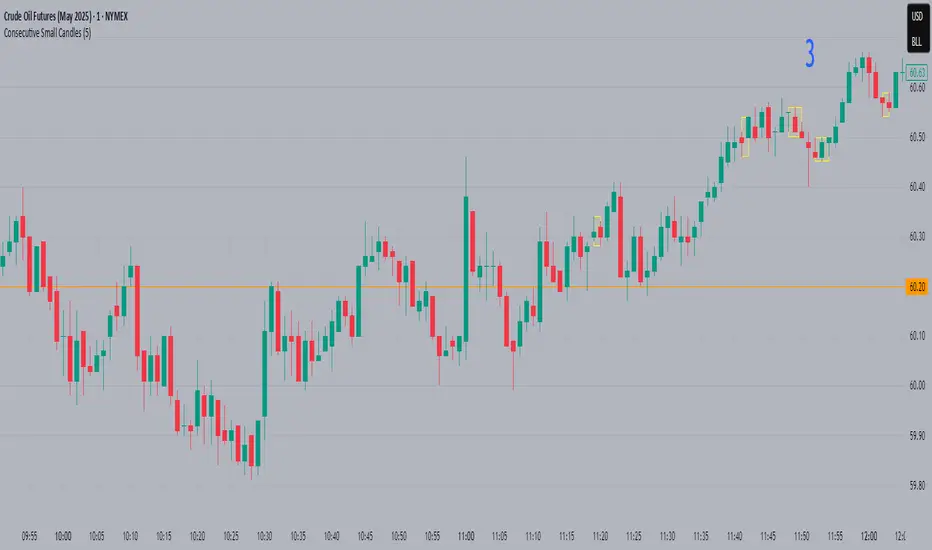
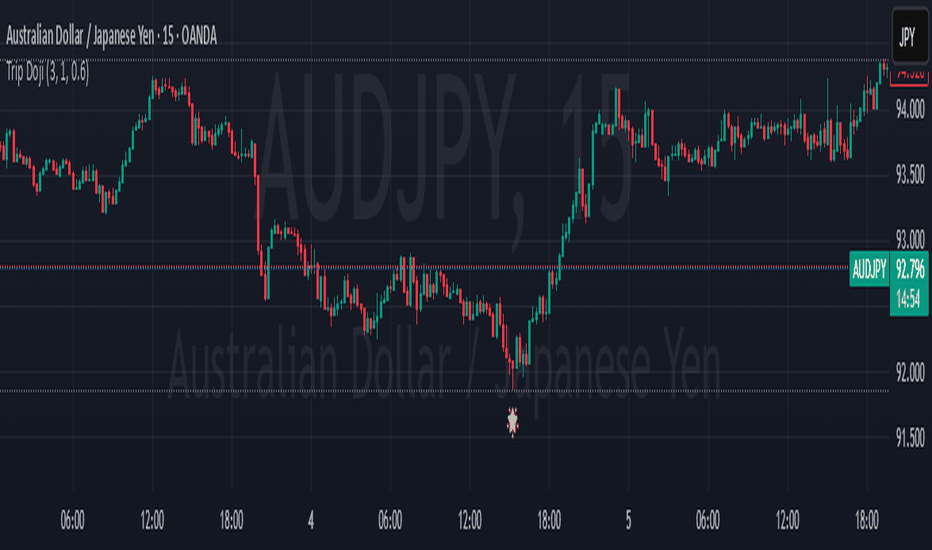
Triple Doji SequenceThe Triple Doji Sequence indicator helps traders identify consecutive Doji candlestick patterns, allowing them to choose between spotting single, double, or triple Dojis. A Doji is detected when the candle's body is small relative to its wicks, with either the upper or lower wick being significantly larger. Users can customize their own Doji criteria by adjusting the body size and wick dominance settings. The indicator ensures that consecutive Dojis align in the same direction before confirming a valid pattern, making it easier to identify market indecision or potential trend reversals.
When the chosen Doji sequence is detected, the indicator plots a star (*) above bearish Dojis (upper wick dominant) and below bullish Dojis (lower wick dominant). It also sends alerts when a valid sequence is confirmed at the close of the bar. This tool helps traders refine their strategy by spotting repeated Doji formations, which may indicate key turning points or continuation patterns in price action.
How to Use the Triple Doji Sequence Indicator?
Apply the Indicator:
Add the Triple Doji Sequence indicator to your TradingView chart.
It will automatically scan for Doji patterns based on your settings.
Customize Your Doji Criteria:
Adjust the body size and wick dominance settings to define what qualifies as a Doji.
Choose whether to detect single, double, or triple Doji sequences.
Interpret the Signals:
A star (*) above a candle signals a bearish Doji (upper wick dominant).
A star (*) below a candle signals a bullish Doji (lower wick dominant).
Set Up Alerts:
Enable alerts to receive notifications when a Doji sequence is confirmed at bar close.
Choose alert frequency based on your trading strategy (e.g., once per bar, once per bar close).
Use in Trading Strategy:
Doji sequences can indicate trend reversals or market indecision.
Combine this indicator with support/resistance levels, volume, or other indicators to confirm signals.
PS: Good luck in finding a Triple Doji :) อินดิเคเตอร์
อินดิเคเตอร์
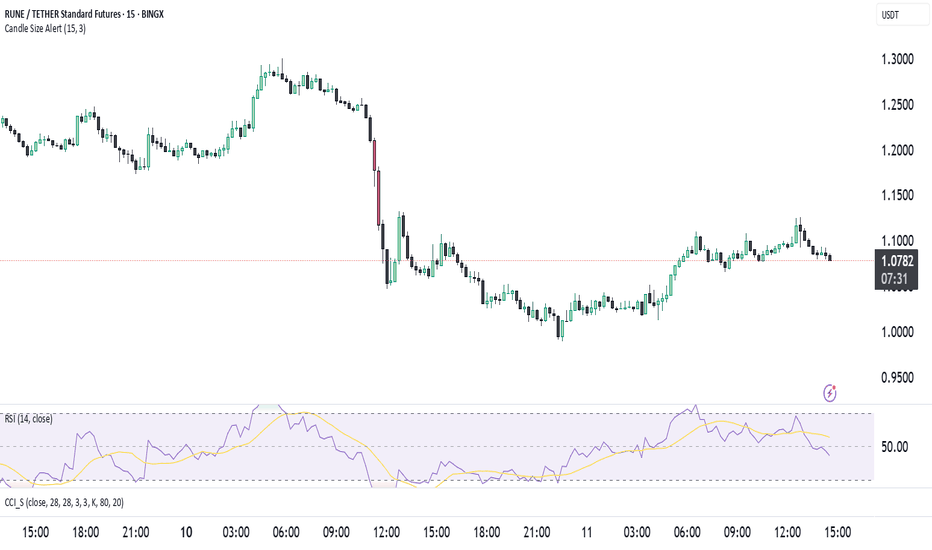
Previous Day LevelsThis indicator plots the previous day's high, low, and 50% levels, providing a framework for analyzing price behavior relative to these key levels.
Full Description:
The Previous Day Levels indicator is a tool designed to help traders analyze price action based on key levels from the previous trading session. By plotting the high, low, and mid-point (50%) of the prior day’s range, traders can assess potential market bias and directional tendencies for the current trading day.
Key Features:
Plots the previous day’s high (100%), low (0%), and intermediate levels (25%, 50%, 75%).
Allows users to customize line visibility, color, style, and width.
Helps traders identify potential support and resistance zones.
Provides a bias framework for determining whether price is more likely to target the previous high or low based on behavior around the 50% level.
Use Case:
This indicator is particularly useful for intraday and short-term traders who incorporate price action into their strategy.
If price trades above the 50% level and holds, it suggests a bullish bias, indicating that price may aim for the previous day's high.
If price trades below the 50% level and holds, it suggests a bearish bias, indicating that price may aim for the previous day's low.
The high and low levels can act as key support and resistance zones, where price may react or reverse.
How to Use:
Apply the indicator to your chart.
Observe how price interacts with the 50% level.
Use price behavior around these levels to establish a directional bias.
Adjust the line styles and colors to match your personal preference.
Disclaimer:
This indicator is a tool for market analysis and does not provide financial advice. Always perform your own analysis and risk management when trading. อินดิเคเตอร์

MainFX session indicatorScript Title: MainFX Session Indicator with Customizable Lines
Overview:
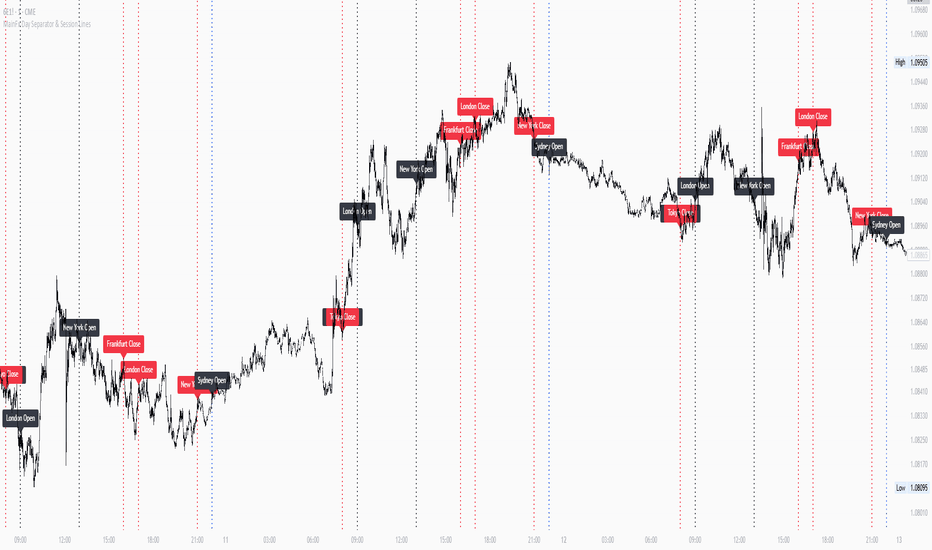
This script is designed to help traders visually identify key market sessions on their TradingView charts. It marks both the opening and closing of major sessions (Frankfurt, London, New York, Sydney, and Tokyo) by drawing lines and labels on the chart. The indicator is highly customizable, allowing you to define specific session times, choose your preferred time zone, and adjust the visual appearance of all lines.
Key Features:
Custom Session Times:
Each session’s start and end times are defined by user inputs in a simple HHMM-HHMM format. This means you can adjust the sessions to match the exact market hours you follow, making the indicator flexible for different trading strategies and markets.
Time Zone Flexibility:
The "Chart/Local Time Zone" input lets you override the default time zone of your chart. By setting a specific time zone (e.g., "Africa/Lagos" or "Africa/Accra"), the script calculates session start and end events relative to that zone. This ensures that, regardless of where you are trading from, the session markers accurately reflect the intended market hours and adjust automatically for Daylight Saving Time if applicable.
Open Range Levels (ORH/ORL):
When a session opens or closes, the script draws horizontal lines at the high and low of the candle immediately before the event. These levels act as the Open Range High (ORH) and Open Range Low (ORL) markers. They serve as key reference points for traders to gauge price levels established just before a session change.
Customizable Visuals:
Every visual element is customizable. You can adjust the color, width, and style (defaulting to a dotted line) of both the ORH/ORL lines and the combined session lines that label open and close events. This allows you to tailor the indicator to match your charting style and ensure that the lines stand out clearly.
Session Event Detection:
The script utilizes helper functions to check each bar on the chart. It compares the current bar’s session status with that of the previous bar to determine whether a session has just started or ended. When such a transition is detected, it triggers the drawing of the appropriate lines and labels.
Optimized for Intraday Trading:
Since the script’s functionality is based on minute-level bar changes, it is best used on 1-minute or lower timeframes. This ensures precision in marking the exact moments when sessions transition, which is critical for intraday trading strategies.
How It Works:
Session Timing:
The script calculates the session periods using the time() function with the user-defined session strings and time zone. This makes it independent of the chart’s inherent time settings.
Event Triggering:
When the current bar transitions into or out of a session (i.e., the session status changes between bars), the script detects this change. It then draws horizontal lines at the previous candle’s high and low (marking ORH and ORL) and adds session labels for clarity.
Visual Customization:
Users can easily change the appearance of the drawn lines and session labels via the script’s input options, ensuring that the indicators are both aesthetically pleasing and functionally clear.
Usage:
For Traders:
Use this indicator to keep track of critical market sessions and to spot participants in the session.
Customization:
Adjust session times and the time zone to suit your local market or the specific market you are analyzing.
Visual Clarity:
Customize line styles to ensure that your chart remains clear and that the session markers are easy to interpret even during overlapping sessions.
อินดิเคเตอร์
อินดิเคเตอร์
อินดิเคเตอร์

กลยุทธ์

อินดิเคเตอร์