อินดิเคเตอร์

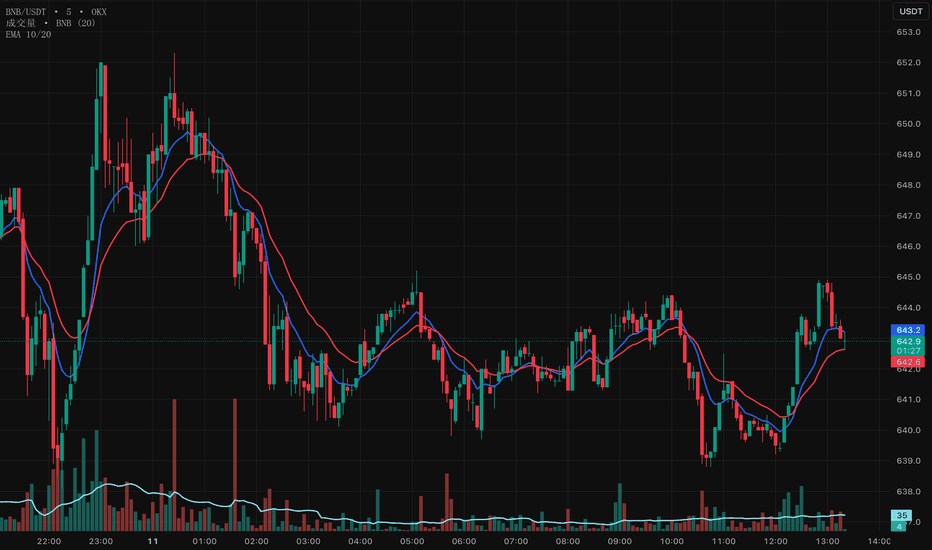
EMA Slope Pro - Dual Higher Timeframe Structural Trend Filter
What the indicator does
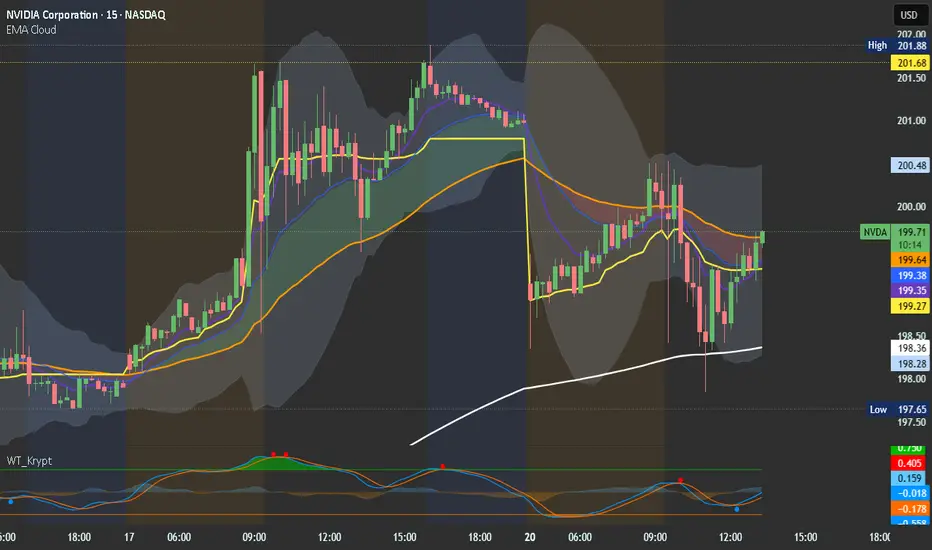
-This indicator plots two independent Exponential Moving Averages, each sourced from a separate user-configurable higher timeframe, directly onto your execution chart. The key difference from a standard EMA is that each line is color-coded in real time based on a quantified slope measurement — a normalized percentage that tells you not just the direction of the trend but its actual rate of change. The slope value and directional state are displayed as a live label at the right edge of each line, so you can filter entries by momentum magnitude rather than visual impression.
-The two EMAs create a dual-layer structural filter. EMA 1 (default: 200-period on the 4-hour timeframe) tracks the intermediate trend. EMA 2 (default: 200-period on the Daily timeframe) tracks the primary trend. A dedicated confluence alert fires when both layers simultaneously agree on direction, identifying the highest-confidence setups.
How it works
-Both EMAs and their slopes are calculated entirely inside request.security() calls — all arithmetic runs on the higher timeframe dataset before the results are returned to your chart. This eliminates cross-timeframe contamination that occurs when HTF prices are fetched and then processed against lower-timeframe bar series.
-The slope formula is: ((EMA_now - EMA ) / close) * 100. Dividing by the current closing price normalises the result so it is dimensionally consistent across all instruments regardless of price magnitude. A crypto pair at $60,000 and a forex pair at $1.08 will show comparable slope readings for equivalent structural momentum. Without this normalisation, the raw EMA delta is meaningless for cross-instrument comparison.
-On repainting: all request.security() calls in this indicator use exclusively barmerge.lookahead_off — the only setting that does not introduce lookahead bias. The "Wait for Candle Close" toggle controls whether each EMA updates only on confirmed HTF bar closes (the default, recommended for signal use) or on every realtime tick using the current live close. The live-tick mode does not use lookahead_on and does not fetch future prices — it uses the current bar's close as it builds, which is the live market price, not a future value. Both modes are zero-repainting by design.
-A single shared flat threshold (default 0.05%) is applied to both EMAs. When the absolute slope of either EMA falls below this value, that line is painted in the sideways color and treated as a low-momentum zone. This threshold is configurable to match the volatility profile of the instrument you are trading.
What makes it original
-A standard EMA gives you a curved line. Whether that line is rising sharply or barely drifting upward is left entirely to visual interpretation. This indicator resolves that ambiguity by converting each EMA's motion into a live, normalized rate-of-change percentage shown directly on the chart. You can then apply a minimum slope threshold as a signal filter — for example, only take long setups when EMA 1 is above +0.08% and EMA 2 is above +0.05%, which means both the intermediate and primary trends are not just directionally positive but actively accelerating.
-The dual-HTF architecture means you get two independent structural readings simultaneously on a single chart without manually switching timeframes. The confluence alert fires only on the first bar where both layers agree, using state-transition detection — it does not repeat on every bar where the condition holds. This is the same approach institutional desks use to qualify trend regime entries: requiring agreement from multiple timeframe layers before considering a position.
How to use it
-Set your chart to your execution timeframe. Set EMA 1 to a timeframe approximately four times your chart (for a 15-minute chart, use 1H or 4H). Leave EMA 2 on the Daily default, or raise it to Weekly for broader confirmation.
-Both lines green (bullish): intermediate and primary trends are aligned upward. Look for long setups on your execution timeframe. Avoid counter-trend shorts.
Both lines red (bearish): both trend layers agree to the downside. Look for short setups. Avoid longs.
Mixed state (one green, one grey or red): structural disagreement between timeframes. Reduce position size or wait for alignment.
Both lines grey: low-momentum range conditions across both timeframes. Avoid trend-following entries entirely.
F-or precision filtering, use the slope label values directly. A reading of +0.10% or above on EMA 2 indicates an established, actively accelerating trend. Readings between 0.05% and 0.10% signal a trend building momentum — tradeable but with tighter risk parameters. Below the flat threshold on either line, treat that timeframe as structurally neutral regardless of the line's visual direction.
-For alerts, the "EMA 1 + EMA 2 - Confluence Agreement" alert is the primary signal. Set it to fire on bar close. Use the individual EMA 1 and EMA 2 bullish and bearish transition alerts as early-warning notifications for when one trend layer changes before the other has confirmed.
Settings
-EMA 1 - Length: Period of the first EMA. Default 200 tracks long-term institutional structure. Use 50 for intermediate-term trend tracking.
-EMA 1 - Timeframe: Higher timeframe source for EMA 1. Default 4H. For day trading on a 5-minute chart, 1H or 4H works well.
-EMA 2 - Length: Period of the second EMA. Default 200. Can be set to a different length than EMA 1 to monitor two distinct structural levels simultaneously — for example, EMA 1 at 50 on 4H for intermediate structure and EMA 2 at 200 on Daily for primary structure.
-EMA 2 - Timeframe: Higher timeframe source for EMA 2. Default Daily. For long-term swing trading, raise to Weekly.
-Show EMA 2: Toggles the EMA 2 line on or off. Alert conditions for EMA 2 remain active even when the line is hidden.
-Slope Lookback Bars: Number of higher timeframe bars over which the slope is measured. Default 10. On a 4H chart this covers 40 hours. On the Daily it covers two calendar weeks. Increase to smooth volatility spikes; decrease for faster response to structural changes.
-Wait for Candle Close: When on, both EMAs update only after their respective HTF bar closes. Strongly recommended for all signal-based use to avoid acting on in-progress, unconfirmed HTF values.
-Flat Threshold (%): The slope cutoff for the sideways classification. Default 0.05%. Raise to 0.10-0.15% for high-volatility crypto markets. Lower to 0.02-0.03% for low-volatility instruments such as major forex pairs.
-EMA 1 and EMA 2 Line Width: Independent visual thickness controls. Default 4 for EMA 1 and 2 for EMA 2, creating a clear visual hierarchy between the primary and secondary layers.
-Bullish / Bearish / Flat Colors: All three state colours apply to both EMAs simultaneously. The shared palette ensures instant visual comparison between the two lines.
-Show Slope Labels: Displays a live label at the right edge of each EMA showing the current slope percentage and directional state (BULL, BEAR, or SIDE).
-Bullish Color / Bearish Color / Flat Color: Line colours for each of the three states. Fully customisable. These apply to both EMA lines simultaneously so the colour coding remains visually consistent across both timeframe layers.
-Show Background Tint: Enables a subtle background colour wash driven by EMA 2 trend state. Green when EMA 2 is bullish, red when bearish, no tint when flat. The tint colour is independent from the EMA line colours — you can use a softer shade for the background without affecting the line colour logic.
-Background Bullish Color / Background Bearish Color: The exact colour used for the background wash in each directional state. Default values are a soft green and soft red. For traders using dark themes, a slightly more saturated colour at higher transparency reads more clearly than a very light shade at low transparency.
-Background Tint Transparency: Controls how prominent the background wash is. Range 0 (fully opaque) to 99 (invisible). Default 93 produces a subtle ambient tint. Raise to 96-98 for a near-invisible hint of direction, lower to 85-88 for a stronger zone marker. Does not affect the EMA line colours.
-Alerts: Six independent alert conditions — three for EMA 1 (bullish, bearish, and flat-zone transitions), two for EMA 2 (bullish and bearish transitions), and one confluence alert for when both EMAs agree on direction simultaneously. All fire once per state change only, not on every bar.
Markets and timeframes
Works on all markets: equities, indices, forex, crypto, and commodities. The slope normalisation formula makes readings comparable across all price scales.
For intraday traders (5-minute to 15-minute execution): set EMA 1 to 1H or 4H, EMA 2 to Daily. Use the confluence alert as the primary bias filter and apply your entry method only in the agreed direction.
For swing traders (1H to 4H execution): set EMA 1 to Daily, EMA 2 to Weekly. This layers a weekly structural view over a daily intermediate view.
For crypto traders: raise the flat threshold to 0.08-0.12% to account for the higher baseline volatility of crypto markets compared to equities or forex.
This is a structural bias filter, not a standalone entry system. It is designed to work alongside your existing entry methodology to eliminate low-probability setups taken against the dominant multi-timeframe trend.
Disclaimer
Past performance of any indicator is not indicative of future results. This tool is provided for informational and educational purposes and does not constitute financial advice. Suitable for all markets and all timeframes. Always apply appropriate position sizing and risk management.
อินดิเคเตอร์

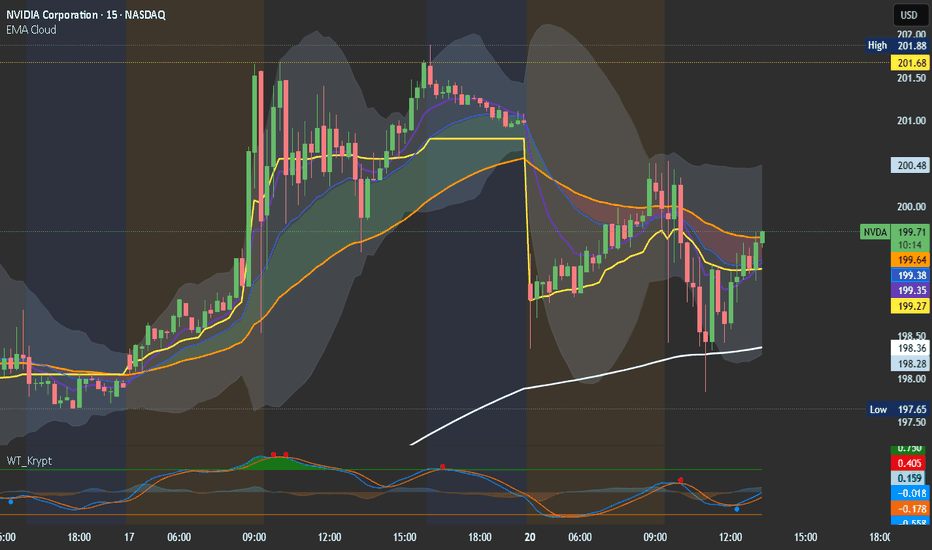
Multi-Higher Time Frame (M-HTF) EMA [UkutaLabs]█ OVERVIEW
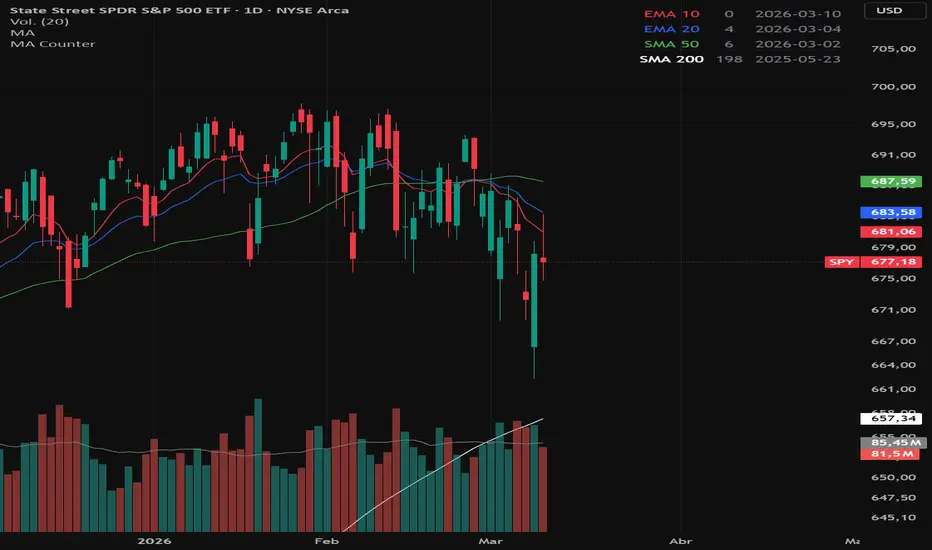
The Multi Higher Time Frame EMA is designed to bring the clarity of higher-timeframe trend analysis directly onto your current chart. Instead of constantly switching between timeframes, this indicator plots Exponential Moving Averages from multiple higher timeframes simultaneously, allowing traders to see where major trend levels exist relative to current price action.
Higher timeframe EMAs often act as dynamic support and resistance, and they are widely used by traders to identify the dominant market trend. By visualizing several higher timeframe EMAs at once, this tool helps traders quickly determine whether the market is aligned, transitioning, or in conflict across timeframes.
This creates a powerful framework for trend confirmation, pullback entries, and overall market structure awareness.
█ FEATURES
• Plot multiple higher timeframe EMAs on a single chart
• Customize EMA Line Style and Color for each timeframe
• Clearly visualize major trend levels across timeframes
• Helps identify confluence zones where multiple EMAs cluster
• Works on any market and any timeframe
█ USAGE
Trend Confirmation
When price remains above most higher timeframe EMAs, the market is generally in a strong bullish trend.
When price remains below most higher timeframe EMAs, the market is typically bearish.
Pullback Entries
Many traders look for price to pull back toward a higher timeframe EMA during a trend. These levels frequently act as dynamic support or resistance where continuation moves may occur.
EMA Confluence
When multiple higher timeframe EMAs begin to cluster in the same price region, it often forms a strong reaction zone where price may consolidate, reverse, or accelerate.
Multi-Timeframe Alignment
The strongest trends often occur when lower timeframe price action aligns with higher timeframe EMAs. If price is above the daily and 4H EMAs while also trending up on the current chart, the probability of continuation typically increases.
█ WHY USE HIGHER TIMEFRAME EMAs?
Higher timeframe indicators reflect larger market participation and therefore tend to carry more weight than signals from smaller timeframes. Visualizing them on a lower timeframe chart helps traders stay aligned with the broader market structure while still executing precise entries. อินดิเคเตอร์

กลยุทธ์

อินดิเคเตอร์

อินดิเคเตอร์
อินดิเคเตอร์

อินดิเคเตอร์
อินดิเคเตอร์
Apex Momentum Wave [Pineify]Apex Momentum Wave
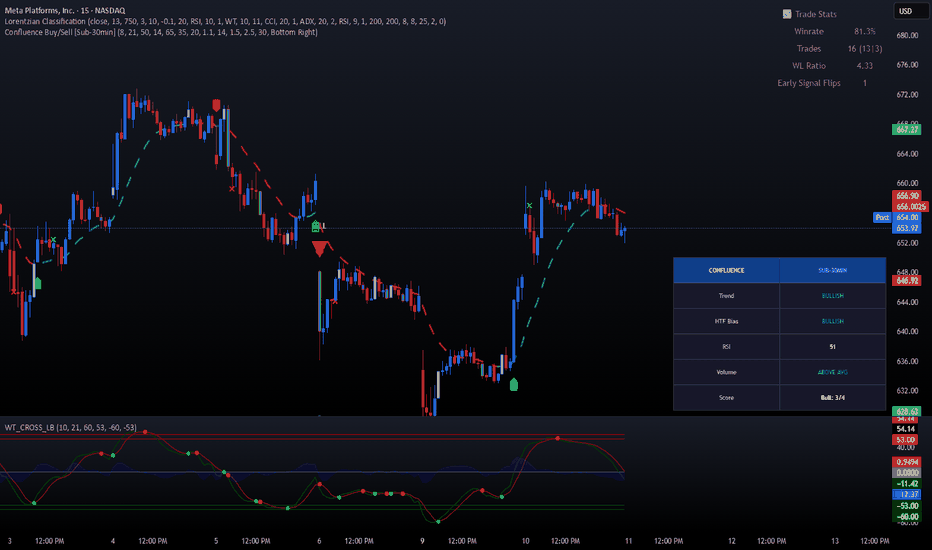
The Apex Momentum Wave (AMW) is a noise-filtered momentum oscillator that combines Hull Moving Average price smoothing with RSI momentum measurement and an EMA-based signal line to produce cleaner, more actionable momentum readings. Instead of applying RSI directly to raw price — which often generates noisy, whipsaw-prone signals — AMW first smooths the close price through an HMA filter to strip out short-term market noise, then measures momentum on this cleaned data. The result is a responsive yet smooth oscillator that highlights genuine momentum shifts while suppressing false signals. Buy and sell markers are further refined by a midline filter that only triggers entries when momentum is turning from a favorable position, making this indicator a practical tool for timing entries across any market and timeframe.
Key Features
HMA-smoothed RSI oscillator — applies RSI to a Hull Moving Average of price rather than raw close, dramatically reducing noise and false momentum readings.
EMA signal line with crossover detection — a trailing signal line provides clear, objective crossover-based entry triggers.
Midline-filtered buy/sell signals — BUY signals only fire when momentum crosses up below the 50 midline (turning from weakness), and SELL signals only fire when crossing down above 50 (turning from strength), filtering out low-conviction entries.
Multi-layer visual zone system — overbought/oversold zones, dynamic breach fills, and oscillator-signal cloud fills provide instant visual context of market momentum state.
Built-in alert conditions — configurable alerts for both BUY and SELL signals for hands-free monitoring.
How It Works
The indicator follows a three-stage calculation pipeline designed to extract clean momentum information from price:
Price smoothing via Hull Moving Average (HMA): The closing price is first passed through an HMA with a configurable period (default: 7). The Hull Moving Average uses a combination of weighted moving averages with a square-root-period final smoothing step, producing a curve that closely tracks price with significantly less lag than traditional SMA or EMA. This step acts as a pre-filter, removing intrabar noise and minor fluctuations before momentum is measured.
Momentum measurement via RSI: The Relative Strength Index is then calculated on the HMA-smoothed price over a configurable lookback (default: 14). Because the input price has already been cleaned by the HMA, the resulting RSI oscillator produces smoother momentum readings that more accurately reflect the underlying trend's strength, rather than reacting to every minor price tick.
Signal line via EMA: An Exponential Moving Average (default period: 9) is applied to the oscillator output, creating a trailing signal line. Crossovers between the oscillator and this signal line indicate momentum direction changes — the oscillator crossing above the signal suggests strengthening momentum, while crossing below suggests weakening momentum.
Trading Ideas and Insights
The AMW is designed to be versatile across different trading styles and market conditions. Here are practical approaches:
Momentum reversal entries: The primary use case — when a BUY triangle appears (oscillator crosses above signal below the 50 midline), it indicates momentum is shifting from bearish to bullish while still in the lower half of the range, catching the turn early. Enter long and target the midline or overbought zone. The SELL signal is the mirror for short entries.
Overbought/oversold confluence: When the oscillator enters the shaded overbought zone (above 80) or oversold zone (below 20), the market is at a momentum extreme. Wait for the oscillator to turn and cross below the signal line (in overbought) or above it (in oversold) for high-probability mean reversion trades.
Trend confirmation: Use the cloud fill between the oscillator and signal line as a trend filter. A sustained bullish (green) cloud suggests maintaining long bias; a sustained bearish (red) cloud suggests maintaining short bias. Only take signals aligned with the prevailing cloud color for higher win rates.
Divergence analysis: Compare the oscillator's peaks and troughs with price action. If price makes a higher high but the oscillator makes a lower high, bearish divergence suggests weakening momentum — and vice versa for bullish divergence. These divergences often precede significant reversals.
How Multiple Indicators Work Together
The AMW integrates three distinct technical components into a cohesive system, each serving a specific role:
Hull Moving Average (noise reduction): The HMA serves as the foundation layer, transforming noisy raw price data into a clean input signal. Its near-zero-lag property is critical — if a lagging average like SMA were used instead, the subsequent RSI calculation would inherit that lag, making the entire oscillator slow to react. HMA preserves responsiveness while eliminating the noise that causes false RSI signals.
Relative Strength Index (momentum quantification): RSI converts the smoothed price movement into a bounded 0–100 oscillator that measures the speed and magnitude of price changes. Applied to the HMA-filtered price, it produces a momentum reading that is both responsive and stable — capturing genuine momentum shifts without the jitter that plagues standard RSI on raw price.
Exponential Moving Average signal line (timing mechanism): The EMA of the oscillator creates a reference line that the oscillator oscillates around. Crossovers between the two provide objective, rule-based entry timing. The EMA's inherent smoothing prevents the signal line from reacting to every minor oscillator fluctuation, ensuring crossovers represent meaningful momentum changes rather than noise.
The synergy is sequential: HMA cleans the price → RSI measures momentum on clean data → EMA provides a timing reference for the momentum reading. Each layer builds on the previous one, and the midline filter on top adds a final directional bias check, ensuring the complete system produces signals only when multiple conditions align.
Unique Aspects
Pre-filtered RSI approach: Most oscillator indicators apply RSI (or similar) directly to raw price. AMW's innovation is the HMA pre-smoothing step, which fundamentally changes the quality of the RSI output. This two-stage approach produces a momentum oscillator that behaves more like a "true" momentum reading rather than a noisy derivative of price.
Midline directional filter: Unlike simple crossover systems that generate signals anywhere in the oscillator range, AMW restricts BUY signals to the lower half (below 50) and SELL signals to the upper half (above 50). This ensures entries occur when momentum is turning from a relatively extreme position, significantly reducing false signals during choppy, range-bound conditions.
Multi-layer visual feedback: The indicator provides four distinct visual layers — oscillator-signal cloud fill, horizontal zone lines, extreme zone background shading, and dynamic breach fills — giving traders an immediate, at-a-glance understanding of the current momentum state without needing to interpret raw numbers.
Clean sub-panel design: As a non-overlay oscillator, AMW keeps the price chart uncluttered while providing all momentum information in a dedicated panel, making it easy to combine with overlay-based indicators like moving averages or support/resistance tools.
How to Use
Add the indicator to your chart. It will appear in a separate panel below the price chart, displaying the oscillator (thick line), signal line (orange), and reference levels.
Watch for BUY triangles (green, at the bottom of the panel) — these appear when the oscillator crosses above the signal line while below the 50 midline, indicating a bullish momentum shift from a weak state.
Watch for SELL triangles (red, at the top of the panel) — these appear when the oscillator crosses below the signal line while above the 50 midline, indicating a bearish momentum shift from a strong state.
Use the cloud fill color between the oscillator and signal line to gauge the prevailing momentum direction — green for bullish, red for bearish.
Monitor the overbought (80) and oversold (20) zones. When the oscillator enters these shaded areas and the breach fill activates, the market is at a momentum extreme — be alert for potential reversals.
Set up alerts using the built-in "AMW Buy Signal" and "AMW Sell Signal" alert conditions to receive real-time notifications.
Customization
Momentum Length (default: 14): The RSI lookback period. Lower values (e.g., 8–10) make the oscillator more sensitive and responsive, suitable for scalping or lower timeframes. Higher values (e.g., 21–30) produce smoother, more stable readings for swing trading or higher timeframes.
Price Smoothing / HMA (default: 7): Controls the Hull Moving Average period applied to price before RSI calculation. Lower values preserve more price detail but allow more noise through; higher values produce a cleaner oscillator but introduce slight additional lag. Find the balance that suits your timeframe.
Signal Line Length (default: 9): The EMA period for the signal line. Shorter periods make the signal line more reactive, generating more frequent crossovers; longer periods produce fewer but potentially more reliable crossover signals.
Overbought Level (default: 80): The upper threshold for the extreme zone. Raise to 85 or 90 for fewer but more extreme overbought readings; lower to 70 or 75 for earlier warnings.
Oversold Level (default: 20): The lower threshold for the extreme zone. Lower to 10 or 15 for fewer but more extreme oversold readings; raise to 25 or 30 for earlier warnings.
All colors — bullish, bearish, and signal line — are fully customizable through the Colors & Aesthetics settings group.
Conclusion
The Apex Momentum Wave reimagines the classic RSI oscillator by introducing an HMA pre-smoothing stage that fundamentally improves signal quality. Combined with an EMA signal line for objective crossover timing and a midline directional filter that restricts entries to favorable momentum positions, AMW delivers a momentum oscillator that is both cleaner and more actionable than standard RSI implementations. Its multi-layer visual design — featuring cloud fills, zone shading, and dynamic breach highlights — provides traders with immediate, intuitive momentum context. Whether you trade stocks, forex, crypto, or futures, the Apex Momentum Wave adapts to your market and timeframe, offering a refined approach to momentum-based trading decisions. อินดิเคเตอร์

อินดิเคเตอร์
อินดิเคเตอร์

อินดิเคเตอร์

MES Etap 0EN:
One indicator replacing seven. Designed for learning to read the market and exporting clean data for AI analysis.
What's inside:
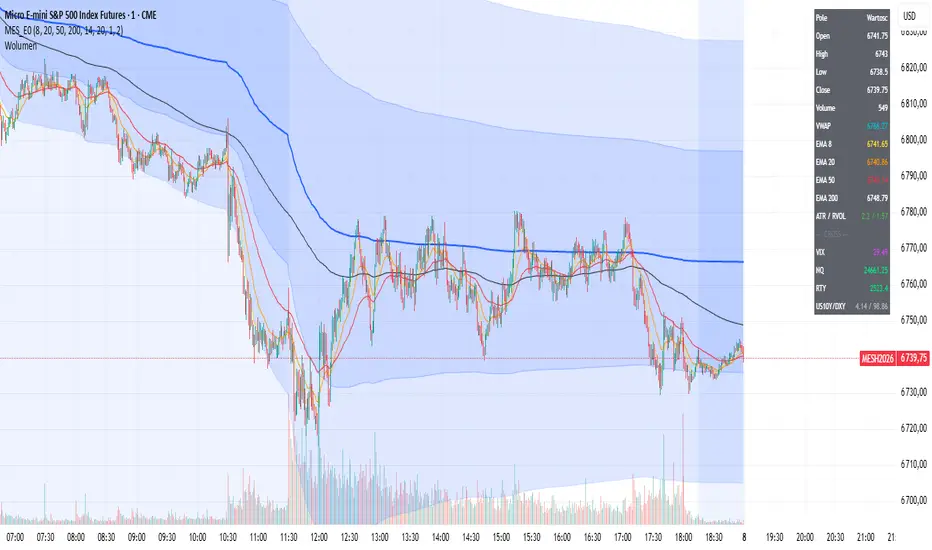
Session VWAP with standard deviation bands (1σ, 2σ)
EMA 8, 20, 50, 200 with proper column names in CSV export
ATR(14) and RVOL (relative volume) in Data Window
Cross-asset data: VIX, NQ, RTY, US10Y, DXY on every candle
Live data table in the top-right corner (optional)
Why this exists:
TradingView's CSV export labels default EMA indicators as "Plot". Four EMAs = four "Plot" columns and you can't tell which is which. This indicator solves that: every column has a readable name (EMA_8, EMA_20, VWAP, ATR_14, VIX, NQ...). One export = complete data record ready for analysis.
Who it's for:
MES/ES traders building an R&D system with AI. Readers of the "Bractwo Rynku" book series. Anyone who wants clean, labeled data exports from TradingView.
Editable parameters:
EMA, ATR, RVOL periods, VWAP band multipliers, toggle table and bands on/off.
Takes 1 indicator slot. On Essential plan (limit 5) you still have room for Volume and more.
Open source. Repo: github.com/Badmike81/bractworynku-etap0
อินดิเคเตอร์

AVANTI MASTER PRO FINALAVANTI MASTER PRO FINAL – Smart Intraday Trend & Breakout System
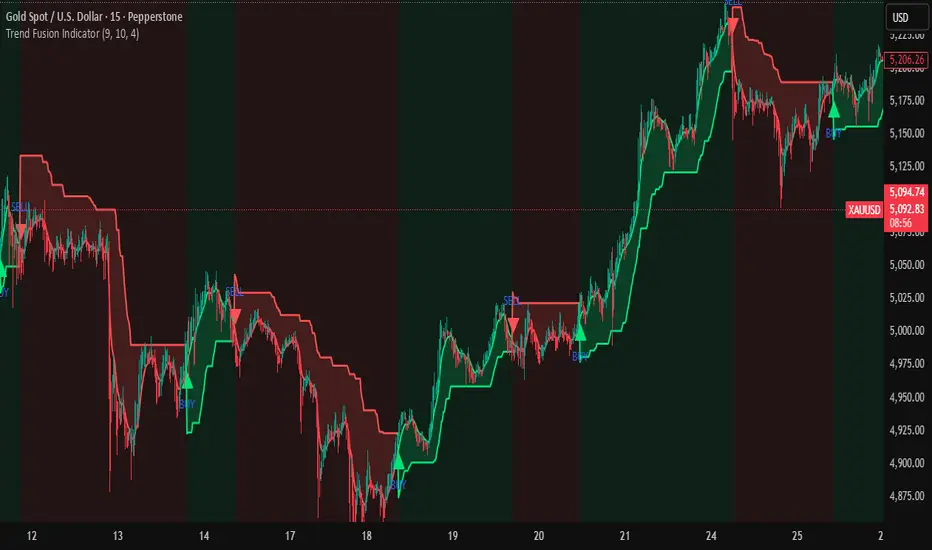
AVANTI MASTER PRO FINAL is an advanced intraday trading indicator designed to identify high-probability buy and sell opportunities using a combination of trend analysis, momentum strength, breakout scoring, and smart money behavior.
This indicator integrates multiple technical factors such as EMA trend structure, RSI momentum, breakout strength analysis, buildup detection, ADX trend strength filter, and multi-timeframe confirmation to help traders avoid sideways markets and focus on strong trending moves.
The system automatically generates entry signals and calculates risk-reward targets for different instruments.
Key Features
Trend Detection
Uses EMA 9, EMA 30, and EMA 200 to determine the overall market trend.
Multi-Timeframe Trend Filter
Signals are confirmed only when 5-minute and 15-minute trends align, improving trade accuracy.
Breakout Strength Score
A scoring system evaluates multiple bullish and bearish conditions to determine breakout probability.
RSI Momentum Confirmation
RSI is used to validate market momentum before generating signals.
ADX Trend Strength Filter
Signals are generated only when ADX > 23, helping to avoid sideways markets.
Buildup Analysis
Detects Long Buildup, Short Buildup, Short Covering, and Long Unwinding based on price and volume behavior.
Auto Target System
Automatically calculates Entry, TP1, TP2, TP3, and Stop Loss depending on the instrument.
Supported Instruments
Targets are optimized for:
• NIFTY
• Stock Options
• Crude Oil
• Natural Gas
Dashboard Information
The built-in dashboard displays key market insights such as:
• Trend status
• RSI momentum
• Breakout / Breakdown strength
• ADX trend strength
• Market buildup
• Trade zone indication
Best Use
This indicator is designed for intraday trading and trend continuation setups where strong momentum and trend confirmation are present.
Works best in trending markets.
Developed by AVANTI STOCKS – Satish D. Nakhate อินดิเคเตอร์

กลยุทธ์

อินดิเคเตอร์
กลยุทธ์

อินดิเคเตอร์

อินดิเคเตอร์

อินดิเคเตอร์
อินดิเคเตอร์

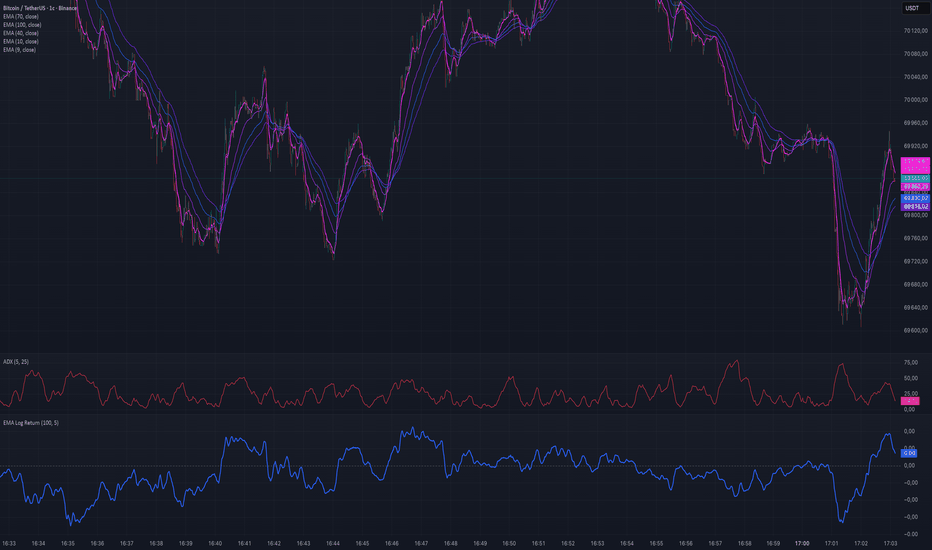
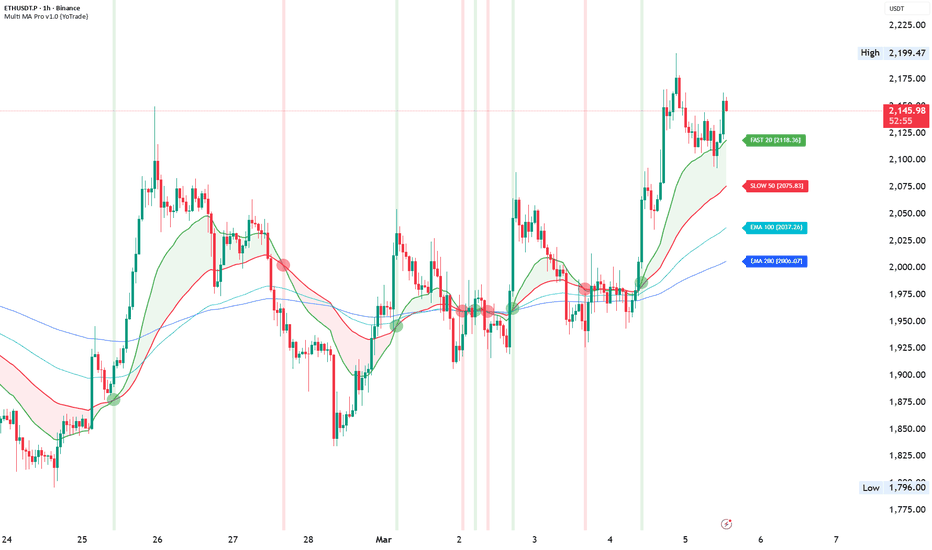
3 EMAs Minimalistas con EtiquetasEste script traza tres Medias Móviles Exponenciales (EMAs) configurables con un enfoque en la limpieza del gráfico. A diferencia de otros indicadores, este incluye etiquetas dinámicas al final de cada línea que identifican el periodo de la EMA (ej. "EMA 20", "EMA 200") con su color correspondiente.
Características principales:
Diseño Clean: Sin etiquetas que obstruyan las velas; los nombres flotan a la derecha del precio.
Totalmente Personalizable: Cambia periodos y colores desde el menú de configuración.
Optimizado: Código ligero en Pine Script v5/v6 que no ralentiza el gráfico.
Ideal para: Identificar rápidamente tendencias de corto, mediano y largo plazo sin saturar el panel.
This script plots three customizable Exponential Moving Averages (EMAs) with a focus on visual clarity. Designed for traders who prefer a clutter-free chart, it features intelligent identification labels that only appear at the end of the lines, preventing the "spaghetti" look often caused by standard indicator labels.
Key Features:
Minimalist Design: Clear identification labels positioned at the end of each EMA line.
Smart UI: Labels automatically update their position and color to match your settings.
Fully Customizable: Easily adjust periods and colors directly from the settings menu.
Performance Optimized: Lightweight code that keeps your charts running smoothly.
Trend Identification: Quickly visualize short, medium, and long-term trends at a glance.
Usage:
Perfect for day trading, swing trading, or long-term analysis. Use the settings panel to tailor the EMA lengths to your specific strategy (e.g., 9/21/50 for scalping or 50/100/200 for trend following). อินดิเคเตอร์