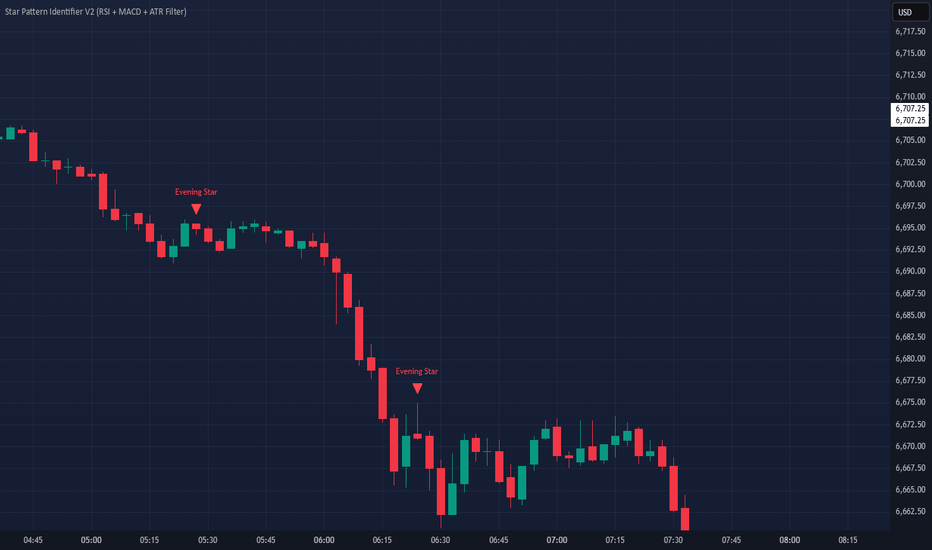
Morning & Evening Star Detector [SSFX]Morning & Evening Star Detector is an open-source candlestick pattern indicator designed to identify two classic 3-candle reversal formations: the Morning Star and the Evening Star.
The Morning Star is a bullish reversal pattern that typically appears after bearish pressure. The indicator identifies it using a 3-candle structure:
A strong bearish first candle
A small-bodied middle candle, representing hesitation or loss of momentum
A strong bullish third candle that closes back into the body of the first candle
The Evening Star is the opposite bearish reversal pattern. It is detected when the market forms:
A strong bullish first candle
A small-bodied middle candle
A strong bearish third candle that closes back into the body of the first candle
To make the patterns easier to read on the chart, the script automatically draws a box around the full 3-candle formation:
Green box = Morning Star
Red box = Evening Star
The box covers the full high-to-low range of the entire pattern, helping traders visually study where the reversal structure formed.
Main features:
Detects Morning Star bullish reversal patterns
Detects Evening Star bearish reversal patterns
Draws visual boxes around valid 3-candle patterns
Green highlight for Morning Star formations
Red highlight for Evening Star formations
Optional labels for detected patterns
Optional background highlighting
Adjustable candle body percentage filters
Adjustable middle candle size filter
Adjustable third candle close requirement
Optional gap requirement for more traditional pattern detection
Built-in alert conditions for both pattern types
The pattern logic is fully customizable. Users can adjust the required body size of the first candle, the maximum body size of the star candle, the minimum body size of the confirmation candle, and how deeply the third candle must close into the first candle’s body.
The optional gap setting is included for traders who prefer a more classical definition of Morning Star and Evening Star patterns. Since many markets such as forex, gold, crypto, and index CFDs often do not produce clean session gaps, the gap requirement can be turned off for more flexible detection.
This indicator is intended for educational and analytical use. It does not predict future price movement and should not be used as a standalone trading system. Morning Star and Evening Star patterns are best interpreted together with market structure, support and resistance, trend context, volume, and proper risk management.
อินดิเคเตอร์

อินดิเคเตอร์
อินดิเคเตอร์

Morning & Evening Star [TradingFinder] Stock Indices Gap Candle🔵 Introduction
In "technical analysis", there are certain reversal patterns that alert us to a potential reversal of a stock's previous trajectory.
Two significant patterns in this regard are the "Morning Star" pattern and the "Evening Star" pattern, which are formed by a combination of three different candlesticks and are considered as reversal patterns.
Here, we will examine how to identify these patterns and how to respond to them.
🟣 Morning Star Pattern
This pattern forms at the end of a downtrend and indicates the beginning of an uptrend.
The pattern consists of three candlesticks in the following order :
1.A large bearish candlestick
2.A candlestick with a short body
3.A bullish candlestick
With the formation of the morning star pattern, it is expected that the stock price will change direction and continue to rise. Therefore, in such situations, it is advisable to enter a long position and follow the uptrend.
Signs of the morning star pattern :
•The first sign of this pattern is the presence of a small-bodied candlestick at the end of the trend, accompanied by a gap from the previous candlestick (a bearish candlestick with a large body). Therefore, the bodies of the first and second candlesticks do not overlap.
•The second candlestick indicates market confusion and uncertainty. The color of the middle candlestick is not significant.
•The third candlestick must be positive and have a higher price than the previous candlestick (i.e., the small-bodied candlestick).
•The closing price of the third candlestick must be higher than half of the first candlestick.
🟣 Evening Star Pattern
This pattern forms at the end of an uptrend and indicates the beginning of a downtrend.
The pattern consists of three candlesticks in the following order :
1.A large bullish candlestick
2.A candlestick with a short body
3.A bearish candlestick
With the formation of the evening star pattern, it is expected that the stock price will change direction and continue to fall. Therefore, in such situations where this pattern is identified, it is advisable to refrain from entering a long position.
If the stock is traded in a two-way market, it is possible to profit by taking a short position after the formation of the evening star pattern.
Signs of the evening star pattern :
•The first sign of this pattern is the presence of a small-bodied candlestick at the end of the trend, accompanied by a gap from the previous candlestick (a bullish candlestick with a large body). Therefore, the bodies of the first and second candlesticks do not overlap.
•The second candlestick indicates market confusion and uncertainty. The color of the middle candlestick is not significant.
•The third candlestick must be negative and have a lower price than the previous candlestick (i.e., the small-bodied candlestick).
•The closing price of the third candlestick must be lower than half of the first candlestick.
🔵 How to Use
The "Filter" and "Market" features are available in the settings section, allowing you to customize the output of the indicator according to your needs.
With the "Filter" feature, you can filter the "Morning Star" and "Evening Star" patterns as "strong" or "weak." The difference between strong and weak patterns lies in their "Candle Body."
In strong patterns, the candle bodies account for more than 80% of the total candle range, while in weak patterns, the bodies comprise between 60% to 80% of the candle range.
If the "Filter" feature is set to "On," only strong patterns will be displayed. If it's set to "Off," all patterns will be displayed. By default, it's set to "Off."
The "Market" feature allows you to include "gaps" in your pattern identification calculations. You can choose between "Forex" and "Stock" modes. In the Forex pattern, calculations are performed without considering gaps since there are fewer gaps in the Forex market.
If gap calculations were to be part of the pattern identification conditions, only a very small number of patterns would be identified. However, in the "Stock" mode, gaps are considered as part of the identification conditions.
อินดิเคเตอร์

อินดิเคเตอร์

อินดิเคเตอร์

อินดิเคเตอร์

อินดิเคเตอร์

อินดิเคเตอร์