Fibonacci Confluence Suite [AxeAlgo]Fibonacci Confluence Suite
OVERVIEW
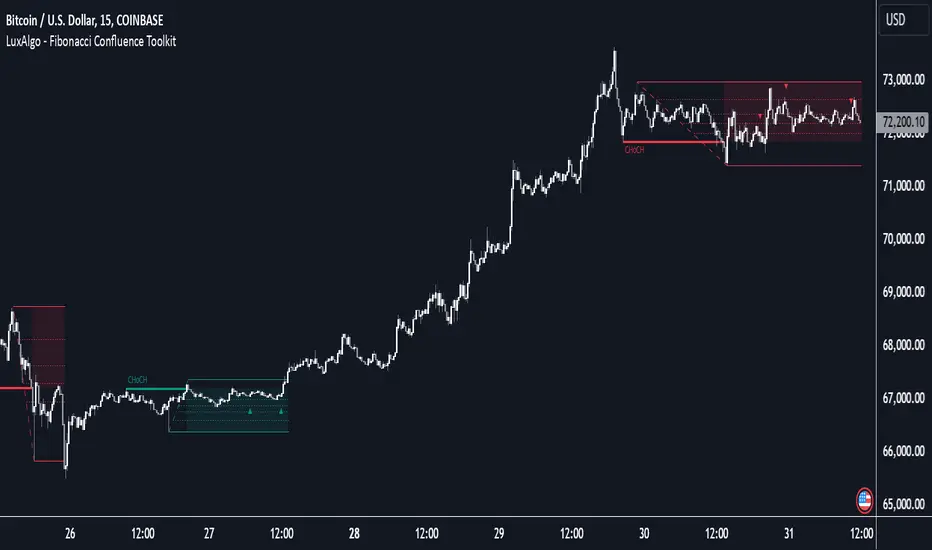
Fibonacci Confluence Suite is an automatic Fibonacci retracement and extension toolkit. Instead of requiring you to manually draw a Fibonacci tool on every swing, it detects swing highs and lows on its own using fractal price structure, draws the retracement/extension grid between them, and keeps that grid updated in real time as new swings form.
On top of the standard retracement levels, this script adds several layers of context that are normally separate, manually-maintained tools: a Golden Pocket highlight, a confluence check against prior swings, a per-level "touch count" strength score, an optional volatility-adaptive lookback, Fibonacci time zones, and a compact on-chart status table. The goal is to let you see not just where a Fibonacci level sits, but how significant that level appears to be.
This is a technical analysis / charting tool. It does not predict price, does not place trades, and is not a signal generator promising entries or exits.
HOW IT WORKS
1. Swing detection: the script scans for fractal highs and lows (a bar whose high/low is more extreme than the two bars on either side of it) within a user-defined lookback Period.
2. Anchors: the most extreme fractal high and fractal low found inside that window become the 0% and 100% anchors.
3. Direction: the detected swing is treated as an up-move or down-move depending on which side price broke out of most recently; you can flip this with the Reverse input if you prefer levels measured from the opposite end.
4. Grid: every retracement/extension ratio you enable is calculated from those two anchors and drawn as a labeled horizontal line, with the current price and touch count shown directly on the label.
5. Confluence: each time the swing flips, the prior swing's high/low is stored. Newly drawn levels are checked against the Fibonacci levels of those earlier swings, and any level that lines up within your tolerance is marked and drawn wider so overlapping structure stands out.
KEY FEATURES
- Automatic fractal-based swing detection, no manual drawing required.
- Base lines (0.000 / 1.000) plus up to nine independently configurable extension ratios, each with its own show/hide toggle and value.
- Adjustable line style, width, color, and extension direction (none / left / right / both) for base and extension lines separately.
- Golden Pocket highlight (0.618-0.65) with adjustable fill color, useful as a classic confluence/reaction zone.
- Multi-swing confluence detection: compares the current Fibonacci grid against up to five prior swings and flags levels that overlap, with an adjustable tolerance (as a percentage of the swing range) and a visual marker on confluent levels.
- Level strength via touch counts: each level tracks how many times price has traded through it since that specific swing grid was drawn, shown directly in the line label.
- Optional volatility-adaptive sensitivity: scales the effective lookback window using current ATR relative to its own baseline, so the swing detection can loosen or tighten automatically across changing volatility regimes instead of relying on one fixed Period. Disabled by default; when disabled the script behaves exactly like a fixed-Period fractal Fibonacci tool.
- Fibonacci time zones: optional vertical lines placed at Fibonacci bar-count offsets from the start of the current swing, for traders who also watch time-based confluence.
- Status table showing current trend direction, swing high/low, nearest level to price, the strongest (most-touched) level, and the lookback period actually in use.
- Built-in alerts: a per-level alert whenever price trades through any visible base or extension line, a dedicated Golden Pocket alert, and grouped "any base line" / "any extension line" alert conditions for the classic Alert dialog.
HOW TO USE IT
- Period / Delay: Period sets how many bars back the script searches for the swing high/low. Delay sets how many bars of confirmation a fractal needs before it can be used; it must be smaller than Period. Larger Delay values produce more reliable fractals at the cost of a slower reaction to new swings.
- Line Extension: controls whether the drawn levels extend left, right, both directions, or not at all.
- Reverse: flips which anchor (swing high or swing low) is treated as the 0% origin, letting you view the same swing from the opposite bias.
- Base Lines / Extension Lines groups: toggle, color, style, and set the ratio of each level independently.
- Golden Pocket: toggle and recolor the 0.618-0.65 zone highlight.
- Level Strength: toggle whether touch counts are appended to each label.
- Multi-Swing Confluence: toggle, choose how many prior swings to compare against, set the matching tolerance, and set how much extra line width and which marker confluent levels get.
- Adaptive Sensitivity: enable to let ATR-based volatility scale the effective lookback automatically; adjust the ATR length and baseline length used for that comparison.
- Time Zones: enable vertical Fibonacci time markers, choose how many zones to draw, and toggle multi-color cycling versus a single accent color.
- Status Table: toggle visibility and choose its screen position.
Set alerts using "Any alert() function call" on this indicator to receive all per-level, Golden Pocket, and roll-up alerts, or use the named alert conditions in the Alert dialog if you only want a subset.
IMPORTANT NOTES AND LIMITATIONS
- Repainting: this script can repaint on the most recent, unconfirmed swing. Because a fractal only confirms after the Delay setting's worth of bars closes, the swing high/low anchors — and therefore every level drawn from them — can still shift on the last few bars until the current fractal fully confirms. Once a swing has confirmed and the trend has flipped, that swing's levels are fixed and will not repaint further. Increasing Delay reduces how often this happens, at the cost of reacting more slowly to fresh swings. Please account for this when reading the most recent levels on the chart, and avoid relying on unconfirmed levels for time-sensitive decisions.
- This tool identifies swing structure and Fibonacci confluence; it does not forecast direction, does not manage risk, and does not constitute a complete trading system on its own. It is intended to be used as one input alongside your own analysis, risk management, and market context.
- Touch counts and the confluence marker describe historical interaction with a level on this chart; they are not a probability estimate and do not guarantee how price will react at that level going forward.
- As with any lookback-based tool, results and appearance will vary by symbol, timeframe, and the Period/Delay settings chosen. Please test on your own instruments and timeframes before relying on it.
DISCLAIMER
This script is provided for educational and informational purposes only and does not constitute financial advice. Trading involves substantial risk of loss and is not suitable for every investor. Past behavior of any indicator, including this one, is not indicative of future results. Always do your own research and consider your own risk tolerance before making any trading decisions. อินดิเคเตอร์

Bollinger-Fibonacci Trend Extension [MarkitTick]💡 This tool automates the identification of three-point corrective price structures (A-B-C swings) and projects a suite of Fibonacci-based extension targets from them, filtered through a Bollinger Band mean-reversion confirmation layer and an optional trend-strength gate. Rather than requiring a trader to manually draw retracement/extension tools every time price forms a pullback, the script continuously scans pivot structure in real time, validates the geometry of each swing against strict corrective-wave rules, and projects a set of forward-looking price zones — including a shaded "Golden Zone" between the 1.5 and 1.618 extensions — the moment a qualifying structure is confirmed.
✨ Originality and Utility
Fibonacci extension tools are common on TradingView, but most require manual anchor placement on every swing and provide no objective criteria for which swings are valid setups. This script closes that gap by fully automating structure detection: it runs a custom zigzag engine with a significance threshold (ATR-based or percentage-based) to filter noise, then validates any three consecutive pivots against explicit corrective-structure rules (alternating high/low sequence, with the C-point required to retrace between the A and B extremes) before it will draw anything.
Two independent confirmation layers are stacked on top of raw structure detection: a Bollinger Band basis-cross filter that requires price to be trading on the correct side of its short-term mean before a new structure is accepted, and an optional ADX/DMI filter that suppresses structures formed during low directional-strength conditions. A configurable "adaptive filter" further lets traders pre-smooth the high/low series feeding the pivot engine using one of eight smoothing methods — including a Kalman filter and an LLAMA (linear-regression-slope-adjusted moving average) implementation — before pivots are ever detected, changing the sensitivity and lag characteristics of what counts as a swing point. The combination of automated, rule-based structure validation, dual confirmation filters, and selectable pre-smoothing is what differentiates this from a static or manually-drawn extension tool.
🔬 Methodology and Concepts
• Adaptive Pivot Detection
The script identifies swing highs and lows using a symmetric lookback/lookforward window (the "Pivot Lookback Depth" input): a bar qualifies as a pivot high only if no other bar within that window on either side has a higher value, and analogously for pivot lows. Traders can choose to feed this detection engine either raw high/low price or a smoothed version of it via the Adaptive Filter setting. Available smoothing methods include standard SMA, EMA, and RMA; a Double WMA (a WMA applied twice in succession, sharpening lag reduction); a Triple VWMA (volume-weighted MA applied three times); HMA (Hull Moving Average); LLAMA, a custom method that adds a linear slope projection (calculated from the change in price over the lookback window) on top of a simple average; and a lightweight Kalman filter that recursively updates a state estimate based on a fixed process/measurement noise ratio. Smoothing the pivot source changes which swings register as significant, effectively tuning the sensitivity of the whole structure-detection pipeline.
• Significance Threshold
Not every alternating high/low pair is kept — a new pivot only replaces the prior point of the same type, or is added as a new leg, if it clears a minimum distance threshold from the last opposite-type point. This threshold can be set as a multiple of ATR (Average True Range, over a configurable period) or as a fixed percentage of the current close, letting the sensitivity of the zigzag scale with volatility or stay fixed in percentage terms.
• A-B-C Structure Validation
Once at least three qualifying zigzag points exist, the script inspects the most recent three (A, B, C) to determine whether they form a valid corrective structure. A bullish setup requires the sequence low → high → low (A is a low, B a high, C a low), with the additional geometric constraint that point C must close above point A but below point B — meaning the pullback from B did not fully retrace into new lows and did not exceed the origin of the move. The bearish case is the mirror image (high → low → high, with C bounded between A and B). Structures that don't satisfy these geometric constraints are rejected outright; the script will not draw a structure from just any three consecutive swings.
• Bollinger Band Confirmation Filter
When enabled, a newly detected A-B-C structure is only accepted if the prior confirmed close is positioned correctly relative to the Bollinger Band basis (an SMA of price, with upper/lower bands built from standard deviation multiples): bullish structures require the close to be above the basis, bearish structures require it to be below. This filters out structures forming against the prevailing short-term mean, reducing the incidence of countertrend triggers.
• ADX/DMI Trend-Strength Filter (optional)
When the ADX filter is enabled, new structures are only confirmed if the ADX value (calculated from the Directional Movement Index over a configurable length) meets or exceeds a user-defined threshold. This is intended to suppress structure formation during ranging, low-momentum conditions where corrective patterns are statistically less reliable.
• Fibonacci Extension Projection
Once a structure is confirmed, the script projects forward price targets from the A-B-C swing using the standard extension formula: target = C + ((B − A) × ratio). An optional logarithmic-scale calculation is available, which performs the equivalent projection in log-price space before converting back — useful on instruments or timeframes where percentage moves are more meaningful than absolute point moves. Selectable extension ratios include 0.618, 1.000, 1.272, and 1.618, each independently toggleable, plus a fixed internal 1.5 ratio used only to bound the shaded "Golden Zone." Each level is optionally annotated with a loose Elliott Wave association label (e.g., the 1.618 level is labeled "Wave 3") purely as a descriptive reference point for traders familiar with that framework — the script does not perform full Elliott Wave counting or degree analysis.
• Structure Invalidation
Active structures are continuously monitored: a bullish structure is invalidated if the close trades back below point A, and a bearish structure is invalidated if the close trades back above point A. This uses the point-A extreme as a structural stop level, consistent with the idea that a valid corrective pattern should not be revisited past its origin. On invalidation, the trader can choose to have the structure's drawings grayed out in place (to preserve chart history) or fully deleted.
🎨 Visual Guide
Gold and blue lines plotted directly on price represent the Bollinger Bands: the basis (gold, an SMA of price) and the upper/lower bands (blue, basis ± a standard-deviation multiple). These can be hidden independently of the confirmation filter itself.
Solid colored lines connect point A to point B, and dashed colored lines connect point B to point C, forming the visual "A-B-C" skeleton of each detected structure. Color reflects direction: the Bullish Structure Color for up-setups and the Bearish Structure Color for down-setups (both user-configurable, default green/red).
Small labeled tags marked "A," "B," and "C" are placed at each swing point, color-matched to the structure's direction, with their vertical orientation (label above or below price) automatically flipped depending on whether the point is a high or a low.
Dotted horizontal lines extending from point C represent each active Fibonacci extension level (0.618, 1.000, 1.272, 1.618, as enabled). The 1.618 level is rendered as a solid line rather than dotted, distinguishing it as the primary extension target. Each line carries a right-aligned label showing the ratio, its optional Elliott Wave tag, and the exact price level.
A shaded rectangular zone between the 1.5 and 1.618 extension levels — tinted in the structure's directional color — marks the "Golden Zone," a commonly-referenced confluence area for potential reversals or profit-taking, with a "Golden Zone" text label at its midpoint.
When a structure is invalidated and the "Gray Out" invalidation action is selected, all of the above elements (lines, labels, the zone fill) desaturate to the Invalidated Structure Color, visually distinguishing historical, no-longer-valid structures from the currently active one without removing them from the chart.
An on-chart dashboard (top-right by default, repositionable) displays: the current symbol and timeframe, an overall directional Bias read from the most recent structure, the current ATR value, the active significance threshold in price terms, a visual bar-gauge showing how many structures are currently tracked relative to the configured maximum, the pass/block state of the Bollinger Band filter, the live ADX reading and pass/fail state, the selected Adaptive Filter method, and a log of the last structural event (new bullish/bearish structure, or bullish/bearish invalidation).
📖 How to Use
Wait for a complete A-B-C structure to be drawn and confirmed — the script only finalizes structures on confirmed bar closes, so no signal will repaint intrabar.
A newly confirmed bullish structure (green by default) suggests the recent pullback (B to C) may extend toward the plotted Fibonacci levels; the 1.618 extension and the shaded Golden Zone are commonly treated as primary target/reaction areas.
A newly confirmed bearish structure works symmetrically to the downside.
Point A acts as the structural invalidation level: if price closes back through point A against the direction of the setup, treat the structure as void — the script will automatically flag this via graying-out or deletion, along with a dashboard "Last Event" update and an optional alert.
Use the Bollinger Band filter to avoid structures forming against the short-term mean, and the ADX filter to avoid trading corrective setups during flat, low-momentum conditions.
The dashboard's Bias, Threshold, and filter-status rows are designed to be checked at a glance before acting on any newly drawn structure.
Built-in alerts are available for new bullish/bearish structures and for bullish/bearish invalidations, each firing a JSON-formatted payload (ticker, timeframe, direction, entry, TP, SL) suitable for direct use with webhook-based automation, with the action keywords for each alert type fully customizable in the Alerts group.
⚙️ Inputs and Settings
Pivot Lookback Depth — the number of bars checked on each side of a candidate bar when detecting swing highs/lows. Larger values produce fewer, more significant pivots and slower reaction time; smaller values increase sensitivity and structure frequency.
Use ATR-Based Threshold / ATR Period / ATR Multiplier — when enabled, the minimum move required to register a new zigzag leg scales with recent volatility (ATR × multiplier) rather than a fixed percentage.
Fixed Deviation % — used instead of the ATR threshold when ATR-based thresholding is disabled; sets the minimum percentage move required between opposite-type pivots.
Enable Structure Invalidation — toggles whether structures are automatically invalidated when price closes back through point A.
Keep Last N Structures — caps how many structures remain tracked/drawn simultaneously; older structures are cleaned up once the cap is exceeded.
Enable BB Confirmation Filter / BB Length / BB StdDev Mult — controls the Bollinger Band basis-cross requirement for new structures, and the parameters of the underlying Bollinger Band calculation.
Use ADX Filter / ADX Threshold / ADX Length — controls the optional trend-strength gate and its calculation parameters.
Adaptive Filter / Adaptive Filter Length — selects the smoothing method (if any) applied to the high/low series before pivot detection, and its lookback length.
Invalidation Action — choose whether invalidated structures are grayed out in place or deleted from the chart.
Show Bollinger Bands / Use Logarithmic Scale — visual toggle for the BB plots, and whether extension targets are computed in log-price space.
Show 0.618 / 1.000 / 1.272 / 1.618 Level — independently toggle each Fibonacci extension line.
Extend Lines Right — extends extension lines indefinitely to the right instead of stopping at the current bar.
Show A-B-C Labels / Show Structure Lines / Show Elliott Wave Labels — independent visibility toggles for each drawing category.
Show Dashboard / Position — toggles the on-chart dashboard table and sets its screen corner.
Alert action fields (Open Long/Short, Close Long/Short) — customizable text keywords embedded in the JSON alert payloads, matching the syntax expected by the trader's automation/webhook setup.
Enable Test Alert — fires a payload on every confirmed bar close, intended only for verifying webhook routing before disabling it.
Color inputs — full control over structure colors, label backgrounds, invalidated-structure color, Bollinger Band plot colors, and dashboard styling.
🔍 Deconstruction of the Underlying Scientific and Academic Framework
The script's structural core rests on the concept of a zigzag transformation, a standard technique in technical analysis for reducing noisy price series into a simplified sequence of significant turning points, filtered here by a volatility-normalized (ATR-scaled) or percentage-based significance threshold rather than a fixed tick count — a design choice that keeps the sensitivity of the transformation consistent across instruments and volatility regimes.
The A-B-C labeling convention and the specific extension ratios offered (0.618, 1.000, 1.272, 1.618) draw on the Fibonacci sequence and its derived ratios, which have a long history of application in corrective-wave analysis, most notably within Elliott Wave Theory and W.D. Gann's work on proportional price projections. The mathematical basis is the golden ratio (φ ≈ 1.618) and its reciprocal/power relationships, which recur in the ratios above; their use in this script is descriptive and pattern-based rather than derived from any claim of causal market structure — the script projects targets from these ratios but does not assert that price is mechanically obligated to reach them.
The optional Bollinger Band filter is grounded in the standard statistical definition of a Bollinger Band: a moving-average basis with bands set at a multiple of the rolling standard deviation, functioning here as a simple mean-reversion/trend-context gate rather than a full volatility-breakout system.
The ADX/DMI filter derives from Welles Wilder's Directional Movement System, which measures trend strength independently of trend direction by comparing the magnitude of directional price movement to overall volatility (true range) over a smoothing period; using it as a pre-condition for structure confirmation is consistent with its original design purpose of distinguishing trending from non-trending regimes.
The adaptive smoothing options span several distinct estimation philosophies: SMA/EMA/RMA represent classical fixed- and exponentially-weighted moving averages; the Double WMA and Triple VWMA apply cascaded weighted/volume-weighted averaging to reduce lag at the cost of some smoothness; HMA (Hull Moving Average) is a weighted-average construction specifically designed to reduce lag while preserving smoothness; the Kalman filter implementation applies a simplified recursive Bayesian estimation approach (balancing a process-noise and measurement-noise ratio to continuously re-weight new observations against the prior estimate), a technique originally developed for state estimation in control systems and adapted here for price smoothing; and the LLAMA method combines a simple average with a linear slope term derived from the net change in price over the lookback window, a basic linear-regression-style adjustment for trend drift.
⚠️ Disclaimer
All provided scripts and indicators are strictly for educational exploration and must not be interpreted as financial advice or a recommendation to execute trades. We expressly disclaim all liability for any financial losses or damages that may result, directly or indirectly, from the reliance on or application of these tools. Market participation carries inherent risk where past performance never guarantees future returns, leaving all investment decisions and due diligence solely at your own discretion. อินดิเคเตอร์

Fibonacci Retracement [AFD]Fibonacci levels that find their own two points, and keep finding them.
THE PROBLEM WITH DRAWING THEM BY HAND
A retracement is two clicks and a judgement call. The judgement is the hard part - which high, which low, and whether the leg you just measured is one move or two glued together. Then the session rolls over and the answer changes, so you do it again.
This draws the grid from the chart's own data instead. You tell it which range matters and it finds the two points itself, every bar, forever. Come back after the open and it has already re-anchored to the new day.
PICKING THE RANGE
Four choices, and they are all self-maintaining.
Current Day is the default and it is the one most intraday traders want - today's high and low, re-anchoring at each session open. Previous Day is yesterday's, and it draws from yesterday's start rather than today's, so the geometry sits over the data it came from. Current Week is the same idea one period up.
Latest Swing is the interesting one. It takes the last confirmed swing high and low, and it insists they alternate.
That insistence matters more than it sounds. ta.pivothigh() and ta.pivotlow() are independent detectors, and a real chart prints two, three, four highs in a row with no qualifying low between them. Take the most recent of each and you get a "leg" whose high end is simply the latest high, not the highest one in the span - so the grid measures a move that never happened as a single push, and 0.618 lands somewhere with no relationship to anything. Here, a pivot on the same side as the last one replaces it only if it is more extreme, and a pivot on the opposite side starts the next leg. On clean impulses this changes nothing at all. On ragged ones it pulls the anchor back to the extreme the leg actually reached.
Swing Strength sets how many bars have to print either side of a pivot before it counts. Higher means fewer and more significant swings, and a longer wait.
WHICH WAY THE LEG RUNS
Fib Direction is Auto, Long or Short, and it is the one control that stays live no matter what else you switch off - because it governs both grids, not just the near one.
Auto works out the direction from the range you actually chose. It looks at the two extremes that range uses and puts 0.00 at whichever one printed later, on the reasoning that the more recent extreme is the one the move ended on. So on Current Day, a day that made its low at 10:15 and its high at 15:50 gets 0.00 at the high and a grid you read downwards. Force it with Long or Short when you disagree.
THE MINUS SIGN, AND WHY THE EXTENSIONS HAVE ONE
Everything on this chart is numbered from the leg end. 0.00 sits at the recent extreme that finished the move, 1.00 at the point it started from. That way the number you read is retracement depth, and it means the same thing whichever direction the leg ran.
The extensions continue that same line past 0.00, which is why they are negative. -0.618 sits 0.618 of the leg's range beyond the 0.00 line, in the direction the leg was travelling - exactly the way 0.618 sits 0.618 of the range on the other side of it. One ruler, and the sign tells you which side of the origin you are on.
If that looks unfamiliar, put TradingView's own Fib Retracement tool on the same two points. Its tags read the same: -0.618, not 1.618. The 1.618 reading belongs to the Trend-Based Fib Extension tool, which measures from the leg origin instead - a perfectly good convention, but putting both on one chart gives you two rulers running opposite directions from the same 1.00 line, and sooner or later you read the wrong one.
Six ratios are on offer - -0.272, -0.414, -0.618, -1.00, -1.618, -3.236 - and they ship switched off. They are levels, not targets. They are arithmetic on the leg. This script says nothing about whether price gets to one, marks no entry or exit, and has no alerts of any kind.
THE SECOND GRID
Switch on Show HTF Context and a second grid draws behind the first, anchored to the latest confirmed swing on a higher timeframe and dimmed so it stays context rather than competing for your attention. It ships off, so a fresh add gives you one clean grid.
HTF Mode is where this differs from most higher-timeframe overlays. Adaptive , the default, does not hold a fixed interval - it takes the next one up from whatever chart you are on. A 5-minute chart anchors to the 15-minute swing, a 1-hour chart to the 4-hour. Change timeframe and it follows you, and because it always resolves to something strictly higher, it cannot silently resolve to nothing.
Custom lets you name the timeframe instead, which is what you want when a specific one matters - the 4-hour swing while you scalp the 5, say. The catch is that it has to be strictly higher than the chart. Set Custom to 240 and drop to a 4-hour chart and the grid disappears with no warning label, because 240 is not higher than 240.
Both grids keep their own level checkboxes, line width, label size and text colour, so you can make the context layer as quiet as you like. The extension ratios are the exception: which ratios get drawn is shared by both grids, while which grids draw them is not. Each layer has its own extension toggle. The tooltips say which is which, because a control that looks global and is not is worse than one that plainly is.
THE SETTINGS ACTUALLY WORTH YOUR TIME
Most of the 63 inputs are the ordinary colour-and-width kind. These are the ones that change how the thing reads.
Color Mode defaults to Gradient, and it is doing real work. Each level takes its colour from its own ratio, so hue states depth - the shallow end and the deep end are different colours, and the 0.618-0.786 span reads as a region instead of two more identical lines. There are five presets plus Custom. Single Color reverts to one colour per grid if you prefer the classic look, and either way whatever transparency you pick in the colour picker is the transparency you get.
Enable Glow draws every level twice - a wide, near-transparent halo under a thin bright core. It costs nothing but line objects and it is the difference between a grid you can see on a busy chart and a set of hairlines you lose against the candles. Turn it off when the chart is crowded.
Fill Between Levels shades the intervals. OTE Band, the default, shades only 0.618-0.786. All Bands shades everything, Custom Bands lets you pick, and Off is off. The fills are independent of the line checkboxes, so you can shade a band whose boundary lines are hidden.
Highlight Golden Zone at Price is the one piece of reactive styling here. While the last close is between the 0.618 and 0.786 prices, that band draws more opaque and lifts off the chart. It creates nothing new - no box, no zone object, no centre line, no label - it just restyles the band the fill control already drew, and Highlight Strength sets by how much. It is arithmetic on two numbers already on your screen.
HTF Layer Dimming adds transparency to the whole context grid on top of whatever its colours already carry, which is how the second grid stays behind the first instead of doubling the clutter.
Extension Fade fades each extension a little further as it travels away from the leg, so the near ones read as more prominent than the far ones. It counts only the extensions you actually enabled, not their slot in the ladder - so if you turn on just the far ones, the nearest of them is still drawn at full strength rather than arriving pre-dimmed.
Ratio Label Format switches the tags between decimal and percent - 0.618 or 61.8%, minus signs intact either way. Show Price Labels adds the actual price beside each ratio; it is off by default because eight prices is a lot of text.
Line Extension Left/Right and Label Right Offset control how far the grid reaches and how far past it the tags sit. The defaults keep the tags in the empty margin, clear of both the candles and the price scale.
One last thing: any control that cannot do anything greys itself out. Switch the context grid off and its settings dim. Switch to Gradient and the single-colour pickers dim. There is no control in this script that looks live, takes a value, and quietly does nothing.
GETTING STARTED
Add it. You get one grid on today's range, gradient-coloured, golden zone shaded.
Want a different range? Anchor Range. Leave Fib Direction on Auto until it tells you something you disagree with.
Want context from above? Show HTF Context, and leave HTF Mode on Adaptive unless a specific timeframe matters to you.
Want the extensions? Turn them on for whichever grid you want them on, then pick your ratios.
Too busy? Glow off, Fill Between Levels off. You are back to plain lines.
THINGS THAT WILL LOOK LIKE BUGS AND ARE NOT
Swing anchors arrive late. A pivot is not a pivot until Swing Strength bars have printed after it, so on Latest Swing and on the context grid you are always looking at the last confirmed pivot, not the bar in front of you. When a newer one confirms, the anchor moves. That is the price of anchoring to something you can only recognise in hindsight, and it is the same trade every swing-based tool makes.
The day and week ranges are live. Current Day and Current Week use the period's running high and low, so the grid re-scales when the session makes a new extreme. It is showing you the range as it stands, not a finished one.
It draws one grid, not a history of them. You get the current grid, redrawn as things move. There is no trail of old ones behind you.
Higher-timeframe data uses the documented confirmed-value form - the expression is offset by one bar and the request passes barmerge.lookahead_on. Together, that is the pattern the Pine Script documentation gives for reading a higher timeframe without pulling unclosed data into historical bars. The source is open, so you can read the call rather than take my word for it.
Custom HTF at or below the chart timeframe draws nothing at all , and says nothing about it. Worth remembering before you conclude the context layer is broken.
A 12-month chart draws no context grid. 12M is the top of TradingView's interval list, so Adaptive has nothing left to step up to. 3-month and 6-month charts both work.
Prices come from standard OHLC via ticker.standard(), so your levels are the same on Heikin Ashi, Renko, Kagi, Line Break and Point and Figure as they are on candles. The synthetic geometry of those chart types can still put the lines somewhere you would not expect.
WHAT IT DELIBERATELY DOES NOT DO
No alerts. No signals. No scores, ratings or probabilities. No zones, no nested zones, no centre line. It draws Fibonacci levels, labels them honestly, and stops. If you want something that tells you when to act, this is not it.
WHY IT IS DIFFERENT
Four self-maintaining ranges instead of a two-point drag you place today and replace tomorrow. Two independently configured grids on one continuous number line, with the higher one dimmed to sit behind rather than on top. Extensions numbered on the same ruler as the retracements, matching the tags TradingView's own tool gives those prices, rather than a second scale running the other way. A swing range that is genuinely one leg, because the pivot pair is kept alternating. And colour that carries information - a level's hue states its depth - instead of a palette applied to identical lines.
Open source under the Mozilla Public License 2.0. อินดิเคเตอร์

Fibonacci A-B-C Volles Strategie-Board(ENGLISH)
---
The Fibonacci Betting-Playbook 062026: How to read the Strategy Board
If you want to succeed in the markets, you need more than just a gut feeling, you need a system that delivers crystal-clear odds. This script is your personal bookmaker dashboard directly on the chart. It scans price movements for a highly profitable pattern and shows you exactly when the risk-reward ratio is as good as a massively overpriced underdog quote in La Liga.
Here is the official manual for you and your users, so that everyone knows exactly how to read the signals and when it's better to keep your feet still.
The Game Plan: The A-B-C Formation
In the background, the script constantly scans for a specific market movement, the so-called A-B-C ZigZag. Think of it like the perfect set piece:
Point A (The Kickoff): The lowest point where the movement begins.
Point B (The First Goal): The first high point. The momentum is here.
Point C (The Tactical Pause): The price drops back slightly. Exactly here, in this pullback, we calculate our entry before the second half – the next big price breakout – begins.
As soon as the script recognizes this formation, it paints your playing field (the boxes) onto the chart.
Your Betting Odds: The Zones on the Board
When the setup is "hot", you will see two distinct boxes on your screen. They take the guesswork out of the equation and tell you exactly where you need to place your chips.
🟢 The Green Zone: The Entry (The Value Bets)
Here is where you build your position. If the price falls into this box, we have a statistical advantage (edge).
Line 0.500 (Initial Entry): The market has corrected half of its rally. Here you place your first, smaller bet.
Line 0.618 (Ideal Reload): This is the "Golden Ratio". The absolute sweet spot in the Fibonacci system. If the price drops here, you double down. The chance of a bounce is highest here.
Line 0.667 (The Last Bastion / STOP): The red dashed line. If the price falls below this, the setup is busted. The trade is canceled, you pull the ripcord, and accept the small loss. No hoping, no praying – strict bankroll management.
🟠 The Orange Zone: The Cashout (Taking Profits)
If the trade plays out and the price shoots up, this box shows you where the bookie opens the register.
Line 1.618 (Potential Turning Point): Your first target (Take Profit 1). Here you take a portion of your winnings off the table. Ring the register!
Line 1.809 (Trailing Stop-Loss): The price keeps running? Perfect. Trail your stop-loss to your entry price now. You are now riding a risk-free bet.
Line 2.000 (Massive Resistance): The absolute maximum. The air gets extremely thin up here. Take your remaining profit and close the position.
🔴 The VAR Signal: The Red Warning Box
Markets are often chaotic. If the script fails to recognize a clear A-B-C pattern, the stop-loss has been hit, or the target has already been reached, the system immediately deletes all lines from the chart.
Instead, a red box appears in the center: "CURRENTLY NO RECOMMENDATION POSSIBLE - WAIT FOR FURTHER CHART SIGNALS".
This is like a suspended betting market during a VAR check. Your only task at this moment: Do not trade. Keep your hands off the buy button. Wait patiently until the system builds the next profitable setup.
What you as a user must absolutely pay attention to (The Golden Rules)
Patience is your best croupier: Do not trade blindly just because the price is moving. Always wait until the boxes appear on the chart and the price dips into the green zone.
Respect the Stop-Loss (0.667): Even in the best Spanish casinos, you don't win every hand. If the red line is breached, close the trade on Trade Republic immediately. Whoever hesitates here gambles away their bankroll.
Split your stakes: Do not wager your entire capital at the 0.500 line. Make a partial entry and keep your powder dry in case the price drops to the golden 0.618 line. This massively improves your average entry price.
Secure your profits: When the price reaches the orange 1.618 line, do not get greedy. Take a partial profit. Nothing is more frustrating than turning a fat paper profit back into a loss.
อินดิเคเตอร์

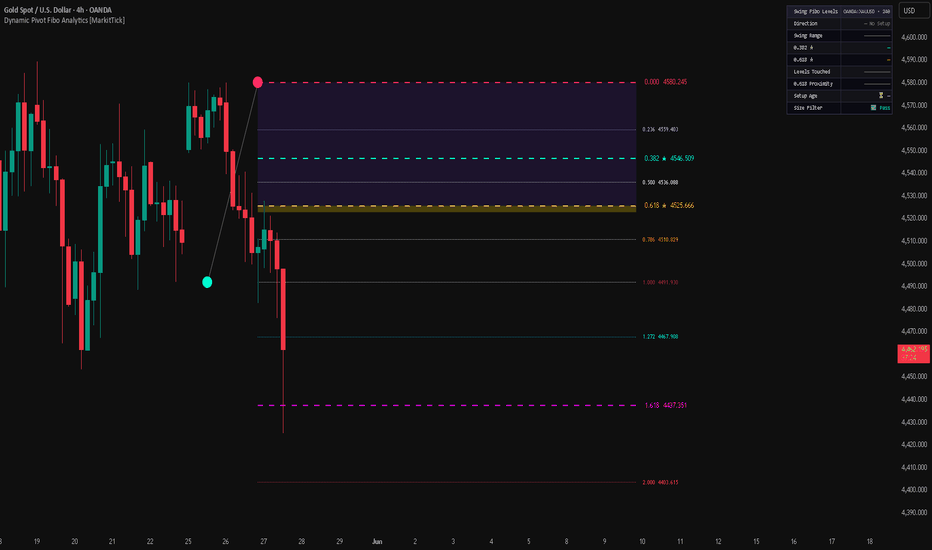
Dynamic Pivot Fibo Analytics [MarkitTick]💡 A highly advanced, automated technical analysis tool designed to objectively identify structural market swings and project key Fibonacci retracement and extension levels. By isolating mathematically confirmed pivot highs and lows, the algorithm eliminates the subjective bias traditionally associated with drawing retracement tools manually. The script dynamically maps out critical zones of interest—such as the widely observed Golden Pocket—while continuously evaluating the current price action against these historical vectors. Coupled with a real-time analytical dashboard, it provides traders with a comprehensive breakdown of swing volatility, level proximity, and directional bias, serving as a complete ecosystem for retracement-based methodologies.
✨ Originality and Utility
The primary utility of this script lies in its capacity to transform a traditionally manual and subjective charting process into an automated, mathematically rigorous system. While standard charting platforms require users to manually select anchor points for Fibonacci tools—often leading to inconsistent application—this script programmatically identifies the most statistically relevant extremums based on user-defined lookback periods.
Its originality is further highlighted by its multi-layered filtering architecture. Rather than treating every minor price fluctuation as a valid swing, the script incorporates an objective volatility filter utilizing either the Average True Range (ATR) or a strict percentage threshold. This ensures that only structurally significant market movements are measured, effectively filtering out stochastic market noise. Furthermore, the integration of an on-chart analytical dashboard and a dynamic level-touch highlighting system brings a level of interactive feedback rarely seen in standard visualization tools, allowing traders to instantly gauge the health and maturity of an active swing.
🔬 Methodology and Concepts
● Pivot Extrema Detection
The foundational logic relies on the identification of local minimums and maximums within a continuous time-series dataset. The algorithm evaluates a central candidate bar against a defined window of preceding and succeeding bars. A Pivot High is only confirmed if the candidate's high remains unbreached across the entire evaluation window, ensuring it represents a true structural peak. This mechanism inherently requires a confirmation delay to validate the peak, preventing the erratic shifting of anchors during live price formation.
● Swing Filtering and Validation
Once opposing pivot points are confirmed, the script calculates the absolute price range of the resulting swing. To prevent false positives in low-volatility environments, the script applies a normalization filter. It evaluates the raw swing range against either a fractional multiplier of the current ATR or a static percentage of the asset's price. Swings failing to meet this geometric threshold are automatically discarded, preserving chart clarity.
● Fibonacci Mathematics and Zonal Mapping
Upon validating a swing, the algorithm applies standard Fibonacci sequence ratios to the defined price vector. It calculates core retracements (0.236, 0.382, 0.500, 0.618, 0.786) and projects mathematical extensions (1.272, 1.618, 2.000) for target mapping. The script specifically isolates the 0.618 to 0.650 region, commonly referred to as the Golden Pocket, rendering it as a distinct filled zone to highlight its historical significance as an area of mean reversion.
🎨 Visual Guide
● Main Chart Elements
Swing Line: A distinct, solid line directly connecting the anchored Pivot Low and Pivot High, visually defining the active vector being measured.
0.000 and 1.000 Anchors: The baseline extremums of the swing, marked by precise labels and dashed/dotted lines to indicate the absolute boundaries of the measured range.
Key Retracement Levels (0.382 & 0.618): Rendered with emphasized, dashed lines to denote their elevated importance in traditional retracement theory. The 0.618 level utilizes a distinct gold color to draw the user's attention.
Minor Retracement Levels (0.236, 0.500, 0.786): Displayed using subtle, dotted lines to provide contextual support without overwhelming the primary visual hierarchy.
Golden Pocket Fill: A translucent shaded region spanning the area between the 0.618 and 0.650 price coordinates, serving as a primary zone of interest for exhaustion.
Touch Highlights: When the current price intersects any active Fibonacci line, the line's color dynamically shifts (defaulting to white), providing immediate visual feedback of level interaction.
Historical Swings: If enabled, the script retains ghosted, dotted representations of previously confirmed swings, allowing users to analyze past interactions without cluttering the active setup.
● Dashboard Elements
Direction: A color-coded textual readout confirming whether the active, validated swing is Bullish or Bearish.
Swing Range: A visual block-bar representation (scaling from 0 to 10) evaluating the magnitude of the current swing relative to the prevailing ATR.
Key Levels: Direct, high-precision price readouts for the critical 0.382 and 0.618 levels.
Levels Touched: A scoring metric visualizing how many individual Fibonacci levels the current price action has interacted with since the setup was confirmed.
0.618 Proximity: A dynamic strength bar indicating how close the current price is to the Golden Ratio, aiding in the anticipation of level tests.
Setup Age: A raw bar-count indicating the duration since the swing anchor was established.
📖 How to Use
Setup Identification: Apply the script to your chart and observe the automated generation of the Swing Line. The script will wait for the defined lookback period to confirm a pivot before drawing the corresponding Fibonacci grid.
Trend Context: Use the Dashboard to immediately confirm the direction and strength of the swing. A high Swing Range score indicates a robust structural move, lending higher confidence to the subsequent retracement levels.
Zone Monitoring: Focus attention on the highlighted Golden Pocket zone. As price retraces into this filled area, monitor for deceleration or reversal patterns. The built-in proximity score on the dashboard will alert you as price nears this critical threshold.
Interaction Feedback: Watch for the dynamic Touch Highlights. When a level changes color, it confirms that price has officially probed that mathematical coordinate.
Alert Automation: Instead of manually monitoring the chart, configure the script's alert parameters to notify you strictly when price touches a key level (such as the 0.382 or 0.618), streamlining your analytical workflow.
⚙️ Inputs and Settings
Swing Settings: Controls the structural strictness of the algorithm. Adjusting the "Left Bars" alters the required validation period for a pivot, while "Extend Lines" controls the horizontal projection length of the drawn levels.
Swing Filter: Toggles the volatility validation on or off. Users can select between an "ATR" multiplier or a pure "Percent" requirement, establishing the minimum acceptable size for a swing to be plotted.
Direction Filter: Allows the user to isolate the script's output to strictly Long setups, strictly Short setups, or Both simultaneously.
Fib Extensions & Golden Pocket: Provides granular control over the visibility and aesthetic rendering of the >1.000 extension levels and the specialized 0.618-0.650 fill zone.
Level Touch Alerts: Configuration options for automating notifications. Users can toggle alerts for specific key levels, all levels collectively, and customize the visual highlight color triggered by these interactions.
Historical Swings: Defines the quantity of past setups to retain on the chart for retrospective analysis.
Dashboard Settings: Customization parameters for the analytical table's background and text colors to ensure readability across different chart themes.
🔍 Deconstruction of the Underlying Scientific and Academic Framework
The theoretical foundation of this script intersects two distinct disciplines of market analysis: algorithmic extremum detection and geometric proportion analysis.
The extremum detection relies on a localized peak-trough evaluation algorithm. By isolating a data point and verifying that its scalar value is strictly greater than (or less than) all corresponding values within a symmetric `n`-period domain, the script establishes a mathematically unassailable structural node. This method effectively filters out continuous monotonic sequences and isolates true inflection points in the time-series data.
To prevent the algorithm from validating micro-fluctuations inherent in random walk market environments, it employs a normalization technique using Average True Range (ATR). ATR provides a dynamic measure of standard deviation over time. By forcing the absolute scalar difference between two validated extremums to exceed a fractional coefficient of the ATR, the script ensures that the analyzed vector falls outside the bounds of standard market noise, thereby validating its statistical significance.
Once the vector is established, the script applies the principles of the Fibonacci sequence—a recursive mathematical progression where the ratio of successive terms converges on Phi (approximately 1.618). In the context of market dynamics, these ratios (particularly their inverses and square roots, such as 0.618 and 0.382) have been empirically observed to act as psychological focal points for mass market behavior. The script translates these geometric proportions into static coordinate thresholds, creating a structured, grid-based framework for evaluating the amplitude and potential exhaustion points of counter-trend market phases.
⚠️ Disclaimer
All provided scripts and indicators are strictly for educational exploration and must not be interpreted as financial advice or a recommendation to execute trades. I expressly disclaim all liability for any financial losses or damages that may result, directly or indirectly, from the reliance on or application of these tools. Market participation carries inherent risk where past performance never guarantees future returns, leaving all investment decisions and due diligence solely at your own discretion. อินดิเคเตอร์
SMC Liquidity Sweep & Fibonacci Extension [MarkitTick]💡 A highly advanced, multi-faceted chart overlay engineered to synchronize market structure analysis, dynamic liquidity tracking, and harmonic Fibonacci projections. By continuously parsing raw price action through a confluence-based scoring system, this indicator provides technical analysts with a unified framework for identifying localized structural shifts, mapping premium and discount pricing zones, and projecting precise forward targets using automated ABC ZigZag structures. It functions as a complete technical environment designed to remove the need for multiple disparate chart overlays.
✨ Originality and Utility
Standard indicators often focus on a single mathematical concept, leaving the analyst to manually stitch together multiple tools to form a cohesive thesis.
This script completely breaks that mold by merging a rigorous market structure shift (MSS) engine with an adaptive, volatility-adjusted Fibonacci structure mapper.
It introduces a highly original dynamic confluence scoring system that grades current setups in real-time based on higher timeframe (HTF) alignment, session timing, and liquidity events.
The inclusion of ATR-adaptive stop losses, order block mitigation tracking, and full webhook alert integration makes it an exceptionally utilitarian system for both discretionary chart analysis and automated alert routing.
Rather than cluttering the screen with infinite historical data, the indicator utilizes a smart-pruning engine that actively hides or greys out mitigated order blocks, filled gaps, and invalidated Fibonacci setups.
🔬 Methodology and Concepts
● Market Structure & Liquidity Engine
The script utilizes a localized loop lookback to identify significant pivot highs and lows, forming the absolute mathematical foundation of its trend analysis.
A liquidity sweep is mathematically confirmed when price pierces a previous structural pivot's extreme but fails to maintain momentum, thus confirming a reversal of localized volume.
Changes of Character (CHoCH) and Breaks of Structure (BOS) are dynamically generated and labeled when price confidently closes beyond confirmed pivot boundaries, establishing a directional bias.
● Fair Value Gaps (FVG) & Order Blocks
Fair Value Gaps are detected by comparing the extreme of the first candle to the extreme of the third candle in a three-bar sequence. If they do not overlap, a pure price imbalance zone is mathematically plotted.
Order Blocks are automatically mapped around the exact origin of a structural break, utilizing an Average True Range (ATR) offset to define the true boundary of the support or resistance zone.
The engine continuously tracks forward price interaction with these zones, automatically removing them from the visual field once mitigated by future price action to maintain chart clarity.
● Automated Fibonacci & ABC Structures
An internal ZigZag algorithm utilizes ATR to filter out baseline market noise, mapping only statistically significant price swings.
Once a valid three-point ABC structure is confirmed (where point C retraces but does not invalidate point A), the script automatically calculates forward projections.
Target extensions are generated using either linear geometric scaling or logarithmic interpolation, providing dynamic profit objectives that adapt to the underlying asset's volatility.
🎨 Visual Guide
● On-Chart Elements
Dashed Lines: Represent significant market structure breaks. Cyan dashed lines indicate a bullish structural shift, while magenta dashed lines indicate a bearish shift.
Text Labels: "CHoCH" or "BOS" text marks structural confirmations directly on the break line. Small yellow "IDM" labels highlight captured inducement levels within the trend.
Shaded Boxes: Cyan and magenta background boxes denote active Bullish and Bearish Fair Value Gaps. Mitigated order blocks turn deep grey if the user chooses not to hide them entirely.
Session Kill Zones: Golden transparent boxes highlight the London session volatility, bright green identifies the New York open, and deep orange maps the Asian range consolidation.
Fibonacci Projections: Dotted and solid lines extend dynamically to the right from valid ABC structures, detailing exact price targets and their associated harmonic or Elliott Wave ratios.
● Comprehensive Confluence Dashboard
Located firmly at the top right of the chart window, this panel continuously updates with the current state of the market environment.
It displays the active trend direction, an aggregate Confluence Score out of 5 (color-coded from a neutral grey to a highly confident vibrant green), and the Higher Timeframe Bias.
Additionally, it provides immediate readouts on the current Premium/Discount pricing equilibrium, the active global trading session, liquidity sweep states, and real-time ATR values.
📖 How to Use
● Trade Qualification and Scoring
Monitor the Confluence Dashboard diligently. A score of 4 or 5 strongly indicates a high-probability alignment across multiple, independent market factors.
Wait for a confirmed liquidity sweep on the chart, followed immediately by a structural break (CHoCH or BOS) that aligns in the direction of the Higher Timeframe (HTF) trend bias.
● Entry Execution and Targeting
Utilize the automatically plotted Order Blocks and Premium/Discount zone quartiles to refine entry locations. Ideal long entries statistically occur within the discount quartile of the defined range.
Set realistic profit targets using the automated Fibonacci extensions. The 1.618 level (often labeled as Wave 3) serves as a primary extended objective for momentum-based moves.
Risk management should be tied directly to the ATR-adaptive stop-loss values calculated internally by the script, ensuring your stops are placed outside the immediate noise floor of the asset.
⚙️ Inputs and Settings
● Market Structure Configuration
Swing Length: Adjusts the raw sensitivity of pivot detection. Higher numeric values create a macro structural view; lower values capture micro intraday structures.
Risk/Reward Ratio: Modifies the theoretical profit targets generated specifically for the internal webhook alert payload system.
● Filters and Environmental Zones
HTF Timeframe: Allows the selection of the specific resolution for the background trend bias filter (e.g., 240 for a 4-hour bias on a 15-minute chart).
Premium / Discount Zone: Toggles the background display of mathematical range quartiles (Premium, Equilibrium, Discount).
Session Kill Zones: Activates time-based highlighting for major global trading hours, strictly aligned to UTC.
● Fibonacci Parameters
Use Logarithmic Scale: Switches all forward projection math to logarithmic scaling, an essential setting for high-volatility assets or deep historical charts.
Structure Invalidation: Deletes or greys out active ABC structures the moment current price completely breaks below the origin point (Point A).
● Webhook Action Routing
Open Long / Short Actions: Allows the user to define exact, customized JSON payload strings to route automated signals seamlessly to third-party execution platforms.
🔍 Deconstruction of the Underlying Scientific and Academic Framework
● Pivot Extrema and Range Equilibrium Theory
The identification of market structure inherently relies on local extrema calculation. A given point is mathematically considered a pivot high if its peak value is strictly greater than all adjacent values within a defined window.
By mapping these rolling extrema over continuous time series data, the script establishes an active topological trading range.
This range is subsequently divided into exact quartiles to define Premium and Discount pricing equilibriums, rooted in mean-reversion statistical theories.
● Volatility-Adjusted Noise Filtration
The internal ZigZag algorithm utilizes the Average True Range (ATR) to establish a dynamic, mathematically sound noise floor.
ATR evaluates the moving average of absolute price differentials over time, capturing true gap volatility.
A structural swing is only validated by the algorithm if the absolute price differential exceeds a defined, user-adjustable multiple of the ATR, ensuring mathematical robustness against ranging, low-volatility environments that cause false signals in standard pivot models.
● Harmonic Projection Mechanics
Forward Fibonacci extensions are calculated using either a standard linear geometric model or a complex logarithmic scale.
In linear application, a forward target for a given expansion ratio is derived directly from an ABC configuration by extrapolating the absolute distance of the primary impulse leg.
When logarithmic scaling is applied, the mathematical relationship transforms to exponentiate the natural log of the price coordinates.
This aligns the future projections with percentage-based compounding growth models, effectively addressing price scale distortions inherently found in exponential secular trends.
⚠️ Disclaimer
All provided scripts and indicators are strictly for educational exploration and must not be interpreted as financial advice or a recommendation to execute trades. I expressly disclaim all liability for any financial losses or damages that may result, directly or indirectly, from the reliance on or application of these tools. Market participation carries inherent risk where past performance never guarantees future returns, leaving all investment decisions and due diligence solely at your own discretion. อินดิเคเตอร์

อินดิเคเตอร์

อินดิเคเตอร์

Fibonacci Confluence Grids (Levels + Time Zones) [Metrify]This script is built around a simple but often-misused idea: Fibonacci levels are only useful when the reference swing is meaningful. In practice, most traders do not fail because they “used the wrong ratio,” but because they anchored the Fib to a weak or inconsistent swing. A 0.618 level drawn from noise is still noise.
The core design of this indicator is therefore not “draw more levels” but to formalize three simple steps that we usually do inconsistently by eye:
identify an A→B swing,
filter that swing for significance, and
project both price levels and timing windows from that swing.
Once a valid swing is accepted, the script projects a configurable set of price Fibonacci levels (retracements and/or extensions) and a separate configurable sequence of time gates (bar offsets projected forward from point B). The price levels define a vertical map of potential reaction zones. The time gates define a horizontal map of potential timing windows. Used together, they create a 2D framework: not only where price may become sensitive, but also when the probability of a market event tends to increase.
Time gates: temporal structure and why “events cluster” around them
The time gate projects vertical markers forward from point B using a bar sequence (commonly Fibonacci-like). The key idea is not random, but practical timing structure.
Markets often exhibit rhythm: impulsive legs, pullbacks, consolidations, and expansions frequently have characteristic durations.
Time gates should be interpreted as attention windows: periods where you should expect the probability of a notable market event to be higher than usual. “Event” here is intentionally broad, because direction is not guaranteed:
acceleration / continuation burst
pullback completion and resumption attempt
volatility expansion after compression
reversal attempt (successful or failed)
fakeout / stop run / liquidity sweep
structural break and regime shift
This is why it’s accurate to say that significant events often occur around time gates. Not because the gate forces a reversal, but because it’s a timing checkpoint where participation and auction dynamics frequently change. Your edge comes from combining the gate with context: price location near a major Fib level, session behavior, and confirmation from price action/structure.
How to use it as a manual framework
A strong discretionary workflow is to treat this as a 2D confluence map: price zone × time window.
Start by asking: “Is the active A→B swing meaningful?” If it looks like chop, tighten filters (increase Min Size / Min Bars, or increase ZigZag reversal / pivot length). Once the swing quality is good, treat the map as a set of planned observation points.
When price approaches a major retracement (0.5/0.618/0.786) or extension (1.272/1.618), check whether a time gate is also nearby. If yes, you should expect higher information density so you watch for confirmation rather than forcing prediction.
Confirmation can be whatever your style uses: structure break, reclaim, rejection candle quality, volatility expansion, etc.
If price is mid-range (far from major fibs) and far from gates, that’s often low-quality territory for forcing trades —> your standards should be higher, not lower. อินดิเคเตอร์

ZenAlgo - ABCThis indicator identifies a three-point price structure (X, A, B) and projects proportional price levels forward from point B. It uses either automatically detected swing points or manually selected anchors and then builds a forward projection framework based on the relative movement between X and A.
1. Anchor Point Selection (X, A, B)
The script first determines three key price points that define the reference movement.
Automatic mode
When manual anchors are disabled, the indicator scans historical bars to detect local highs and lows using a fixed number of bars on the left and right side. A pivot high is confirmed only after enough future bars exist, and the same applies to pivot lows. This avoids using information that is not yet available in real time.
Detected pivots are stored in sequence:
The previous confirmed pivot becomes X
The next confirmed pivot becomes A
The most recent confirmed pivot becomes B
To avoid repeatedly using the same type of pivot, the script alternates between highs and lows. This ensures that X, A, and B always represent a swing structure instead of a flat sequence.
Manual mode
When manual anchors are enabled, the user defines three timestamps. The script captures the price and bar index at those times. After all three points are collected, the script adjusts them to represent true extremes inside their bars. Depending on direction, it replaces closes with highs or lows so that X and A form a valid swing, and B represents a corrective endpoint.
If manual anchors are incomplete, the script falls back to the automatic pivots.
2. Validation and Direction Detection
After anchors are collected, the script checks whether all three points are available. If any of them is missing, no projection is drawn.
When X, A, and B exist, the script determines the directional context:
If A is above X, the structure is treated as bullish
If A is below X, the structure is treated as bearish
The vertical distance between X and A defines the reference movement. This distance is treated as the base unit for all further projections.
This approach assumes that the impulse move from X to A represents the dominant directional leg, and that B represents a retracement or pause within that structure.
3. Projection Calculation
All projected levels are derived from the difference between X and A and are applied starting from point B.
For each predefined ratio:
In bullish structures, the distance from X to A is added upward from B
In bearish structures, the distance is subtracted downward from B
This produces a set of horizontal price levels that are proportional to the initial impulse.
No fixed price values are used. All levels scale automatically with market volatility and with the size of the X–A movement.
4. Configurable Levels and Naming
The indicator defines a list of projection ratios that represent retracement, extension, and continuation zones. Each level can be enabled or disabled and has an adjustable color and transparency.
Each level may be displayed in two ways:
As a descriptive name combined with the ratio
As a numeric ratio combined with the projected price
The naming system maps specific ratios to semantic labels such as base, entry, intermediate targets, main target, and extended continuation levels. These names are fixed in the script and reflect their relative position in the projection structure.
5. Visual Construction
On the most recent bar, the script clears all previously drawn elements and rebuilds the full structure.
It then draws:
A dashed line from X to A and from A to B to visualize the underlying swing
Labels at X, A, and B with direction-aware placement
Horizontal lines from B into the future for each enabled level
Text labels at the end of each level line
All level lines extend a configurable number of bars to the right of the current bar, creating a forward projection area.
Transparency values are fixed to maintain visual consistency and to avoid obscuring price action.
6. Zone Construction
In addition to individual lines, the script can draw shaded zones between selected pairs of levels.
These zones include:
A retracement zone between two closely spaced mid-range ratios
A target zone between the main extension levels
An extended continuation zone above or below the main target
Zones are drawn as semi-transparent rectangles from point B to the right extension limit. Their vertical boundaries are defined by the corresponding projected levels.
These zones highlight areas where price interaction with multiple proportional levels is expected.
7. Display and Update Logic
The drawing process runs only on the most recent bar. This prevents excessive historical objects and ensures that projections always reflect the latest confirmed X, A, and B.
All graphical objects are stored internally and deleted before redrawing. This avoids overlap and keeps the chart synchronized with the current structure.
8. Interpretation of Levels
The projected levels represent proportional price distances derived from the prior impulse.
They should be interpreted as:
Reference zones for potential reactions
Areas of interest for continuation or exhaustion
Context for managing existing positions
Lower ratios correspond to shallow projections near B. Higher ratios correspond to extended moves away from B.
No level represents a guaranteed support or resistance. All values are conditional on the validity of the underlying X–A–B structure.
9. Practical Usage
Typical usage follows this workflow:
Wait for the script to confirm X, A, and B
Observe whether the structure is bullish or bearish
Use projected levels as reference for planning entries, exits, and risk placement
Re-evaluate when a new pivot replaces X, A, or B
Manual anchors can be used when the user wants to enforce a specific structure that differs from the automatic pivot logic.
The indicator is designed for contextual analysis rather than standalone signal generation.
10. Limitations and Disclaimers
This indicator depends on confirmed pivots. In fast or highly volatile markets, pivot confirmation can lag, which delays projections.
Structures may be invalidated when:
Price forms new extremes before a pivot is confirmed
Market conditions change abruptly
Range-bound markets produce frequent small pivots
In such conditions, projected levels may shift frequently or lose relevance.
The method assumes that past impulse size is a meaningful reference for future movement. This assumption does not hold in all market regimes.
The indicator does not incorporate volume, order flow, trend filters, or volatility regimes. It should therefore be combined with additional analysis.
11. Relationship to Manual Fibonacci and ABC Tools
Unlike standard manual Fibonacci retracement or projection tools, this indicator does not rely on subjective anchor placement. In automatic mode, swing points are selected using a fixed pivot detection process, which enforces consistent structural rules.
Anchor points are derived from confirmed price pivots instead of manual selection
The X–A–B structure is maintained automatically as new swings form
All projection levels and zones are recalculated and redrawn dynamically
This removes the need for repeated manual adjustments when market structure changes.
Compared to typical ABC projection tools, the script formalizes the entire workflow. The selection of reference points, the construction of proportional levels, and the management of graphical objects are handled programmatically. This prevents inconsistent anchor choices, reduces user interpretation bias, and ensures that projections always reflect the most recent validated structure.
The integrated zone construction further extends standard projection methods by grouping related levels into continuous price regions, rather than displaying only isolated horizontal lines.
Summary
This script identifies swing-based X–A–B structures using confirmed pivots or manual anchors, measures the impulse between X and A, and projects proportional levels from B. All displayed lines and zones are derived from this single reference movement and update dynamically as new pivots appear. The indicator provides a structured projection framework based on historical price geometry rather than predictive signals.
อินดิเคเตอร์

Dynamic Trend-Based Fibonacci Extension💡 This indicator is a sophisticated, automated technical analysis tool designed to identify high-probability trend continuation setups using the principles of market structure and Fibonacci geometry. By algorithmically detecting "A-B-C" price structures (Pivot -> Impulse -> Retracement), it projects dynamic Fibonacci Extension levels to forecast potential price targets for the next impulsive move (Wave C to D). Unlike static drawing tools, this script adapts to market volatility and features an advanced invalidation engine to keep your charts clean and your risk managed.
✨ Originality and Utility
Traders often struggle with the subjectivity of drawing Fibonacci extensions manually. This script solves that by standardizing the identification of market structure using a proprietary ZigZag algorithm enhanced with Average True Range (ATR) for volatility-adjusted sensitivity.
Key unique features include:
Automated Structure Detection: Instantly spots Bullish (Higher High, Higher Low) and Bearish (Lower Low, Lower High) sequences without manual input.
Dynamic Invalidation: The script monitors price action in real-time. If price breaks the invalidation point (Point A), the structure is immediately "grayed out" or deleted, preventing you from trading based on broken setups.
Golden Zone Targeting: Highlights the high-probability reversal zone between the 1.5 and 1.618 extensions, often associated with the completion of a measured move.
JSON Alerting: Built-in support for algorithmic trading with structured JSON payloads (Entry, TP, SL) ready for webhook integration.
🔬 Methodology and Concepts
The core logic operates on a three-step algorithmic sequence:
1. Pivot Identification: The script uses a "ZigZag" approach to find significant swing highs and lows. It employs an ATR-based threshold (or fixed deviation) to filter out market noise, ensuring only significant structural points are considered.
2. Geometric Validation: It evaluates the last three pivot points (A, B, C) to confirm a valid trend structure.
Bullish Setup: Point C must be higher than Point A but lower than Point B (a valid retracement).
Bearish Setup: Point C must be lower than Point A but higher than Point B.
3. Projection Mathematics: Once a valid ABC structure is locked, the script calculates extension targets using the standard formula: Target = Price C + ((Price B - Price A) * Ratio) . It also supports Logarithmic Scale calculations for assets with exponential growth, such as cryptocurrencies, ensuring proportional accuracy over large price ranges.
🎨 Visual Guide
The indicator paints a clear, detailed roadmap on your chart. Here is how to interpret the visual elements:
● Structure Lines
Solid Line (A to B): Represents the initial "Impulse" leg of the move.
Dashed Line (B to C): Represents the "Retracement" or corrective leg.
Green Structures: Indicate Bullish setups (looking for long entries).
Red Structures: Indicate Bearish setups (looking for short entries).
Gray/Dimmed Structures: These are invalidated setups where the price has breached the Stop Loss level (Point A).
● Extension Levels (Targets)
The script projects the following key Fibonacci ratios extending from Point C:
0.618 (Wave 5): An early profit-taking level, often corresponding to a truncated 5th wave.
1.0 (Measured Move): Where the extension equals the length of the initial impulse (AB = CD pattern).
1.272 (Harmonic): A common extension level for corrective structures or deep pullbacks.
Golden Zone (1.5 - 1.618): A highlighted fill area. The 1.618 level (Solid Line) is the "Golden Ratio" and is statistically one of the most significant targets in trending markets, often labeled as "Wave 3".
● Labels
Points A, B, C: Clearly marks the swing points defining the structure.
Right-Side Labels: Display the Ratio (e.g., 1.618) and the exact Price Level for easy order placement.
📖 How to Use
This tool is best used as a trend-following system.
1. Trend Identification
Wait for a new Solid Colored Structure (Green or Red) to appear. This confirms that a valid ABC retracement has occurred.
2. Entry Strategy
The "Trigger" is generally the reversal from Point C. Aggressive traders enter near C, while conservative traders may wait for a breakout above B.
Stop Loss: Place your SL just beyond Point A . If price breaks A, the script will automatically gray out the structure, signaling invalidation.
3. Profit Taking
Use the projected extension lines as dynamic Take Profit (TP) zones:
TP1: 1.0 (The Measured Move).
TP2: The Golden Zone (1.5 to 1.618). This is often the strongest target for a Wave 3 impulsive move.
4. Automation
For automated traders, create an alert using the "Any alert() function call" option. The script outputs a JSON string containing the Action, Ticker, Entry Price, TP (1.618), and SL (Point A).
⚙️ Inputs and Settings
You can fully customize the script to fit your asset class and timeframe:
● ZigZag Detection
Pivot Lookback Depth: (Default: 5) Determines how many bars to check left/right for a pivot. Higher numbers find larger, more significant structures.
Use ATR-Based Threshold: (Default: True) Adapts the sensitivity to market volatility.
ATR Multiplier: (Default: 2.0) Adjusts how much price must reverse to form a new leg.
● Structure Invalidation
Enable Structure Invalidation: (Default: True) Toggles the logic that checks if Point A is breached.
Invalidation Action: Choose "Gray Out" to keep history visible but dimmed, or "Delete" to remove failed setups entirely.
● Fibonacci Settings
Use Logarithmic Scale: Essential for crypto or long-term timeframe analysis.
Show 0.618 / 1.0 / 1.272 / 1.618: Toggles individual levels on/off to declutter the chart.
Extend Lines Right: Extends the target lines into the future for better visibility.
● Display Settings
Keep Last N Structures: Controls how many historical structures remain on the chart to prevent visual clutter.
Show Elliott Wave Labels: Adds theoretical wave counts (e.g., "Wave 3") to the ratio labels.
🔍 Deconstruction of the Underlying Scientific and Academic Framework
This indicator is grounded in Fractal Market Geometry and Elliott Wave Theory .
1. The Golden Ratio (Phi - 1.618):
Mathematically derived from the Fibonacci sequence, the 1.618 ratio is omnipresent in natural growth patterns. In financial markets, it represents the psychological "tipping point" of crowd behavior during an impulsive trend. This script emphasizes the 1.618 extension as the primary target for a "Wave 3," which is academically cited as typically the longest and strongest wave in a 5-wave motive sequence.
2. Harmonic AB=CD Patterns:
The inclusion of the 1.0 extension validates the "Measured Move" concept. Statistically, markets often move in symmetrical legs where the secondary impulse (CD) equals the magnitude of the primary impulse (AB).
3. Volatility Normalization (ATR):
By utilizing the Average True Range (ATR) for pivot detection, the script adheres to statistical volatility normalization. This ensures that the structures identified are statistically significant relative to the asset's current volatility regime, rather than relying on arbitrary percentage moves which fail across different asset classes.
⚠️ Disclaimer
All provided scripts and indicators are strictly for educational exploration and must not be interpreted as financial advice or a recommendation to execute trades. I expressly disclaim all liability for any financial losses or damages that may result, directly or indirectly, from the reliance on or application of these tools. Market participation carries inherent risk where past performance never guarantees future returns, leaving all investment decisions and due diligence solely at your own discretion. อินดิเคเตอร์

Auto Fibonacci Lines Depending on ZigZag %In the world of technical analysis, few tools are as powerful—or as misused—as Fibonacci Retracements. The Auto Fibonacci Lines Depending on ZigZag % is not just an indicator; it is a complete, automated trading system designed to eliminate subjectivity and bring institutional-grade precision to your charts.
This script automates the identification of significant market structures using a ZigZag algorithm. Once a market swing is mathematically confirmed (based on your deviation settings), it instantly projects a complete suite of Retracement and Extension levels. This allows you to stop guessing where to draw your lines and start focusing on price action.
🧠 The Logic Behind the Indicator
Understanding how your tools work is the first step to trusting them. This script operates on a three-step logic loop:
ZigZag Identification:
The script continuously monitors price action relative to the last known pivot point. It uses a user-defined Deviation % to filter out market noise. A new "Leg" is only confirmed when price reverses by this specific percentage. This ensures that the Fibonacci lines are only drawn on significant market moves, not random chop.
Automated Anchor Points:
Once a downward trend is confirmed (e.g., price drops 30% from the top), the script automatically anchors the Fibonacci tool to the Swing High (Start) and the Swing Low (End). It does this without you needing to click or drag anything.
Dynamic Cleanup:
Markets evolve. A key feature of this script is its self-cleaning mechanism. As soon as a new trend leg is confirmed, the script automatically deletes the old, invalidated Fibonacci lines and draws a fresh set for the new structure. This keeps your chart clean and focused on the now.
🎓 How to Trade This System
This indicator is color-coded to simplify your decision-making process. It moves beyond standard "rainbow" charts by categorizing price levels into three distinct actionable zones.
1. The "Reload Zone" (White Lines: 0.618 - 0.786) ⚪
Role: High-Probability Support / Entry
In institutional trading, the 0.618 (Golden Ratio) to 0.786 region is often where algorithms step in to defend a trend.
Why it works : This is the "discount" area where smart money re-accumulates positions before the next leg up.
2. The "Decision Wall" (Blue Lines: 1.382 - 1.5) 🔵
Role: Strong Resistance / Trend Check
This is a unique feature of this suite. The 1.382 and 1.5 levels often act as a "ceiling" for weak breakouts.
Strategy : If you entered in the White Zone, the Blue Zone is your first major hurdle. If price stalls here, consider securing partial profits.
Warning : A rejection from the Blue Lines often leads to a double-top formation. However, a clean break above the Blue Lines usually signals a parabolic move is beginning.
3. The "Extension Zone" (Yellow, Red, Purple > 1.618) 🟡🔴
Role : Take Profit / Exhaustion
Levels above 1.5 (starting with the 1.618 Golden Extension) are statistical extremes.
Strategy : These are Strict Take Profit levels. Do not FOMO (Fear Of Missing Out) into new long positions here. The probability of a reversal increases drastically as price climbs through these levels (2.618, 3.618, 4.618).
📐 The Mathematical Edge: Logarithmic vs. Linear
One of the most critical features of this script is the ability to toggle between Logarithmic and Linear calculations.
Why use Logarithmic?
If you are trading Crypto (Bitcoin, Altcoins) or high-growth Tech Stocks, linear Fibonacci levels are mathematically incorrect over large moves. A 50% drop from $100 is different than a 50% drop from $10.
This script calculates the percentage difference (Log Scale), ensuring your targets are accurate even during 100%+ parabolic runs.
Why use Linear?
For mature markets like Forex (EURUSD) or Indices (SPX500) where volatility is lower, Linear scaling is the industry standard.
🛠️ Configuration & Best Practices
Deviation % : This is the heartbeat of the indicator.
Swing Trading : Set to 20-30%. This filters out noise and only draws Fibs on major macro moves.
Scalping : Set to 3-5%. This will catch smaller intraday waves.
Text Place : Keeps your chart clean by pushing labels to the right, ensuring they don't overlap with the current price action.
👤 Who Is This Indicator For?
The Disciplined Trader : Who wants to remove emotional bias from their charting.
The Crypto Investor : Who needs accurate Logarithmic targets for long-term holding.
The Confluence Trader : Who combines these automated levels with Order Blocks, RSI, or Volume to find the perfect entry.
⚠️ RISK DISCLAIMER & TERMS OF USE
For Educational Purposes Only:
This script and the strategies described herein are provided strictly for educational and informational purposes. They do not constitute financial, investment, or trading advice. The "Auto Fibonacci Lines" indicator is a tool for technical analysis and should not be used as the sole basis for any trading decision.
No Guarantees:
Past performance of any trading system or methodology is not necessarily indicative of future results. Financial markets are inherently volatile, and trading involves a high level of risk. You could lose some or all of your capital.
User Responsibility:
By using this script, you acknowledge that you are solely responsible for your own trading decisions and risk management. The author assumes no liability for any losses or damages resulting from the use of this tool or the information provided. Always consult with a qualified financial advisor before making investment decisions. อินดิเคเตอร์
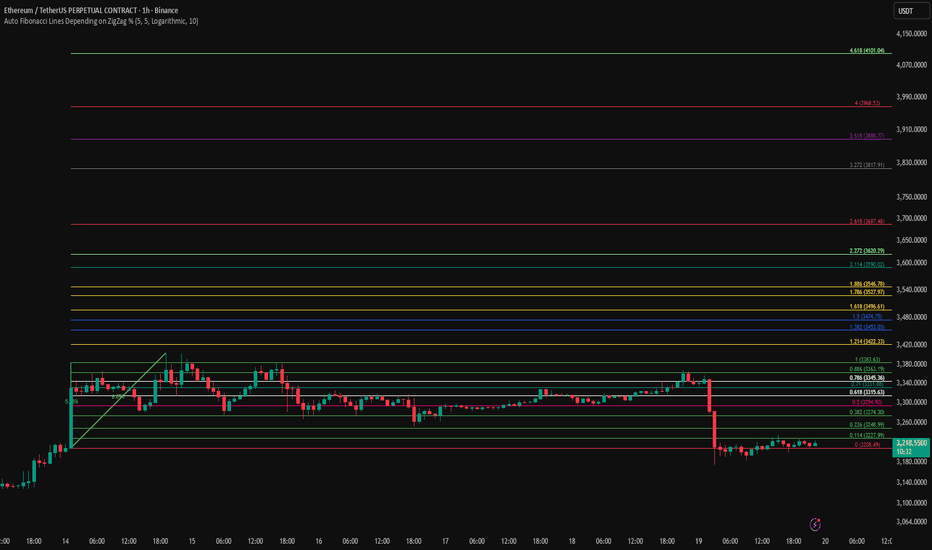
IDWM Master StructureExecutive Summary
The IDWM Master Structure is a Multi-Timeframe (MTF) trading tool designed to force discipline by aligning traders with the "Parent" trend. It functions by locking onto the "Completed Auction" of a higher timeframe candle (like a Daily or Weekly bar) and projecting that structure onto your lower timeframe chart. Its primary goal is to define the "Dealing Range"—the hard boundaries where value was previously established—so you don't get lost in the noise of smaller price movements.
1. The Principle of Completed Auctions (Hierarchy)
Most technical indicators curve dynamically with every price tick. This script acts differently because it relies on "Settled Arguments." A closed Daily candle represents a finished battle between buyers and sellers; the High and Low are the historical results of that battle.
To enforce this, the script automatically selects a "Parent" timeframe based on your view:
Scalping (charts below 15 minutes) uses the 4-Hour Auction.
Intraday trading (15 minutes to 4 Hours) uses the Daily Auction.
Swing trading (Daily chart) uses the Weekly Auction.
2. Liquidity Pools & The Sticky Range
The High and Low lines drawn by the indicator are not just support and resistance; they represent Liquidity Pools. In market theory, stop-losses (Sell Stops below Lows, Buy Stops above Highs) accumulate at these edges.
Smart money often pushes price just past these lines to grab this liquidity (a "Stop Hunt") before reversing direction. To account for this, the script uses a "Sticky Range" mechanism. It refuses to redraw the box simply because price touched the line. Instead, it uses an Average True Range (ATR) Buffer. A new structure is only formed if the candle closes decisively outside the range plus this volatility buffer. This ensures you are trading real breakouts, not liquidity sweeps.
3. Internal Range Mechanics (Premium vs. Discount)
Inside the Master Box, the script applies Equilibrium Theory to help with trade location.
The most important internal line is the Equilibrium (EQ), which marks the exact 50% point of the range.
Premium Zone (Above EQ): Price is mathematically "expensive" relative to the recent range. Algorithms generally look to establish Short positions here.
Discount Zone (Below EQ): Price is considered "cheap." Algorithms generally look to establish Long positions here.
It also plots the Master Open, which acts as a "Line in the Sand." If price is currently trading above the Master Open, the higher timeframe candle is Green (Bullish), suggesting longs have a higher probability. If below, the candle is Red (Bearish).
4. Wick Theory (Failed Auctions)
The script places special emphasis on the wicks of the Master Candle because a wick represents a "Failed Auction"—a price level the market tried to explore but ultimately rejected.
The indicator highlights the background of the wick area (from the High to the Body). On a retest, these zones often act as supply or demand blocks because the market remembers the previous failure.
It also calculates the "Consequent Encroachment," which is the 50% midpoint of the wick. The rule of thumb here is that if a candle body can close past 50% of a wick, the rejection is nullified, and price will likely travel to fill the entire wick.
5. Energy Expansion (Breakout Targets)
Market energy transfers from Consolidation (inside the box) to Expansion (the breakout). When the price finally breaks the "Sticky Range" (confirming via the ATR buffer), the script projects where that energy will go.
It uses the height of the previous range to calculate Fibonacci extensions. Specifically, it targets the 1.618 Extension, often called the "Golden Ratio." This is a statistically significant level where expansion moves tend to exhaust themselves and reverse.
6. Safety Protocol: Live Detection
A dashboard monitors the state of the parent candle. If the text turns Magenta with a warning symbol, it means the Higher Timeframe candle is "Live" (still forming).
Trading off a live structure is considered higher risk because the "Auction" isn't finished—the High or Low can still shift. The safest approach is to trade when the dashboard indicates a standard, locked, historical structure. อินดิเคเตอร์

Fibonacci Projection with Volume & Delta Profile (Zeiierman)█ Overview
Fibonacci Projection with Volume & Delta Profile (Zeiierman) blends classic Fibonacci swing analysis with modern volume-flow reading to create a unified, projection-based market framework. The indicator automatically detects the latest swing high and swing low, builds a complete Fibonacci structure, and then projects future extension targets with clear visual pathways.
What makes this tool unique is the integration of two volume-based systems directly into the Fibonacci structure. A Fib-aligned Volume Profile shows how bullish and bearish volume accumulated inside the swing range, while a separate Delta Profile reveals the imbalance of buy–sell pressure inside each Fibonacci interval. Together, these elements transform the standard Fibonacci tool into a multi-dimensional structural and volume-flow map.
█ How It Works
The indicator first detects the most recent swing high and swing low using the Period setting. That swing defines the Fibonacci range, from which the script draws retracement levels (0.236–0.786) and builds a forward projection path using the chosen Projection Level and a 1.272 extension.
Along this path, it draws projection lines, target boxes, and percentage labels that show how far each projected leg extends relative to the previous one.
Inside the same swing range, the script builds a Fib-based Volume Profile by splitting price into rows and assigning each bar’s volume as bullish (close > open) or bearish (close ≤ open). On top of that, it calculates a Volume Delta Profile between each pair of fib levels, showing whether buyers or sellers dominated that band and how strong that imbalance was.
█ How to Use
This tool helps traders quickly understand market structure and where the price may be heading next. The projection engine shows the most likely future targets, highlights strong or weak legs in the move, and updates automatically whenever a new swing forms. This ensures you always see the most relevant and up-to-date projection path.
The Fib Volume Profile shows where volume supported the move and where it did not. Thick bullish buckets reveal zones where buyers stepped in aggressively, often becoming retestable support. Thick bearish buckets highlight zones of resistance or rejection, particularly useful if projected levels align with prior liquidity.
The Delta Profile adds a second dimension to volume reading by showing where buy–sell pressure was truly imbalanced. A projected Fibonacci target that aligns with a strong bullish delta, for example, may suggest continuation. A projection into a band dominated by bearish delta may warn of reversal or hesitation.
█ Settings
Period – bars used to determine swing high/low
Projection Level – chosen Fib ratio for projection path
-----------------
Disclaimer
The content provided in my scripts, indicators, ideas, algorithms, and systems is for educational and informational purposes only. It does not constitute financial advice, investment recommendations, or a solicitation to buy or sell any financial instruments. I will not accept liability for any loss or damage, including without limitation any loss of profit, which may arise directly or indirectly from the use of or reliance on such information.
All investments involve risk, and the past performance of a security, industry, sector, market, financial product, trading strategy, backtest, or individual's trading does not guarantee future results or returns. Investors are fully responsible for any investment decisions they make. Such decisions should be based solely on an evaluation of their financial circumstances, investment objectives, risk tolerance, and liquidity needs.
อินดิเคเตอร์

BE-Fib Channel 2 Sided Trading█ Overview:
"BE-Fib Channel 2 Sided Trading" indicator is built with the thought of 2 profound setups named "Cup & Handle (C&H)" and "Fibonacci Channel Trading (FCT)" with the context of "day trading" or with a minimum holding period.
█ Similarities, Day Trading Context & Error Patterns:
While the known fact is that both C&H and FCT provide setups with lesser risk with bigger returns, they both share the similar "Base Pattern".
Note: Inverse of the above Image shall switch the setups between long vs short.
Since the indicator is designed for smaller time-frame candles, there may be instances where the "base pattern" does not visually resemble a Cup & Handle (C&H) pattern. However, patterns are validated using pivot points. The points labeled "A" and "C" can be equal or slightly slanted. Settings of the Indicator allows traders a flexibility to control the angle of these points to spot the strategies according to set conditions. Therefore, understanding the nuances of these patterns is crucial for effective decision-making.
█ 2 Sided Edge: FCT suggests to take trade closer to the yellow line to get better RR ratio. this leaves a small chance of doubt as to; what if price is intended to break the Yellow line thereby activating the C&H.
Wait for the confirmation is a Big FOMO with a compromised RR.
Hence, This indicator is designed to handle both the patterns based on the strength, FIFO and pattern occurring delay.
█ How to Use this Indicator:
Step 1: Enable the Show Sample Sensitivity option to understand the angle of yellow line shown in the sample image. By enabling this option, On the last bar you shall see 4 lines being plotted depicting the max angle which is acceptable for both long and short trades.
Note: Angle can be controlled via setting "Sensitivity".
Higher Sensitivity --> Higher Setup identification --> can lead to failed setups due to 2 sided trading.
Lower Sensitivity --> Lower Setup identification --> can increase the changes of being right.
Step 2: Adjust the look back & look forward periods which shall be used for identifying patterns.
Note: Smaller values can lead to more setups being identified but can hamper the performance of the indicator while increasing the chances of failures. larger values identifies more significant setup but leads to more waiting period thereby compromising on the RR.
Step 3: Adjust the Base Range.
Note: Smaller values can lead to more setups being identified but can hamper the performance of the indicator while increasing the chances of failures. larger values identifies more significant setup but leads to more Risk on play.
Step 4: set the Entry level for FCT & Set the SL for Both FCT & C&H and Target Reward ratio for C&H.
█ Features of Indicator & How it works:
1. Patterns are being identified using Pivot Points method.
2. Tracks & validates both the setups simultaneously on every candle and traded one at a time based on FIFO, New setups found in-between, Defined Entry Levels while on wait for the other pattern to get activated.
3. Alerts added for trade events.
4. FCT setups are generally traded with trailed SL level and increasing Target level on every completed bar. while C&H has the standard SL & TP level with no Trail SL option.
DISCLAIMER: No sharing, copying, reselling, modifying, or any other forms of use are authorized for our documents, script / strategy, and the information published with them. This informational planning script / strategy is strictly for individual use and educational purposes only. This is not financial or investment advice. Investments are always made at your own risk and are based on your personal judgement. I am not responsible for any losses you may incur. Please invest wisely.
Happy to receive suggestions and feedback in order to improve the performance of the indicator better. อินดิเคเตอร์

ATR Stop-Loss with Fibonacci Take-Profit [jpkxyz]ATR Stop-Loss with Fibonacci Take-Profit Indicator
This comprehensive indicator combines Average True Range (ATR) volatility analysis with Fibonacci extensions to create dynamic stop-loss and take-profit levels. It's designed to help traders set precise risk management levels and profit targets based on market volatility and mathematical ratios.
Two Operating Modes
Default Mode (Rolling Levels)
In default mode, the indicator continuously plots evolving stop-loss and take-profit levels based on real-time price action. These levels update dynamically as new bars form, creating rolling horizontal lines across the chart. I use this mode primarily to plot the rolling ATR-Level which I use to trail my Stop-Loss into profit.
Characteristics:
Levels recalculate with each new bar
All selected Fibonacci levels display simultaneously
Uses plot() functions with trackprice=true for price tracking
Custom Anchor Mode (Fixed Levels)
This is the primary mode for precision trading. You select a specific timestamp (typically your entry bar), and the indicator locks all calculations to that exact moment, creating fixed horizontal lines that represent your actual trade levels.
Characteristics:
Entry line (blue) marks your anchor point
Stop-loss calculated using ATR from the anchor bar
Fibonacci levels projected from entry-to-stop distance
Lines terminate when price breaks through them
Includes comprehensive alert system
Core Calculation Logic
ATR Stop-Loss Calculation:
Stop Loss = Entry Price ± (ATR × Multiplier)
Long positions: SL = Entry - (ATR × Multiplier)
Short positions: SL = Entry + (ATR × Multiplier)
ATR uses your chosen smoothing method (RMA, SMA, EMA, or WMA)
Default multiplier is 1.5, adjustable to your risk tolerance
Fibonacci Take-Profit Projection:
The distance from entry to stop-loss becomes the base unit (1.0) for Fibonacci extensions:
TP Level = Entry + (Entry-to-SL Distance × Fibonacci Ratio)
Available Fibonacci Levels:
Conservative: 0.618, 1.0, 1.618
Extended: 2.618, 3.618, 4.618
Complete range: 0.0 to 4.764 (23 levels total)
Multi-Timeframe Functionality
One of the indicator's most powerful features is timeframe flexibility. You can analyze on one timeframe while using stop-loss and take-profit calculations from another.
Best Practices:
Identify your entry point on execution timeframe
Enable "Custom Anchor" mode
Set anchor timestamp to your entry bar
Select appropriate analysis timeframe
Choose relevant Fibonacci levels
Enable alerts for automated notifications
Example Scenario:
Analyse trend on 4-hour chart
Execute entry on 5-minute chart for precision
Set custom anchor to your 5-minute entry bar
Configure timeframe setting to "4h" for swing-level targets
Select appropriate Fibonacci Extension levels
Result: Precise entry with larger timeframe risk management
Visual Intelligence System
Line Behaviour in Custom Anchor Mode:
Active levels: Lines extend to the right edge
Hit levels: Lines terminate at the breaking bar
Entry line: Always visible in blue
Stop-loss: Red line, terminates when hit
Take-profits: Green lines (1.618 level in gold for emphasis)
Customisation Options:
Line width (1-4 pixels)
Show/hide individual Fibonacci levels
ATR length and smoothing method
ATR multiplier for stop-loss distance
อินดิเคเตอร์

GIGANEVA V6.61 PublicThis enhanced Fibonacci script for TradingView is a powerful, all-in-one tool that calculates Fibonacci Levels, Fans, Time Pivots, and Golden Pivots on both logarithmic and linear scales. Its ability to compute time pivots via fan intersections and Range interactions, combined with user-friendly features like Bool Fib Right, sets it apart. The script maximizes TradingView’s plotting capabilities, making it a unique and versatile tool for technical analysis across various markets.
1. Overview of the Script
The script appears to be a custom technical analysis tool built for TradingView, improving upon an existing script from TradingView’s Community Scripts. It calculates and plots:
Fibonacci Levels: Standard retracement levels (e.g., 0.236, 0.382, 0.5, 0.618, etc.) based on a user-defined price range.
Fibonacci Fans: Trendlines drawn from a high or low point, radiating at Fibonacci ratios to project potential support/resistance zones.
Time Pivots: Points in time where significant price action is expected, determined by the intersection of Fibonacci Fans or their interaction with key price levels.
Golden Pivots: Specific time pivots calculated when the 0.5 Fibonacci Fan (on a logarithmic or linear scale) intersects with its counterpart.
The script supports both logarithmic and linear price scales, ensuring versatility across different charting preferences. It also includes a feature to extend Fibonacci Fans to the right, regardless of whether the user selects the top or bottom of the range first.
2. Key Components Explained
a) Fibonacci Levels and Fans from Top and Bottom of the "Range"
Fibonacci Levels: These are horizontal lines plotted at standard Fibonacci retracement ratios (e.g., 0.236, 0.382, 0.5, 0.618, etc.) based on a user-defined price range (the "Range"). The Range is typically the distance between a significant high (top) and low (bottom) on the chart.
Example: If the high is $100 and the low is $50, the 0.618 retracement level would be at $80.90 ($50 + 0.618 × $50).
Fibonacci Fans: These are diagonal lines drawn from either the top or bottom of the Range, radiating at Fibonacci ratios (e.g., 0.382, 0.5, 0.618). They project potential dynamic support or resistance zones as price evolves over time.
From Top: Fans drawn downward from the high of the Range.
From Bottom: Fans drawn upward from the low of the Range.
Log and Linear Scale:
Logarithmic Scale: Adjusts price intervals to account for percentage changes, which is useful for assets with large price ranges (e.g., cryptocurrencies or stocks with exponential growth). Fibonacci calculations on a log scale ensure ratios are proportional to percentage moves.
Linear Scale: Uses absolute price differences, suitable for assets with smaller, more stable price ranges.
The script’s ability to plot on both scales makes it adaptable to different markets and user preferences.
b) Time Pivots
Time pivots are points in time where significant price action (e.g., reversals, breakouts) is anticipated. The script calculates these in two ways:
Fans Crossing Each Other:
When two Fibonacci Fans (e.g., one from the top and one from the bottom) intersect, their crossing point represents a potential time pivot. This is because the intersection indicates a convergence of dynamic support/resistance zones, increasing the likelihood of a price reaction.
Example: A 0.618 fan from the top crosses a 0.382 fan from the bottom at a specific bar on the chart, marking that bar as a time pivot.
Fans Crossing Top and Bottom of the Range:
A fan line (e.g., 0.5 fan from the bottom) may intersect the top or bottom price level of the Range at a specific time. This intersection highlights a moment where the fan’s projected support/resistance aligns with a key price level, signaling a potential pivot.
Example: The 0.618 fan from the bottom reaches the top of the Range ($100) at bar 50, marking bar 50 as a time pivot.
c) Golden Pivots
Definition: Golden pivots are a special type of time pivot calculated when the 0.5 Fibonacci Fan on one scale (logarithmic or linear) intersects with the 0.5 fan on the opposite scale (or vice versa).
Significance: The 0.5 level is the midpoint of the Fibonacci sequence and often acts as a critical balance point in price action. When fans at this level cross, it suggests a high-probability moment for a price reversal or significant move.
Example: If the 0.5 fan on a logarithmic scale (drawn from the bottom) crosses the 0.5 fan on a linear scale (drawn from the top) at bar 100, this intersection is labeled a "Golden Pivot" due to its confluence of key Fibonacci levels.
d) Bool Fib Right
This is a user-configurable setting (a boolean input in the script) that extends Fibonacci Fans to the right side of the chart.
Functionality: When enabled, the fans project forward in time, regardless of whether the user selected the top or bottom of the Range first. This ensures consistency in visualization, as the direction of the Range selection (top-to-bottom or bottom-to-top) does not affect the fan’s extension.
Use Case: Traders can use this to project future support/resistance zones without worrying about how they defined the Range, improving usability.
3. Why Is This Code Unique?
Original calculation of Log levels were taken from zekicanozkanli code. Thank you for giving me great Foundation, later modified and applied to Fib fans. The script’s uniqueness stems from its comprehensive integration of Fibonacci-based tools and its optimization for TradingView’s plotting capabilities. Here’s a detailed breakdown:
All-in-One Fibonacci Tool:
Most Fibonacci scripts on TradingView focus on either retracement levels, extensions, or fans.
This script combines:
Fibonacci Levels: Static horizontal lines for retracement and extension.
Fibonacci Fans: Dynamic trendlines for projecting support/resistance.
Time Pivots: Temporal analysis based on fan intersections and Range interactions.
Golden Pivots: Specialized pivots based on 0.5 fan confluences.
By integrating these functions, the script provides a holistic Fibonacci analysis tool, reducing the need for multiple scripts.
Log and Linear Scale Support:
Many Fibonacci tools are designed for linear scales only, which can distort projections for assets with exponential price movements. By supporting both logarithmic and linear scales, the script caters to a wider range of markets (e.g., stocks, forex, crypto) and user preferences.
Time Pivot Calculations:
Calculating time pivots based on fan intersections and Range interactions is a novel feature. Most TradingView scripts focus on price-based Fibonacci levels, not temporal analysis. This adds a predictive element, helping traders anticipate when significant price action might occur.
Golden Pivot Innovation:
The concept of "Golden Pivots" (0.5 fan intersections across scales) is a unique addition. It leverages the symmetry of the 0.5 level and the differences between log and linear scales to identify high-probability pivot points.
Maximized Plot Capabilities:
TradingView imposes limits on the number of plots (lines, labels, etc.) a script can render. This script is coded to fully utilize these limits, ensuring that all Fibonacci levels, fans, pivots, and labels are plotted without exceeding TradingView’s constraints.
This optimization likely involves efficient use of arrays, loops, and conditional plotting to manage resources while delivering a rich visual output.
User-Friendly Features:
The Bool Fib Right option simplifies fan projection, making the tool intuitive even for users who may not consistently select the Range in the same order.
The script’s flexibility in handling top/bottom Range selection enhances usability.
4. Potential Use Cases
Trend Analysis: Traders can use Fibonacci Fans to identify dynamic support/resistance zones in trending markets.
Reversal Trading: Time pivots and Golden Pivots help pinpoint moments for potential price reversals.
Range Trading: Fibonacci Levels provide key price zones for trading within a defined range.
Cross-Market Application: Log/linear scale support makes the script suitable for stocks, forex, commodities, and cryptocurrencies.
The original code was from zekicanozkanli . Thank you for giving me great Foundation. อินดิเคเตอร์

Autofib Extensions | DTDHello trader comuunity!
I'm introducing another script that is part of my main day-trading strategy. We all know regardless of what strategy we use, we need to know what levels offer the least amount of risk to our trade entry and a great tool to anticipate how far a move might go or what level a move may retrace to are the Fibonacci Retracement and Extensions. This indicator combines both together, but with a twist.
The main elements of the script are:
1. Multiple Session High and Lows | Developing my first script led me to understand that measuring key times during each session provides understanding of the market's continuity. I have provided 3 "sessions' a user can define according to CST time where the script saves the high and low of that session window to produce the retracement and extensions from those plots. Currently, the levels are always plotted from low to high (with the 0 mark being the high) and negative values provided so the levels are consistent. You can toggle each session on or off.
2. Coloring Key Retracements / Extensions | I use a dark background for my charts so the default colors help me distinguish from other another indicator I use. Feel free to adjust the colors to your preference. I consider 3 different colors because of their significance. Retracements that you want to see continue fall back into the .50 to .618 level (this I consider the "Golden Zone"). While basic Elliott Wave Theory states a wave is completed near the 1.618 level (this I consider "Major Extensions"). Everything isn't noise, but minor levels in a larger sequence.
______________
Script Limitations
All of my scripts are made with the help of ChatGPT so there are going to be limitations. One current one that I have made progress on, but not fully is when you are viewing a timeframe where the candle doesn't start when a session window starts. On smaller timeframes like the 7-minute this is not an issue. However, on the hourly, if your session window starts at the half hour which the 3rd session default window does, the lines will not produce. I will hopefully have this rectified in the near future. I will open the script since none of this work is original in nature and I would love to see how others can create a better product. Also, this is mainly a futures trading tool. If you are using this on stocks you will find it not as useful if the session window is too wide since the script waits until the session window closes to calculate the extension values.
Cheers,
DTD อินดิเคเตอร์

Fibonacci Volume Profiles [AlgoAlpha]Unlock a deeper understanding of price action with the Fibonacci Volume Profiles indicator by AlgoAlpha! This powerful tool blends Fibonacci retracement levels with customizable volume profiles, helping traders identify high-probability areas of support, resistance, and accumulation. Designed for both continuous dynamic levels and custom time periods, this indicator is a must-have for traders seeking confluence in market structure analysis.
🔑 Key Features
📈 Dual Mode Selection : Choose between Continuous Fibonacci levels, which adapt dynamically to pivots, or a Custom Period mode, where you set your own start and end points.
📊 Integrated Volume Profile : Visualize volume distributions at key Fibonacci retracement levels, revealing areas of strong buying/selling interest.
🎨 Customizable Colors & Transparency : Adjust Fibonacci level colors, fill zones, and profile transparency for a visually clear experience.
🔍 Profile Resolution & Scaling : Control the number of price levels and width of the volume profile for detailed market insights.
🛠 Extendable Levels : Optionally extend Fibonacci levels to the right of the chart for better visualization of future price interaction.
📌 How to Use
Add the Indicator: Click on the star icon to add it to your favorites and apply it to your TradingView chart.
Analyze The Market: Observe how price interacts with Fibonacci levels alongside the volume profile to confirm support/resistance zones. Switch between custom range or continuous mode to align the tool with your trading style.
⚙️ How It Works
The indicator calculates pivot highs/lows dynamically (or uses user-defined time periods) to plot Fibonacci retracement levels. It then builds a volume profile by analyzing historical volume data, grouping it into price bins to highlight volume-heavy zones. The Point of Control (PoC) is identified as the level with the highest traded volume, acting as a key price magnet. The color-coded Fibonacci levels help traders spot retracement zones, while the volume profile confirms strength or weakness in those areas.
อินดิเคเตอร์
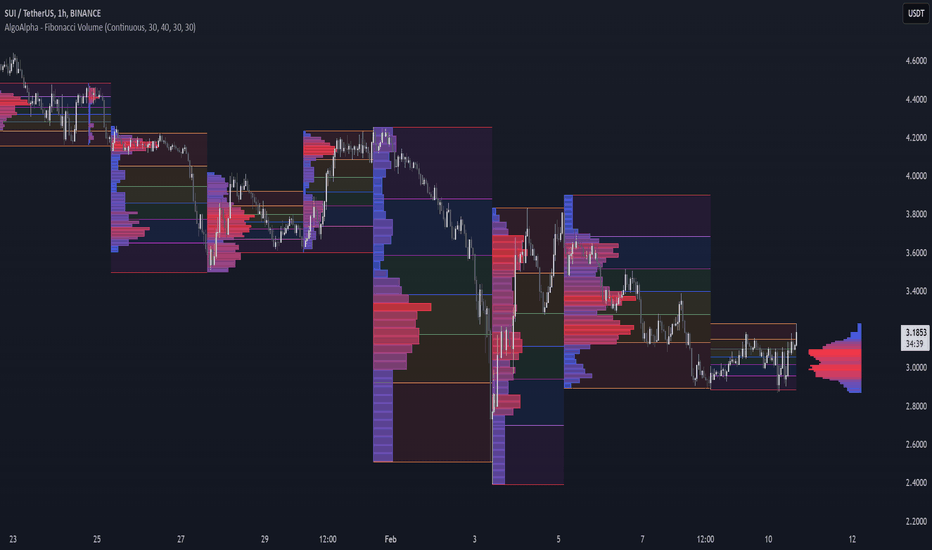
Auto Fibonacci Extension and Retracement with Visual AlertsThis indicator automatically calculates and plots Fibonacci retracement and extension levels based on recent swing highs and lows, making it a powerful tool for traders who use Fibonacci analysis in their strategies.
Key Features:
• Dynamic Fibonacci Levels: Automatically detects swing highs and lows over a user-defined lookback period to calculate key Fibonacci retracement (e.g., 0.236, 0.382, 0.618, etc.) and extension (e.g., 1.618, 2.618, etc.) levels.
• Visual Alerts: Displays intuitive visual alerts when the price crosses important Fibonacci levels.
• Blue dashed lines for retracement levels.
• Green dashed lines for extension levels.
• Labels with up or down arrows indicating price interactions with these levels.
• Swing High/Low Visualization: Marks recent swing highs and lows with crosses for better clarity.
• Customizable: Adjust the lookback period and Fibonacci levels to suit your trading style.
Who is it for?
This indicator is perfect for:
• Swing Traders: To identify potential reversal or continuation zones.
• Day Traders: For short-term setups based on Fibonacci levels.
• Fibonacci Enthusiasts: To automate the time-consuming process of manually plotting levels.
Usage Ideas:
1. Use retracement levels (e.g., 0.618) to identify areas of potential support or resistance.
2. Use extension levels (e.g., 1.618) to target potential breakout or continuation zones.
3. Combine this indicator with candlestick patterns, volume analysis, or other tools for confirmation.
Limitations:
• This is a standalone indicator and does not provide buy/sell signals. It’s recommended to combine it with other technical analysis tools for best results.
• The lookback period and swing detection rely on past data, so adjustments may be needed based on the asset or timeframe.
Whether you’re looking to streamline your Fibonacci analysis or explore new opportunities in your trading, this indicator is designed to save time, increase accuracy, and enhance your overall trading experience. อินดิเคเตอร์
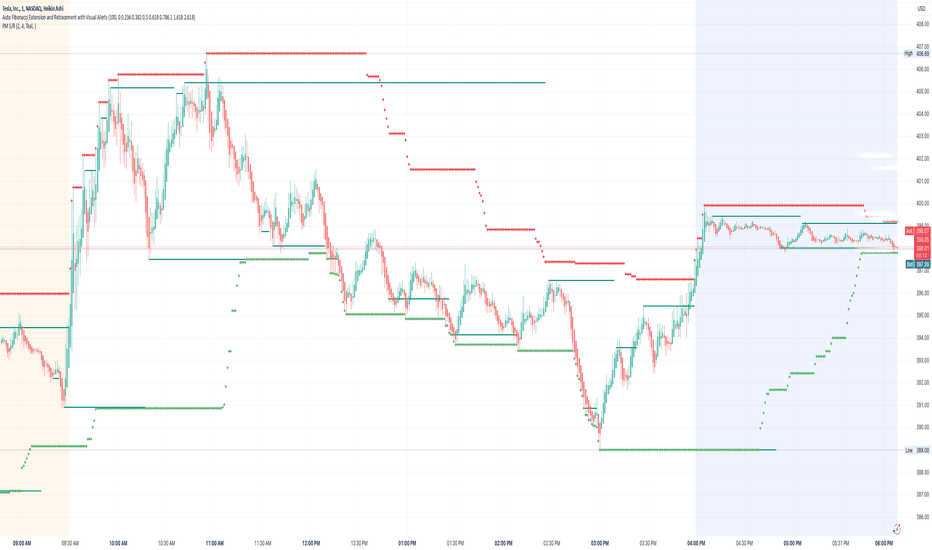
อินดิเคเตอร์

Fibonacci Time-Price Zones🟩 Fibonacci Time-Price Zones is a chart visualization tool that combines Fibonacci ratios with time-based and price-based geometry to analyze market behavior. Unlike typical Fibonacci indicators that focus solely on horizontal price levels, this indicator incorporates time into the analysis, providing a more dynamic perspective on price action.
The indicator offers multiple ways to visualize Fibonacci relationships. Drawing segmented circles creates a unique perspective on price action by incorporating time into the analysis. These segmented circles, similar to TradingView's built-in Fibonacci Circles, are derived from Fibonacci time and price levels, allowing traders to identify potential turning points based on the dynamic interaction between price and time.
As another distinct visualization method, the indicator incorporates orthogonal patterns, created by the intersection of horizontal and vertical Fibonacci levels. These intersections form L-shaped connections on the chart, derived from key Fibonacci price and time intervals, highlighting potential areas of support or resistance at specific points in time.
In addition to these geometric approaches, another option is sloped lines, which project Fibonacci levels that account for both time and price along the trendline. These projections derive their angles from the interplay between Fibonacci price levels and Fibonacci time intervals, creating dynamic zones on the chart. The slope of these lines reflects the direction and angle of the trend, providing a visual representation of price alignment with market direction, while maintaining the time-price relationship unique to this indicator
The indicator also includes horizontal Fibonacci levels similar to traditional retracement and extension tools. However, unlike standard tools, traders can display retracement levels, extension levels, or both simultaneously from a single instance of the indicator. These horizontal levels maintain consistency with the chosen visualization method, automatically scaling and adapting whether used with circles, orthogonal patterns, or slope-based analysis.
By combining these distinct methods—circles, orthogonal patterns, sloped projections, and horizontal levels—the indicator provides a comprehensive approach to Fibonacci analysis based on both time and price relationships. Each visualization method offers a unique perspective on market structure while maintaining the core principle of time-price interaction.
⭕ THEORY AND CONCEPT ⭕
While traditional Fibonacci tools excel at identifying potential support and resistance levels through price-based ratios (0.236, 0.382, 0.618), they do not incorporate the dimension of time in market analysis. Extensions and retracements effectively measure price relationships within trends, yet markets move through both price and time dimensions simultaneously.
Fibonacci circles represent an evolution in technical analysis by incorporating time intervals alongside price levels. Based on the mathematical principle that markets often move in circular patterns proportional to Fibonacci ratios, these circles project potential support and resistance zones as partial circles radiating from significant price points. However, traditional circle-based tools can create visual complexity that obscures key market relationships. The integration of time into Fibonacci analysis reveals how price movements often respect both temporal and price-based ratios, suggesting a deeper geometric structure to market behavior.
The Fibonacci Time-Price Zones indicator advances these concepts by providing multiple geometric approaches to visualize time-price relationships. Each shape option—circles, orthogonal patterns, slopes, and horizontal levels—represents a different mathematical perspective on how Fibonacci ratios manifest across both dimensions. This multi-faceted approach allows traders to observe how price responds to Fibonacci-based zones that account for both time and price movements, potentially revealing market structure that purely price-based tools might miss.
Shape Options
The indicator employs four distinct geometric approaches to analyze Fibonacci relationships across time and price dimensions:
Circular : Represents the cyclical nature of market movements through partial circles, where each radius is scaled by Fibonacci ratios incorporating both time and price components. This geometry suggests market movements may follow proportional circular paths from significant pivot points, reflecting the harmonic relationship between time and price.
Orthogonal : Constructs L-shaped patterns that separate the time and price components of Fibonacci relationships. The horizontal component represents price levels, while the vertical component measures time intervals, allowing analysis of how these dimensions interact independently at key market points.
Sloped : Projects Fibonacci levels along the prevailing trend, incorporating both time and price in the angle of projection. This approach suggests that support and resistance levels may maintain their relationship to price while adjusting to the temporal flow of the market.
Horizontal : Provides traditional static Fibonacci levels that serve as a reference point for comparing price-only analysis with the dynamic time-price relationships shown in the other three shapes. This baseline approach allows traders to evaluate how the incorporation of time dimension enhances or modifies traditional Fibonacci analysis.
By combining these geometric approaches, the Fibonacci Time-Price Zones indicator creates a comprehensive analytical framework that bridges traditional and advanced Fibonacci analysis. The horizontal levels serve as familiar reference points, while the dynamic elements—circular, orthogonal, and sloped projections—reveal how price action responds to temporal relationships. This multi-dimensional approach enables traders to study market structure through various geometric lenses, providing deeper insights into time-price symmetry within technical analysis. Whether applied to retracements, extensions, or trend analysis, the indicator offers a structured methodology for understanding how markets move through both price and time dimensions.
🛠️ CONFIGURATION AND SETTINGS 🛠️
The Fibonacci Time-Price Zones indicator offers a range of configurable settings to tailor its functionality and visual representation to your specific analysis needs. These options allow you to customize zone visibility, structures, horizontal lines, and other features.
Important Note: The indicator's calculations are anchored to user-defined start and end points on the chart. When switching between charts with significantly different price scales (e.g., from Bitcoin at $100,000 to Silver at $30), adjustment of these anchor points is required to ensure correct positioning of the Fibonacci elements.
Fibonacci Levels
The indicator allows users to customize Fibonacci levels for both retracement and extension analysis. Each level can be individually configured with the following options:
Visibility : Toggle the visibility of each level to focus on specific areas of interest.
Level Value : Set the Fibonacci ratio for the level, such as 0.618 or 1.000, to align with your analysis needs.
Color : Customize the color of each level for better visual clarity.
Line Thickness : Adjust the line thickness to emphasize critical levels or maintain a cleaner chart.
Setup
Zone Type : Select which Fibonacci zones to display:
- Retracement : Shows potential pull back levels within the trend
- Extension : Projects levels beyond the trend for potential continuation targets
- Both : Displays both retracement and extension zones simultaneously
Shape : Choose from four visualization methods:
- Circular : Time-price based semicircles centered on point B
- Orthogonal : L-shaped patterns combining time and price levels
- Sloped : Trend-aligned projections of Fibonacci levels
- Horizontal : Traditional horizontal Fibonacci levels
Visual Settings
Fill % : Adjusts the fill intensity of zones:
0% : No fill between levels
100% : Maximum fill between levels
Lines :
Trendline : The base A-B trend with customizable color
Extension : B-C projection line
Retracement : B-D pullback line
Labels :
Points : Show/hide A, B, C, D markers
Levels : Show/hide Fibonacci percentages
Time-Price Points
Set the time and price for the points that define the Fibonacci zones and horizontal levels. These points are defined upon loading the chart. These points can be configured directly in the settings or adjusted interactively on the live chart.
A and B Points : These user-defined time and price points determine the basis for calculating the semicircles and Fibonacci levels. While the settings panel displays their exact values for fine-tuning, the easiest way to modify these points is by dragging them directly on the chart for quick adjustments.
Interactive Adjustments : Any changes made to the points on the chart will automatically synchronize with the settings panel, ensuring consistency and precision.
🖼️ CHART EXAMPLES 🖼️
Fibonacci Time-Price Zones using the 'Circular' Shape option. Note the price interaction at the 0.786 level, which acts as a support zone. Additional points of interest include resistance near the 0.618 level and consolidation around the 0.5 level, highlighting the utility of both horizontal and semicircular Fibonacci projections in identifying key price areas.
Fibonacci Time-Price Zones using the 'Sloped' Shape option. The chart displays price retracing along the sloped Fibonacci levels, with blue arrows highlighting potential support zones at 0.618 and 0.786, and a red arrow indicating potential resistance at the 1.0 level. This visual representation aligns with the prevailing downtrend, suggesting potential selling pressure at the 1.0 Fibonacci level.
Fibonacci Time-Price Zones using the 'Orthogonal' Shape option. The chart demonstrates price action interacting with vertical zones created by the orthogonal lines at the 0.618, 0.786, and 1.0 Fibonacci levels. Blue arrows highlight potential support areas, while red arrows indicate potential resistance areas, revealing how the orthogonal lines can identify distinct points of price interaction.
Fibonacci Time-Price Zones using the 'Circular' Shape option. The chart displays price action in relation to segmented circles emanating from the starting point (point A). The circles represent different Fibonacci ratios (0.382, 0.5, 0.618, 0.786) and their intersections with the price axis create potential zones of support and resistance. This approach offers a visually distinct way to analyze potential turning points based on both price and time.
Fibonacci Time-Price Zones using the 'Sloped' Shape option. The sloped Fibonacci levels (0.786, 0.618, 0.5) create zones of potential support and resistance, with price finding clear interaction within these areas. The ellipses highlight this price action, particularly the support between 0.786 and 0.618, which aligns closely with the trend.
Fibonacci Time-Price Zones using the 'Circular' Shape option. The price action appears to be ‘hugging’ the 0.5 Fibonacci level, suggesting potential resistance. This demonstrates how the circular zones can identify potential turning points and areas of consolidation which might not be seen with linear analysis.
Fibonacci Time-Price Zones using the 'Sloped' Shape option with Point D marker enabled. The chart demonstrates clear price action closely following along the sloped Retracement line until the orthogonal intersection at the 0.618 levels where the trend is broken and price dips throughout the 0.618 to 0.786 horizontal zone. Price jumps back to the retracement slope at the start of the 0.786 horizontal zone and continues to the 1.0 horizontal zone. The aqua-colored retracement line is enabled to further emphasize this retracement slope .
Geometric validation using TradingView's built-in Fibonacci Circle tool (overlaid). The alignment at the 0.5 and 1.0 levels demonstrates the indicator's consistent approximation of Fibonacci Circles.
Comparison of Fibonacci Time-Price Zones (Shape: Horizontal) with TradingView's Built-in Retracement and Extension Tools (overlaid): This example demonstrates how the Horizontal structure aligns with TradingView’s retracement and extension levels, allowing users to integrate multiple tools seamlessly. The Fibonacci circle connects retracement and extension zones, highlighting the potential relationship between past retracements and future extensions.
📐 GEOMETRIC FOUNDATIONS 📐
This indicator integrates circular and straight representations of Fibonacci levels, specifically the Circular , Orthogonal , Sloped , and Horizontal shape options. The geometric principles behind these shapes differ significantly, requiring distinct scaling methods for accurate representation. The Circular shape employs logarithmic scaling with radial expansion, where the distance from a central point determines the level's position, creating partial circles that align with TradingView's built-in Fibonacci Circle tool. The other three shapes utilize geometric progression scaling for linear extension from a starting point, resulting in straight lines that align with TradingView's built-in Fibonacci retracement and extension tools. Due to these distinct geometric foundations and scaling methods, perfectly aligning both the partial circles and straight lines simultaneously is mathematically constrained, though any differences are typically visually imperceptible.
The Circular shape's partial circles are calculated and scaled to align with TradingView's built-in Fibonacci Circles. These circles are plotted from the second swing point onward. This approach ensures consistent and accurate visualization across all market types, including those with gaps or closed sessions, which unlike 24/7 markets, do not have a direct one-to-one correspondence between bar indices and time. To maintain accurate geometric proportions across varying chart scales, the indicator calculates an aspect ratio by normalizing the proportional difference between vertical (price) and horizontal (time) distances of the swing points. This normalization factor ensures geometric shapes maintain their mathematical properties regardless of price scale magnitude or time period span, while maintaining the correct proportions of the geometric constructions at any chart zoom level.
The indicator automatically applies the appropriate scaling factor based on the selected shape option, optimizing either circular proportions and proper radius calculations for each Fibonacci level, or straight-line relationships between Fibonacci levels. These distinct scaling approaches maintain mathematical integrity while preserving the essential characteristics of each geometric representation, ensuring optimal visualization accuracy whether using circular or linear shapes.
⚠️ DISCLAIMER ⚠️
The Fibonacci Time-Price Zones indicator is a visual analysis tool designed to illustrate Fibonacci relationships through geometric constructions incorporating both curved and straight lines, providing a structured framework for identifying potential areas of price interaction. It is not intended as a predictive or standalone trading signal indicator.
The indicator calculates levels and projections using user-defined anchor points and Fibonacci ratios. While it aims to align with TradingView’s Fibonacci extension, retracement, and circle tools by employing mathematical and geometric formulas, no guarantee is made that its calculations are identical to TradingView's proprietary methods.
Like all technical and visual indicators, these visual representations may visually align with key price zones in hindsight, reflecting observed price dynamics. However, these visualizations are not standalone signals for trading decisions and should be interpreted as part of a broader analytical approach.
This indicator is intended for educational and analytical purposes, complementing other tools and methods of market analysis. Users are encouraged to integrate it into a comprehensive trading strategy, customizing its settings to suit their specific needs and market conditions.
🧠 BEYOND THE CODE 🧠
The Fibonacci Time-Price Zones indicator is designed to encourage both education and community engagement. By integrating time-sensitive geometry with Fibonacci-based frameworks, it bridges traditional grid-based analysis with dynamic time-price relationships. The inclusion of semicircles, horizontal levels, orthogonal structures, and sloped trends provides users with versatile tools to explore the interaction between price movements and temporal intervals while maintaining clarity and adaptability.
As an open-source tool, the indicator invites exploration, experimentation, and customization. Whether used as a standalone resource or alongside other technical strategies, it serves as a practical and educational framework for understanding market structure and Fibonacci relationships in greater depth.
Your feedback and contributions are essential to refining and enhancing the Fibonacci Time-Price Zones indicator. We look forward to the creative applications, adaptations, and insights this tool inspires within the trading community.
อินดิเคเตอร์

Fibonacci Confluence Toolkit [LuxAlgo]The Fibonacci Confluence Toolkit is a technical analysis tool designed to help traders identify potential price reversal zones by combining key market signals and patterns. It highlights areas of interest where significant price action or reactions are anticipated, automatically applies Fibonacci retracement levels to outline potential pullback zones, and detects engulfing candle patterns.
Its unique strength lies in its reliance solely on price patterns, eliminating the need for user-defined inputs, ensuring a robust and objective analysis of market dynamics.
🔶 USAGE
The script begins by detecting CHoCH (Change of Character) points—key indicators of shifts in market direction. This script integrates the principles of pure price action as applied in Pure-Price-Action-Structures , where further details on the detection process can be found.
The detected CHoCH points serve as the foundation for defining an Area of Interest (AOI), a zone where significant price action or reactions are anticipated.
As new swing highs or lows emerge within the AOI, the tool automatically applies Fibonacci retracement levels to outline potential retracement zones. This setup enables traders to identify areas where price pullbacks may occur, offering actionable insights into potential entries or reversals.
Additionally, the toolkit highlights engulfing candle patterns within these zones, further refining entry points and enhancing confluence for better-informed trading decisions based on real-time trend dynamics and price behavior.
🔶 SETTINGS
🔹 Market Patterns
Bullish Structures: Enable or disable all bullish components of the indicator.
Bearish Structures: Enable or disable all bearish components of the indicator.
Highlight Area of Interest: Toggle the option to highlight the Areas of Interest (enabled or disabled).
CHoCH Line: Choose the line style for the CHoCH (Solid, Dashed, or Dotted).
Width: Adjust the width of the CHoCH line.
🔹 Retracement Levels
Choose which Fibonacci retracement levels to display (e.g., 0, 0.236, 0.382, etc.).
🔹 Swing Levels & Engulfing Patterns
Swing Levels: Select how swing levels are marked (symbols like ◉, △▽, or H/L).
Engulfing Candle Patterns: Choose which engulfing candle patterns to detect (All, Structure-Based, or Disabled).
🔶 RELATED SCRIPTS
Pure-Price-Action-Structures.
อินดิเคเตอร์