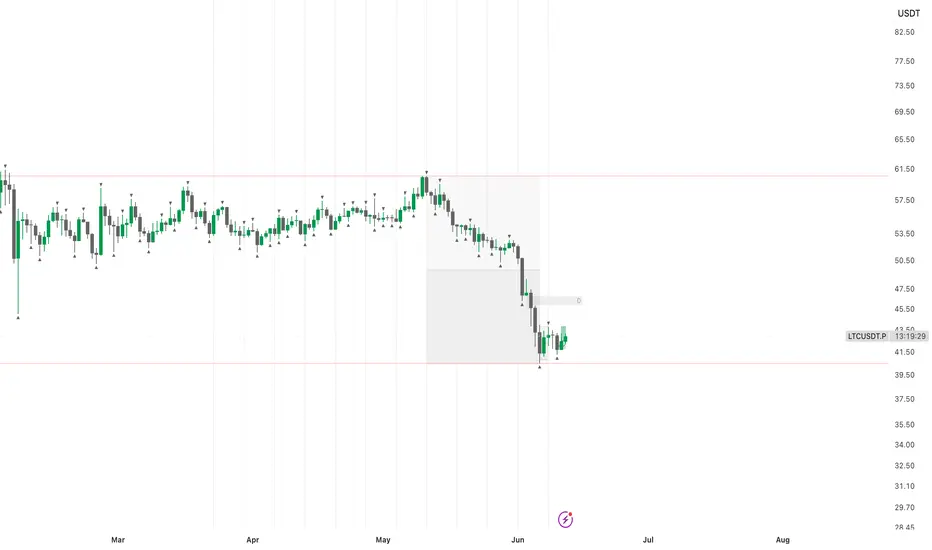
อินดิเคเตอร์
การวิเคราะห์ปัจจัยพื้นฐาน

Time Performance
The Time Performance Dashboard is an indicator that shows the percentage change in an asset’s price over a selected time period.
Unlike most similar solutions, the calculation is based not on the number of bars, but on a specified time interval. This allows you to quickly assess how the coin’s price has moved over the last few minutes, hours, days, or weeks.
Key Features
• Select any time period:
o minutes;
o hours;
o days;
o weeks.
• Automatic calculation of price change in
อินดิเคเตอร์

GEX Levels [SYNC & TRADE]# GEX Levels
This indicator plots key options gamma levels on your chart and turns raw dashboard numbers into a plain-language read: where the market accelerates, where it brakes, where it's being pulled, and what counts as a trigger versus wishful thinking.
Data is not pulled automatically (Pine has no access to external APIs). You paste one line of numbers — the indicator draws everything and explains it. Source code is open.
---
## What it draws on the chart
Four levels as lines on pri
อินดิเคเตอร์

อินดิเคเตอร์

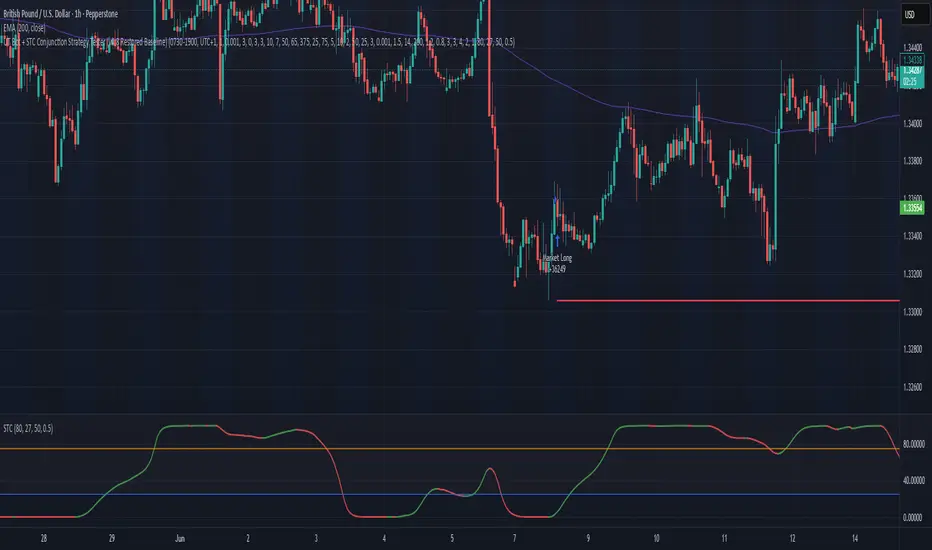
UT Bot + STC Conjunction Strategy Tester v4.8For GBPUSD 1H only
UT Bot + STC Conjunction Engine
Overview
The UT Bot + STC Conjunction Engine is a high-precision, institutional-grade intraday trading framework designed specifically for major currency pairs (optimized for GBPUSD). By marrying fast-reacting momentum tracking with a multi-layered liquidity and volatility filtering stack, this strategy aims to capture highly explosive value turnarounds while aggressively minimizing flat-market drawdowns.Rather than chasing price or tradi
กลยุทธ์
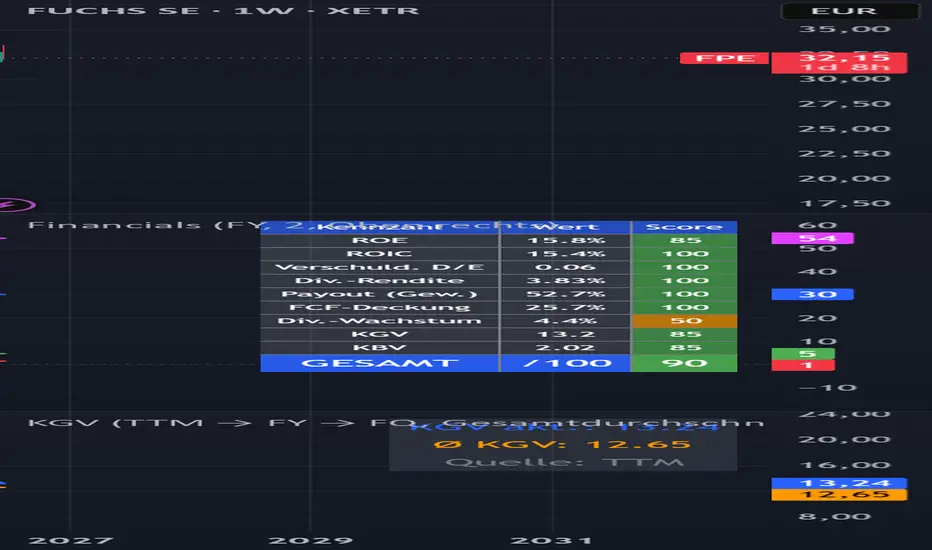
Financials on a timescaleDescription:
This indicator displays key financial metrics of a stock over time as individual lines in a separate pane. It allows you to see at a glance how a company's fundamentals have developed – without switching to the financials tab.
What the Indicator Shows
The four main metrics are displayed by default: Book Value (Equity) in blue, Total Debt in red, Net Income in green, and Total Revenue in fuchsia. An additional nine metrics can be enabled in the settings, including Gross Profit, EB
อินดิเคเตอร์
DMI Wilder 10DMI average type is wider , exponential to tell the moving direction
DMI average type is wider , exponential to tell the moving direction
อินดิเคเตอร์

Volatility Surge Strategy█ OVERVIEW
Volatility Surge Strategy (VSS) is an original indicator inspired by the concept of the Williams VIX Fix — a method of measuring the depth of price decline from a recent high to replicate VIX-like behavior on any instrument.
This script is a fully independent implementation built from scratch. The core calculation concept (drop depth from highest close) is a publicly known mathematical formula with no copyright. All Pine Script code is original.
█ HOW IT WORKS
• Volatility Index (
กลยุทธ์

Last 3 Monthly Highs/Lows Color-CodedSimple Indicator that tracks the last 3 complete months' Hi/Low
อินดิเคเตอร์

Market Context Indicator v2# Market Context Indicator v2
Market Context Indicator v2 was built around the idea that price moves between areas of liquidity, participation, and imbalance. Instead of relying on a single signal, it combines the major pieces of market structure I use to read the trading day into one clean chart.
### Session Structure
Tracks Asia, London, and New York sessions with visual session ranges, previous session highs and lows, and individual session VWAPs. This provides context for where liquidity
อินดิเคเตอร์

Guapoxtrades Goal Setting & Mission PanelGT Mission Panel™ - By Guapo Trades®
Purpose- Accountability Framework towards the operator mission
Overview
The GT Mission Panel™ is a trader accountability and goal-management system designed to keep your long-term objectives visible while you operate in the short-term environment of the financial markets.
Many traders spend years developing technical skills but struggle with consistency, discipline, emotional control, and maintaining focus on their larger purpose.
The GT Mission Panel™ wa
อินดิเคเตอร์

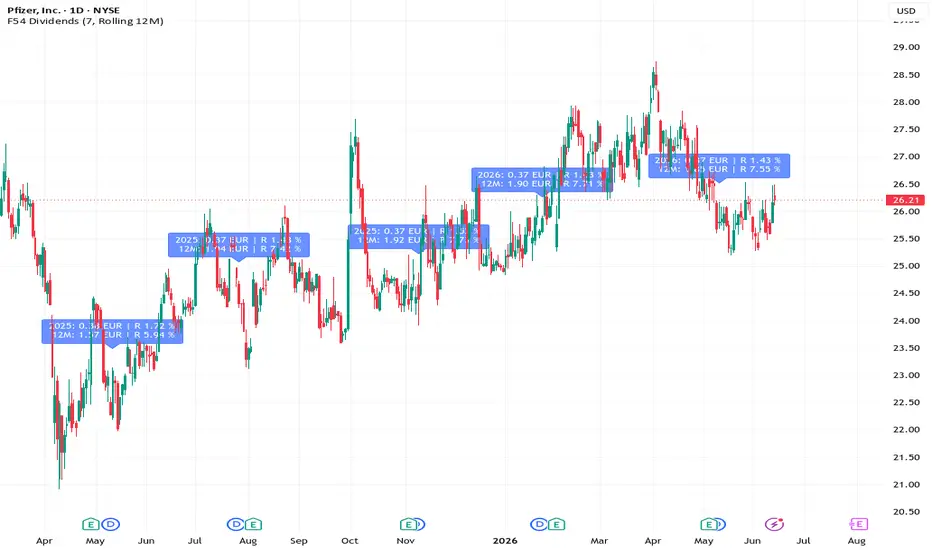
F54 DividendsF54 Dividends
Overview
F54 Dividends is an informational indicator that visualises cash dividend events for the active symbol and shows event-level plus cumulative dividend context directly on the chart.
The script is designed for analysis and transparency of dividend history. It does not place orders and does not provide trade execution logic.
Why This Indicator Is Useful
Dividend income is a core component of total return for income-oriented investors, yet TradingView's default chart v
อินดิเคเตอร์
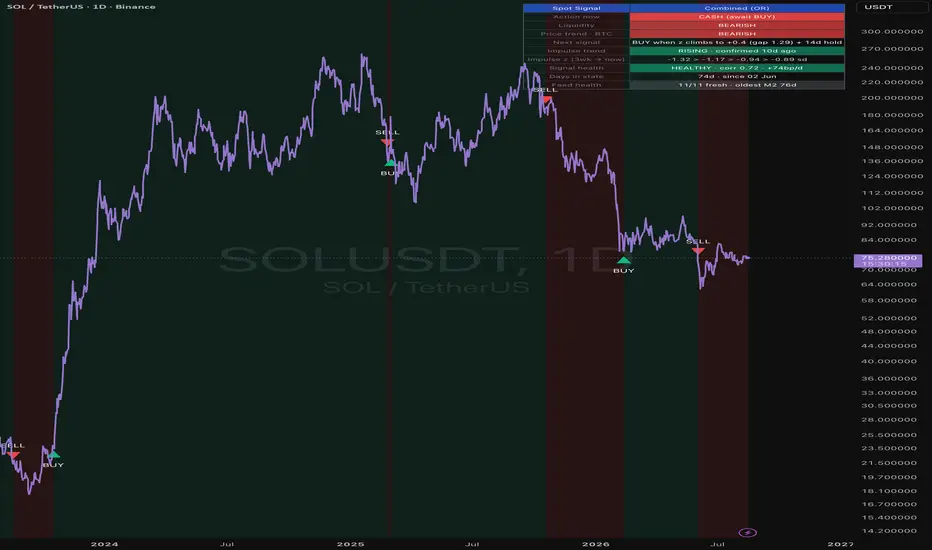
Liquidity & Trend: Spot Buy/SellLiquidity & Trend: Spot Buy/Sell
A spot position tool for the daily chart. Long or cash only, no shorting, no leverage. It answers one question: should I be holding this asset right now, or sitting in cash? It does that by reading the global liquidity tide and, for alts, the asset's own price trend, then printing plain BUY and SELL signals.
The idea
Global liquidity is usually drawn as a line laid over Bitcoin, but the level of money supply next to price is noisy and the relationship d
อินดิเคเตอร์
TJR v4 StrategyHere's a short publish description:
TJR PRO — Sweep → BOS→ FVG
An ICT-style strategy built on a single model: price raids liquidity, shifts market structure, then returns to the fair value gap for entry.
The model:
Sweep — a liquidity pool gets raided (PDH/PDL, PWH/PWL, Asia/London/NY session highs & lows, EQH/EQL)
MSS — market structure shifts in the opposite direction (displacement break)
FVG — price retraces into the resulting fair value gap (entry at the edge or 50% / consequent encroachme
กลยุทธ์

Risk/Reward Calculator & Position Size Dashboard📝 DESCRIPTION (ENGLISH)
Risk/Reward Calculator and Position Size - Professional Dashboard
This advanced indicator helps you plan every trade with mathematical precision, automatically calculating Take Profit, Draw Down, and profits based on your capital, position size, and selected instrument.
KEY FEATURES:
🎯 Smart Take Profit Calculation
Percentage Mode: enter your desired % and the script calculates the exact price
Specific Price Mode: enter your target price and the script calculates the corr
อินดิเคเตอร์

appaz utbot con Filtro EMA y Agotamientoentradas precisas y puedes ver las fases de agotamientos de los fractales
อินดิเคเตอร์

SQB- India Momentum Dashboard - MVPIts a dashboard with Mark Minervini style stage 2 filter and RSI value, RS strength etc,
it tell the latest pattern and help in taking the entry in the stock.
อินดิเคเตอร์

NY & London Session Boxes (IST)# NY & London Session Boxes (IST)
This TradingView Pine Script indicator automatically highlights the London and New York trading sessions using colored boxes based on Indian Standard Time (IST).
## Features
* 🟩 London Session Box: 1:00 PM to 4:00 PM IST
* 🟥 New York Session Box: 7:30 PM to 12:00 AM IST
* Automatically tracks and displays the session's highest high and lowest low.
* Dynamically expands the box as the session progresses.
* Clean visual representation for identifying session ra
อินดิเคเตอร์

Gold Macro Dashboard [invincible3]Gold Macro Indicator Dashboard
A professional macro-driven gold dashboard designed to evaluate the broader gold market regime using automatically sourced TradingView data. The indicator combines real yields, dollar strength, rate expectations, risk-off demand, gold breadth, and confirmation ratios into a single 0–100 Gold Macro Score.
The model uses a fixed daily macro timeframe, so dashboard readings stay consistent across intraday, daily, and weekly charts.
Main Features
Fixed Daily ma
อินดิเคเตอร์

Liquidity Map & Execution Cost# Liquidity Map & Execution Cost
## What this script does
LMX answers three execution questions most indicators ignore: **how expensive is it to get in and out right now, how hard would it be to move size, and where on the chart will price struggle versus travel freely.** It reads only the chart's own price and volume — no symbol is hardcoded, so it runs on any asset and any market (equities, futures, FX, crypto, indices) — and turns the answers into a plain-language trade check: liquidity s
อินดิเคเตอร์

อินดิเคเตอร์

golden zone (by appaz suarez gabriel)manten presente tu golden zone, para que no necesites marcar tu fibo
อินดิเคเตอร์

IBD Growth Moving Averages A clean moving average overlay designed for growth stock, momentum, and trend-following traders.
Includes:
* 5-Day SMA (Red)
* 10-Day SMA (Green)
* 21-Day EMA (Blue)
* 50-Day SMA (Gold)
* 200-Day SMA (Purple)
This combination blends short-term trend, intermediate trend, and long-term trend analysis into a single lightweight indicator. Inspired by commonly used moving averages among growth investors, breakout traders, and market timing practitioners.
Designed to reduce chart clutter by combin
อินดิเคเตอร์

12 Weeks View [by Roman]A clean market structure indicator designed for traders who focus on liquidity, key levels, and higher-timeframe context.
Features
Weekly Start Markers
Draws vertical lines at the beginning of each week.
Displays only the most recent 12 weeks to keep the chart clean.
Weekly line color is fully customizable.
12-Week Extreme Levels
Calculates the highest high from the previous 12 completed weeks.
Calculates the lowest low from the previous 12 completed weeks.
Displays a single horizon
อินดิเคเตอร์