MSX Harmonic ProMSX HARMONIC PRO — XABCD Pattern Detection with Scored Entries and 3 Targets
OVERVIEW
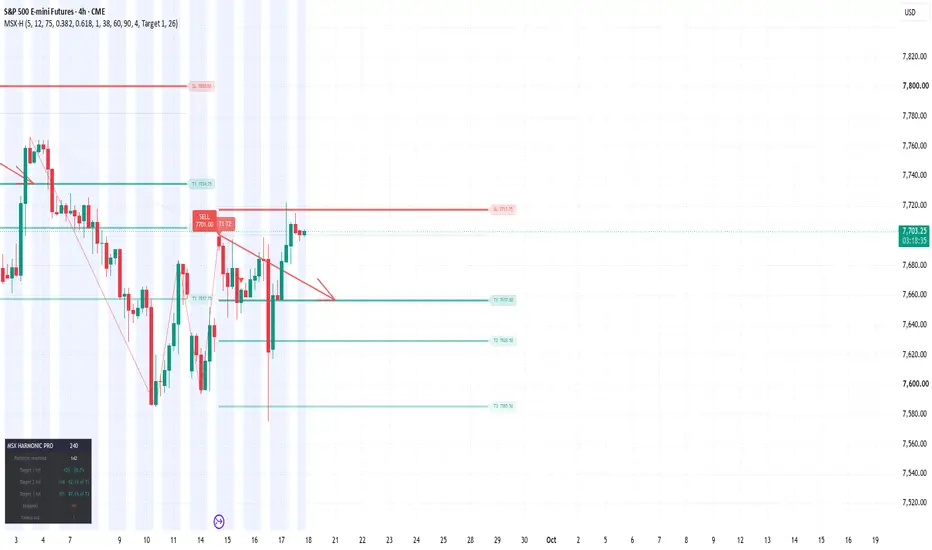
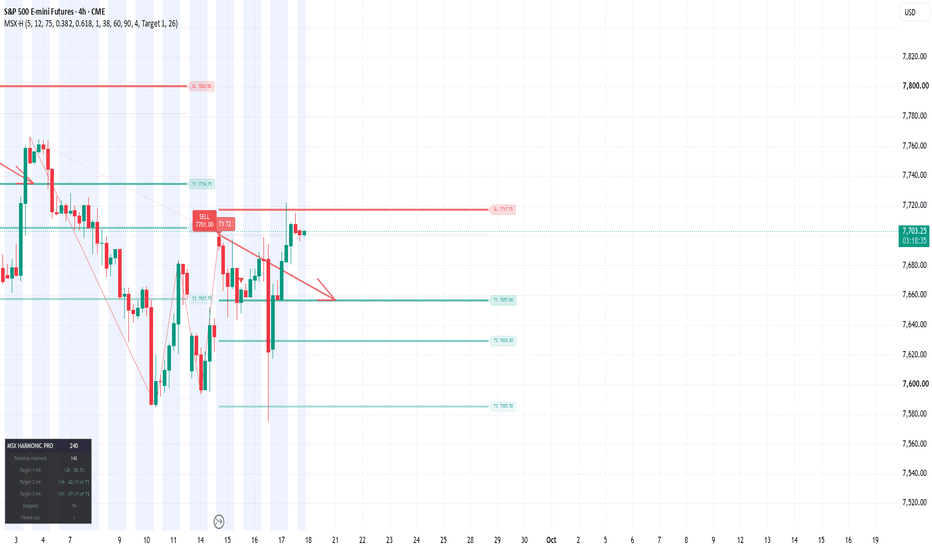
MSX Harmonic Pro detects five-point XABCD harmonic patterns, scores each one on how closely its legs match the ideal Fibonacci proportions, and projects a complete trade plan from the completion point: entry, stop loss, and three take-profit levels drawn as horizontal price lines.
Every pattern is then tracked to resolution. The stats table reports the measured hit rate for each target on your symbol and timeframe — not a claimed rate, but what actually happened on the chart in front of you.
Nothing else is plotted. No moving averages, no oscillators, no bands, no fills.
HOW IT WORKS
PIVOT LADDER Swing highs and lows are detected with a configurable pivot length and pushed into an alternating ladder. When two consecutive pivots are the same type, only the more extreme one is retained, so the X-A-B-C-D sequence always alternates direction and never collapses into noise.
PATTERN MATCHING Each new five-pivot sequence is measured against six harmonic types:
Gartley AB/XA 0.618 · BC/AB 0.382-0.886 · CD/BC 1.13-1.618 · AD/XA 0.786 Bat AB/XA 0.382-0.5 · BC/AB 0.382-0.886 · CD/BC 1.618-2.618 · AD/XA 0.886 Butterfly AB/XA 0.786 · BC/AB 0.382-0.886 · CD/BC 1.618-2.24 · AD/XA 1.27-1.618 Crab AB/XA 0.382-0.618 · BC/AB 0.382-0.886 · CD/BC 2.618-3.618 · AD/XA 1.618 Shark AB/XA 0.382-0.618 · BC/AB 1.13-1.618 · CD/XC 0.886 Cypher AB/XA 0.382-0.618 · BC/AB 1.13-1.414 · CD/XC 0.786
Ratios defined as a single value are scored by proportional distance from that value. Ratios defined as a range score zero error anywhere inside the range and are penalised only for how far outside it they fall. The four leg errors are averaged and converted to a 0-100 score, where 100 is a geometrically perfect pattern. The best-scoring type wins the sequence; patterns below your minimum score are discarded and never drawn.
TRADE LEVELS Entry the D point, drawn as a grey dotted line Stop a percentage of the D-to-T1 distance placed beyond D, drawn as a thick red line Target 1 0.382 of the AD leg, measured back from D Target 2 0.618 of the AD leg Target 3 1.000 of the AD leg — a full retracement, which lands at point A
All four extend to the right of D and carry a price-tagged label.
PROJECTION ARROW A drawn arrow runs from the D point to your chosen target, showing the measured move the pattern's geometry implies. Select T1, T2 or T3 as the destination.
OUTCOME TRACKING Targets must be reached in order — T2 only registers after T1, T3 only after T2 — so a candle that spans several levels at once does not inflate the record. The score label at D builds up as the trade resolves:
82.4 still open 82.4 T1 reached target 1 82.4 T1 T2 T3 reached all three 82.4 X stopped out
Patterns that neither hit T1 nor stop within the timeout period are recorded separately as timed out and excluded from the hit rate.
STATS TABLE Patterns resolved completed trades with a definite outcome Target 1 hit count and percentage of resolved patterns Target 2 hit count and percentage of patterns that reached T1 Target 3 hit count and percentage of patterns that reached T2 Stopped count of losses Timed out expired without resolution
SETTINGS
PATTERNS Pivot length swing sensitivity. Lower finds more, smaller patterns. Allowed fib error % how far a ratio may deviate and still qualify. Minimum pattern score the main quality filter. Raise it for fewer, cleaner setups. Pattern toggles enable or disable each of the six types, and each direction.
ENTRY / STOP / TARGETS Target 1 / 2 / 3 Fibonacci multiples of the AD leg. Stop percentage of the D-to-T1 distance, placed beyond D. Level length how far the price lines extend right of D. Pattern timeout bars before an unresolved pattern expires. Patterns tracked how many run concurrently.
PROJECTION ARROW Arrow points to T1, T2 or T3. Arrow length horizontal reach in bars.
SIGNALS Buy / Sell labels at D, with the completion price shown on the label.
HOW TO USE IT
Start with the defaults and let the stats table fill on your symbol and timeframe. The three rates read together tell you where patterns stop working: if T1 converts well but T2-to-T3 conversion is weak, close the remainder at T2 rather than holding for a target the market is not reaching.
Minimum pattern score is the dial that matters. Raising it reduces signal count and raises average quality. Lower pivot length for intraday charts, higher for swing.
Harmonic completion points are reversal zones, not guarantees. The script is a structure and level tool — it identifies where a reversal is geometrically expected and what the measured move would be if it happens. Combine it with your own read of trend, session and higher-timeframe context.
ON THE SCORE
The number at the D point is Fibonacci ratio accuracy — how closely that pattern's legs match the textbook proportions of its type. It is a measure of geometric quality, not a probability of success. A 95-scoring pattern is a well-formed pattern; it can still fail. The stats table is the separate and more useful number, because it reports what actually happened rather than how good the shape looked.
NOTES
Original implementation. Pattern detection, scoring, level projection and outcome tracking are written from scratch — no external libraries, no reused code.
Harmonic pattern theory itself is public domain, developed through the work of H.M. Gartley, Larry Pesavento and Scott Carney.
This indicator is a technical analysis tool for study and planning. It is not financial advice and does not predict future price movement. Trading carries substantial risk of loss. Test any approach thoroughly before committing capital. อินดิเคเตอร์
Sattam | Harmonic LabSattam | Harmonic Lab
Sattam | Harmonic Lab is an all-in-one overlay for pattern trading: 30 harmonic and classical pattern families, ready-made entry / targets / stop for every pattern, a live panel that tracks each pattern's progress, a "possible patterns" projection for the developing leg, and higher-timeframe Supply & Demand zones. Every setting is bilingual (English | Arabic).
WHAT IT DETECTS
• Harmonic: Gartley, Butterfly, Bat, Crab, Alternate Bat, Deep Crab, Cypher, Shark, Nen Star, AB=CD, 3-Drive, 5-0, White Swan, Black Swan, Leonardo, Partizan.
• Anti patterns: Anti-Gartley, Anti-Butterfly, Anti-Bat, Anti-Crab, Anti-Shark, Anti-Cypher, Anti-Nen Star.
• Classical: Head & Shoulders, Inverse Head & Shoulders, Double Top, Double Bottom, Ascending / Descending / Symmetrical Triangle.
Patterns are built on confirmed zigzag pivots with a developing D evaluated at bar close. Drawings anchor to past pivots and a detected pattern is never redrawn. Each pattern shows its legs, shaded triangles, measurement guides with ratios, X/A/B/C/D letters, the name at D and a dotted validation zone under D. 3-Drive uses 1/2/3 boxes with extension diagonals; 5-0 uses X–B, A–C and X–D chords.
TRADE LEVELS AND LIFECYCLE
Entry, Target 1, Target 2 and Stop are computed for every pattern (defaults 10% / 40% / 94% of the pattern leg, stop at the validation edge) and drawn to the right of price until Target 1 is reached. Each pattern moves through Pending → Entered → Target 1 → Target 2, or Stopped / Invalidated / Expired. Stopped and invalidated patterns are removed at once; patterns that reached their target stay drawn for the expiry age.
ACTIVE PATTERNS PANEL
One row per active pattern: name, direction, entry, both targets, stop and age in bars, with ✓ marks as levels are reached. Optional lifecycle counters (Found / Entry / T1 / T2 / Stops / Invalid / Expired).
POSSIBLE PATTERNS
When the current leg can still complete a pattern, the projected D line, its zone and a label listing the candidate families with their D ranges (nearest first). Visual only — never part of signals or counters.
SUPPLY & DEMAND ZONES
Built on a timeframe you choose (default 4H) from a confirmed pivot followed by a displacement close beyond ATR; extended to the right and removed once a close invalidates them. Never drawn from the forming higher-timeframe bar.
ALERTS
New pattern, BUY entry, SELL entry, Target 1, Target 2, Stop, Invalidation, Expiry, New Supply Zone, New Demand Zone — plus a dynamic alert template ({ticker} {tf} {pattern} {side} {event} {entry} {t1} {t2} {sl}) for "Any alert() function call". Use "Once per bar close": all signals are computed on closed bars.
SETTINGS (groups)
01 Detection — zigzag period (8), pivot confirmation bars, nested XABCD search, candidate cap, error rate % (8), min/max pattern bars, minimum height, direction, session, max new patterns per bar, max active patterns, same-pattern blocking, expiry age, two-sided extreme bar handling.
02 Pattern families — a switch per family, Cypher minimum XC/XA, classical symmetry tolerance, H&S rules (skipped waves, pivots after the right shoulder, shoulder difference), triangle options, AB=CD time filter and tolerances.
03 Entry and targets — level basis, entry / T1 / T2 percentages, finish at T1 or T2, reward/risk targets, entry trigger (close confirmation or high/low touch).
04 Stop and validation — stop mode (zone / manual % / break-even / trailing), band padding, invalidation source, entry-side filter, validation style.
05 Appearance — draw patterns, letters, ratios, levels, validation zones, shading and transparency, palette (classic or by direction), text size, guides, line widths and styles, projection length, only active patterns, keep last pattern, maximum patterns drawn (6), completed patterns retained.
06 Projection — show nearest possible D zone, display mode, families listed, direction, colors, line width and style, prediction PRZ, Cypher forecast preference.
07 Panels — active patterns panel, lifecycle counters, size, position, alignment, colors, detection start date.
08 Alerts — event switches and the dynamic template.
09 Supply & Demand — enable, zone timeframe, pivot length, sensitivity, displacement window, width, offset, max zones per side, hide invalidated zones, colors, midline style, timeframe label.
NOTES
• Pivots need bars after them to confirm, so a pattern appears one or more bars after D completes.
• The panel and counters are not a backtest and do not represent trading performance.
• Not financial advice.
EXAMPLES
Several families on one chart:
Leonardo with a possible-patterns label:
Alternate Bat with En / T1 / T2 / SL and the panel:
Double Bottom and Symmetrical Triangle:
3-Drive and 5-0:
AB=CD completing inside a 4H demand zone:
Double Top with four possible patterns:
------------------------------------------------------------
Harmonic Lab
مؤشر متكامل لتداول الأنماط: 30 عائلة هارمونيك وكلاسيكية، مستويات دخول وأهداف ووقف جاهزة لكل نمط، لوحة حيّة تتابع تقدّم كل نمط، توقّع «الأنماط المحتملة» للموجة الجارية، ومناطق عرض وطلب من فاصل أعلى. كل الإعدادات ثنائية اللغة (English | عربي).
ما يكتشفه
• الهارمونيك: Gartley، Butterfly، Bat، Crab، Alternate Bat، Deep Crab، Cypher، Shark، Nen Star، AB=CD، 3-Drive، 5-0، White Swan، Black Swan، Leonardo، Partizan.
• الأنماط المعاكسة: Anti-Gartley، Anti-Butterfly، Anti-Bat، Anti-Crab، Anti-Shark، Anti-Cypher، Anti-Nen Star.
• الكلاسيكية: الرأس والكتفين ومعكوسه، القمة المزدوجة، القاع المزدوج، المثلث الصاعد والهابط والمتماثل.
تُبنى الأنماط على محاور زجزاج مؤكدة مع نقطة D نامية تُختبر عند إغلاق الشمعة. الرسم يُثبَّت على المحاور السابقة ولا يُعاد رسم النمط بعد اكتشافه. لكل نمط أضلاعه ومثلثاته المظلّلة وأدلة القياس بالنِّسَب وحروف X/A/B/C/D والاسم عند D ومنطقة تحقق منقّطة تحت D. 3-Drive بأرقام 1/2/3 وقطري امتداد؛ 5-0 بأوتار X–B وA–C وX–D.
المستويات ودورة الحياة
دخول وهدف أول وهدف ثانٍ ووقف تُحسب لكل نمط (افتراضيًا 10% / 40% / 94% من ضلع النمط، والوقف عند حافة منطقة التحقق) وتُرسم يمين السعر حتى بلوغ الهدف الأول. ينتقل النمط بين: قيد الانتظار ← دخل ← الهدف 1 ← الهدف 2، أو وقف / إبطال / انتهاء. الموقوف والمُبطل يُزال فورًا، والذي حقق هدفه يبقى مرسومًا حتى عمر الانتهاء.
لوحة الأنماط النشطة
صف لكل نمط نشط: الاسم، الاتجاه، الدخول، الهدفان، الوقف، وعمره بالشموع، مع ✓ عند تحقق كل مستوى. اختياريًا عدّادات دورة الحياة (Found / Entry / T1 / T2 / Stops / Invalid / Expired).
الأنماط المحتملة
حين تكون الموجة الجارية مرشحة لإكمال نمط، يُعرض خط D المتوقع ومنطقته وملصق يسرد العائلات المحتملة ونطاق D لكل منها بالأقرب أولًا. توقع بصري فقط — لا يدخل في الإشارات أو العدّادات.
مناطق العرض والطلب
تُبنى على الفاصل الذي تختاره (افتراضي 4 ساعات) من محور مؤكد يليه إغلاق بإزاحة تتجاوز ATR؛ تمتد يمينًا وتُحذف عند إبطالها بإغلاق. لا تُرسم من شمعة الفاصل الأعلى الجارية.
التنبيهات
نمط جديد، دخول شراء، دخول بيع، الهدف الأول، الهدف الثاني، الوقف، الإبطال، الانتهاء، منطقة عرض جديدة، منطقة طلب جديدة — إضافة إلى قالب تنبيه ديناميكي ({ticker} {tf} {pattern} {side} {event} {entry} {t1} {t2} {sl}) مع "Any alert() function call". اختر «Once per bar close» لأن كل الإشارات تُحتسب عند الإغلاق.
الإعدادات (المجموعات)
01 الاكتشاف — فترة الزجزاج (8)، شموع تأكيد المحور، البحث المتداخل، سقف المرشحين، نسبة الخطأ % (8)، أقل/أقصى شموع للنمط، أقل ارتفاع، الاتجاه، الجلسة، أقصى أنماط جديدة لكل شمعة، أقصى أنماط نشطة، منع تكرار النمط، عمر الانتهاء، معالجة الشمعة ثنائية الطرف.
02 عائلات الأنماط — مفتاح لكل عائلة، أدنى XC/XA لسايفر، سماحية تماثل الكلاسيكية، قواعد الرأس والكتفين (الموجات المتخطاة، المحاور بعد الكتف الأيمن، فرق الكتفين)، خيارات المثلث، فلتر زمن AB=CD وسماحياته.
03 الدخول والأهداف — أساس المستويات، نِسَب الدخول / الهدف 1 / الهدف 2، الإنهاء عند الهدف 1 أو 2، الأهداف بالعائد/المخاطرة، مُحفّز الدخول (تأكيد الإغلاق أو لمس القمة/القاع).
04 الوقف والتحقق — وضع الوقف (منطقة / يدوي % / تعادل / متحرك)، حشو النطاق، مصدر الإبطال، فلتر جهة الدخول، نمط خط التحقق.
05 المظهر — رسم الأنماط، الحروف، النِّسَب، المستويات، مناطق التحقق، التظليل وشفافيته، الألوان (كلاسيكية أو بالاتجاه)، حجم النص، الأدلة، سُمك الخطوط وأنماطها، امتداد المستويات، الأنماط النشطة فقط، إبقاء آخر نمط، أقصى أنماط مرسومة (6)، الأنماط المنتهية المُبقاة.
06 التوقع — إظهار أقرب منطقة D محتملة، وضع العرض، عدد العائلات في الملصق، الاتجاه، الألوان، عرض الخط ونمطه، منطقة PRZ، تفضيل توقع سايفر.
07 اللوحات — لوحة الأنماط النشطة، عدّادات دورة الحياة، الحجم، الموضع، المحاذاة، الألوان، تاريخ بدء الاكتشاف.
08 التنبيهات — مفاتيح الأحداث والقالب الديناميكي.
09 العرض والطلب — التفعيل، فاصل المناطق، طول المحور، الحساسية، نافذة الإزاحة، العرض، الامتداد، أقصى مناطق لكل جهة، إخفاء المُبطل، الألوان، نمط خط المنتصف، ملصق الفاصل.
ملاحظات
• المحاور تحتاج شموعًا بعدها لتتأكد، فيظهر النمط بعد اكتمال D بشمعة أو أكثر.
• اللوحة والعدّادات ليسا اختبارًا رجعيًا ولا يمثّلان أداءً تجاريًا.
• ليس توصية مالية.
อินดิเคเตอร์

Monday Candles [PhantomCipher]Monday Candles
Monday Candles colours every candle that opens on a Monday, so the start of each trading week is easy to spot. Many traders mark Monday's range and watch how price reacts to it through the rest of the week.
SNAPSHOT: the indicator on a clean daily chart, with several Mondays highlighted
How it works
Spot and perpetual markets: a candle is highlighted when it opens on a Monday in UTC.
Futures: a candle is highlighted when it opens on a Sunday in UTC. Futures sessions open on Sunday evening, and that session belongs to Monday's trading day.
Timeframes: on the daily chart the Monday candle is highlighted. On intraday charts every candle that opens during Monday (UTC) is highlighted, so the whole day stands out.
The check for a spot or perpetual chart is:
dayofweek(time, 'UTC') == dayofweek.monday
SNAPSHOT: an intraday chart (for example 1h) showing the full Monday session highlighted
Settings
Highlight Monday? Turns the highlighting on or off.
Highlight Color: the colour used for Monday candles (yellow by default).
Limitations
The day is always worked out in UTC. On markets with their own session times, such as gold (XAUUSD), silver (XAGUSD), some other commodities and some forex pairs, the highlighted candles may not line up with the market's actual Monday. The indicator is also not meant for weekly or higher timeframes, where one candle covers the whole week.
Example chart: BYBIT:BTCUSDT.P
This indicator marks days of the week. It's not a trading signal on its own, so combine it with your own analysis and risk management.
อินดิเคเตอร์

Auto Harmonic Patterns [AFD]
A harmonic shape is a starting point—not the whole story.
Auto Harmonic Patterns maps the formation, its price zone and prior trend context, then keeps the pattern's status separate from the levels price has touched.
What it shows
Twelve harmonic patterns in bullish and bearish shapes: Gartley, Bat, Alt Bat, Butterfly, Crab, Deep Crab, Cypher, Shark, Nen Star, 5-0, ABCD and Three Drives.
A Potential Reversal Zone (PRZ): the outer range of the pattern's price projections, not necessarily their overlap or a prediction of reversal.
A Setup marker when the checks pass: D inside the PRZ, the applicable X boundary, a confirming close off D without already leaving the D-to-C band and, when enabled, prior trend context. Setup describes those checks—not a trade recommendation. Non-Setup patterns can remain visible, but carry no Entry, Target or Stop levels.
Grouped labels for formations sharing D, with individual details in hovers. The table separates formation Status from Reached level touches.
How to read it
The detector compares confirmed swing-leg ratios with defined pattern ranges and your Ratio tolerance. Swing strength controls pivot sensitivity; an optional larger swing reading adds another scale on the same chart timeframe. Prior trend can use swing structure or a moving average.
Standard/Detailed enable triangle fill; Minimal hides it. Custom unlocks preset-controlled switches; unused controls are greyed out. Triangle transparency defaults to 60%, adjustable from 0% solid to 100% invisible whenever fill is enabled; finished patterns lose their fill. PRZ and level-box shading are separate. Hover for ratios and checks. Family/orientation filters hide drawings, not detection or pattern/lifecycle alerts. Projected-zone alerts are opt-in and require a drawn zone; level touches do not generate alerts.
The timing matters
A completed pattern appears only after D confirms—the relevant swing-strength number of bars later—and is drawn back to its earlier pivots. It was not available at D in real time. Optional forming patterns and projected D zones can change or disappear before completion.
Levels and size are calculations, not outcomes
Entry references the rounded confirmation close; Targets and Stop follow your settings. R means the C-to-D pattern distance, optionally ATR-capped—not Entry-to-Stop risk. These levels are configured geometry, not measured performance. A touch is not a fill or a win/loss; when Target and Stop are touched within one bar, their order is unknown.
Optional sizing rounds down to whole units using the configured budget, displayed Entry-to-Stop distance and instrument point value. The budget must already be in the instrument's currency. No FX conversion, fees, slippage, fill modelling or combined-position exposure is included. Unsupported values show unavailable.
Use standard time-based bars or candles. Available history, search settings and tracking limits affect coverage; this is not an exhaustive historical pattern catalogue.
About this release
Free and open-source under MPL-2.0. Auction Foundry's implementation combines Setup qualification, shared-D label handling and separate formation/level tracking; it does not claim ownership of harmonic methods. Pattern definitions draw on published harmonic work, including Scott Carney and Darren Oglesbee; internal components come from Auction Foundry's Classical Auto Chart Patterns and Fibonacci Confluence. อินดิเคเตอร์

Daily Key Reversal Levels (ThreeKay)# Higher-Timeframe Major Reversal Levels
## Release 1.0
Higher-Timeframe Major Reversal Levels is a TradingView indicator designed to identify prices where the market showed aggressive rejection on an important timeframe. Instead of plotting every pivot, high, or low, it looks for a pronounced wick, a close away from the wick's extreme, and meaningful follow-through in the opposite direction.
The result is a cleaner map of historically important supply, demand, and support/resistance flip levels.
## What the indicator detects
The indicator uses Daily candles by default. Optional 1-hour, 4-hour, weekly, and monthly sources can be enabled in Settings.
A price becomes a candidate level only when a higher-timeframe candle meets all of these conditions:
1. The rejection wick is large compared with the candle body.
2. The wick occupies a meaningful percentage of the candle's total range.
3. The candle closes away from the rejected extreme.
4. Price follows through in the opposite direction by the required ATR distance.
The tip of an upper rejection wick contributes to a supply zone, while the tip of a lower rejection wick contributes to a demand zone. Touches do not need to occur at the exact same tick: nearby wick rejections inside the ATR-sized price range are grouped, and the displayed line uses their average rejected price.
## Main advantages
- **Filters ordinary swing points:** A pivot alone is not enough. The market must demonstrate forceful rejection and follow-through.
- **Uses higher-timeframe structure:** Important 1H through monthly reactions can be viewed while trading on lower chart timeframes.
- **Adapts to volatility:** ATR-based thresholds scale automatically between different markets and price ranges.
- **Tracks repeated respect:** Each separate reaction strengthens the level and increases its line thickness.
- **Identifies role flips:** A level respected from both sides is colored purple, showing that former support became resistance or vice versa.
- **Shows confluence:** Labels identify the source timeframes, such as ` `.
- **Reduces chart clutter:** Nearby reactions are consolidated using an ATR-based merge tolerance.
- **Supports alerts:** TradingView can notify you when price approaches a qualified level.
## Reading the chart
- **Green — Demand:** Price aggressively rejected lower prices and reversed upward.
- **Red — Supply:** Price aggressively rejected higher prices and reversed downward.
- **Purple — Flip:** The same area has acted as both support and resistance.
- **`x2`, `x3`, etc.:** Number of separate qualifying reactions recorded near the level.
- **` `:** Higher timeframes that confirmed the area.
- **`best 2.40 ATR`:** Largest confirmed move away from the level.
Thicker lines represent levels with more qualifying reactions.
## Recommended setup
1. Open TradingView's Pine Editor.
2. Paste the contents of `Major_Reversal_Levels.pine` into a new indicator.
3. Save the script and select **Add to chart**.
4. Open the indicator's Settings menu.
5. Daily is enabled by default. Enable another source only if you also want its levels displayed universally.
6. Start with the default qualification settings, then adjust strictness for the market being traded.
## Suggested presets
### Balanced — recommended starting point
- Minimum confirming timeframes: `1`
- HTF bars allowed for reversal: `3`
- Minimum reversal move: `1.0 ATR`
- Separate reactions required: `1`
- Level merge tolerance: `0.60 ATR`
- Minimum wick/body ratio: `1.5`
This displays important single-event wick rejections while making repeatedly respected levels visually stronger.
### Strict confluence
- Minimum confirming timeframes: `2`
- Minimum reversal move: `1.5–2.0 ATR`
- Separate reactions required: `2`
- Minimum wick/body ratio: `2.0`
- Wick portion of candle: `0.40–0.50`
Use this when you want fewer levels with stronger historical evidence.
### More sensitive
- Minimum confirming timeframes: `1`
- Minimum reversal move: `0.75 ATR`
- Separate reactions required: `1`
- Minimum wick/body ratio: `1.0`
- Wick portion of candle: `0.30`
This can be useful for markets with smaller candles, but it will produce more levels.
## Settings explained
### Universal timeframe-level visibility
Each toggle controls whether levels detected from that source timeframe are displayed on the chart. For example, enabling Daily and Weekly allows those levels to remain visible while analyzing intraday charts.
**Minimum confirming timeframes** controls timeframe confluence. A value of `1` accepts a level from any enabled source. A value of `2` requires the same price area to be recognized by at least two enabled timeframes.
### Major-level qualification
**HTF bars allowed for reversal** is the number of completed source-timeframe candles used to confirm follow-through after the rejection wick. Increasing it allows slower reversals to qualify but increases confirmation delay.
**Minimum reversal move (ATR)** controls how far price must travel away from the wick before the level is accepted.
**Separate reactions required** determines how many distinct wick-rejection events must occur near the price. Use `1` for major single-event swings or `2–3` for repeatedly defended levels only.
**Level merge tolerance (ATR)** determines how close two rejected prices must be to count as the same area.
**Minimum wick/body ratio** measures the wick relative to the real candle body.
**Wick portion of candle** requires the wick to occupy a minimum percentage of the complete high-to-low range.
**Close away from wick extreme** ensures the candle did not finish near the rejected price.
**Minimum rejection-candle range (ATR)** filters out small candles whose wick may look large only because the body is unusually tiny.
## Alert setup
1. Select **Create Alert** in TradingView.
2. Choose this indicator under Condition.
3. Select **Approaching respected HTF reversal level**.
4. Choose the desired alert frequency and delivery method.
The alert distance is volatility-adjusted using the chart timeframe's ATR. Increase **Alert distance** for earlier warnings or decrease it for tighter notifications.
## Confirmation and repainting behavior
Levels are not accepted immediately when the wick forms. The indicator waits for the selected number of completed higher-timeframe candles to confirm that price genuinely moved away. After confirmation, the line is anchored to the original wick price and time.
This means a newly forming wick will not appear instantly. The delay is intentional and helps prevent weak, unfinished rejections from being labeled as major levels.
## Practical use
Treat the levels as areas of interest rather than automatic entry signals. When price returns to a level, look for confirmation from market structure, volume, momentum, or your normal execution model. Higher reaction counts and multi-timeframe labels indicate stronger historical evidence, but no level is guaranteed to hold.
This indicator is an analytical tool and does not provide financial advice or guarantee trading results.
อินดิเคเตอร์

Advanced Harmonic & RSI Reversal Scanner (Dual-Wave)Description:
Most harmonic indicators suffer from two fatal flaws: they clutter your chart with overlapping lines, and they blindly signal entries at Fibonacci levels without checking if the market is actually slowing down.
The Advanced Harmonic & RSI Reversal Scanner solves both problems. By combining precise Fibonacci geometry (to find the location of a reversal) with an RSI exhaustion filter (to time the exact moment of the reversal), this script prevents you from catching falling knives.
This is a clean, professional-grade scanner designed for traders who want high-probability setups without the chart spam.
🔥 Core Features
Dual ZigZag Engine: The script simultaneously scans a "Major" wave and a "Minor" wave. It prioritizes finding larger, macro setups first, but will automatically scale down to find minor setups if the broader trend is noisy.
Live Point D Tracking: Unlike standard scripts that wait for a pivot to be fully confirmed (which causes late entries), Point D dynamically tracks the live wick of the current candle. The Fibonacci ratios update in real-time as the candle moves into the Potential Reversal Zone (PRZ).
RSI Entry Confirmation: A pattern alone is not enough. The script will only fire a Bull ▲ or Bear ▼ entry signal if Point D forms and the RSI confirms momentum exhaustion (crossing over/under the oversold/overbought thresholds).
Dynamic Risk & Targets: Forget manual measuring. Upon an entry trigger, the script instantly calculates and plots your Take Profit and Stop Loss lines:
TP1: 38.2% retracement of the A-to-D leg.
TP2: 61.8% retracement of the A-to-D leg.
Risk (Stop Loss): Dynamically placed 20% beyond Point D's structural size, safely protecting you against deep extensions like Butterfly or Crab patterns.
Anti-Spam Charting: Built with a strict visual state-machine. When a live candle twitches, the script cleanly deletes and redraws its lines rather than overlapping them. Your chart remains crystal clear.
Smart History Stamping: Once a trade setup completes, the script permanently "stamps" the pattern and its target lines onto the chart so you can accurately backtest past performance.
📐 Supported Patterns
The scanner precisely calculates internal and external Fibonacci ratios to identify:
Gartley
Bat
Butterfly
Crab
AB=CD (Functions as a fallback priority if an XABCD structure is invalid)
💡 How to Trade with this Indicator
Wait for the Setup: Let the script map the X, A, B, and C yellow pivot nodes. Watch as it projects Point D.
Wait for the Trigger: Do not enter blindly. Wait for the colored "Bull ▲" or "Bear ▼" pill to appear. This means price has hit the PRZ and the RSI has hooked, signaling momentum is shifting.
Execute the Plan: Place your entry. Set your Stop Loss at the red Risk line.
Manage the Trade: Take partial profits or move your stop to breakeven when price hits the green TP1 line. Leave a runner for TP2. อินดิเคเตอร์

Liquidity Sweep Detector Liquidity Sweep Detector is a price-action based indicator designed to identify potential liquidity sweeps around recent highs and lows and highlight subsequent directional confirmation.
The indicator focuses on a simple market behavior: price may temporarily move beyond a recent high or low, take available liquidity, and then return inside the previous range. After detecting this event, the indicator monitors the following candles for confirmation of a potential directional move.
## How It Works
The indicator calculates recent highs and lows using a configurable lookback period.
A bullish liquidity sweep is identified when price moves below a recent low and then closes back above that level.
A bearish liquidity sweep is identified when price moves above a recent high and then closes back below that level.
After a sweep occurs, the indicator monitors a configurable number of candles for directional confirmation. A bullish confirmation requires price to move above the previous candle's high, while a bearish confirmation requires price to move below the previous candle's low.
## Main Features
• Recent liquidity high and low levels
• Bullish liquidity sweep detection
• Bearish liquidity sweep detection
• Sweep zones for visual reference
• Directional confirmation signals
• Configurable confirmation window
• Optional candle-body confirmation
• BUY and SELL markers
• Alert conditions for sweep and confirmation events
• Adjustable visual settings
## Settings
Liquidity Lookback controls how many previous candles are used to identify recent highs and lows.
Confirmation Window controls how many candles the indicator monitors after a liquidity sweep.
Minimum Sweep Wick controls the minimum relative wick size required for a sweep to qualify.
Strong Candle Body can be enabled to require stronger directional candle confirmation.
Visual settings allow users to display or hide liquidity levels, sweep labels, sweep zones, and confirmation markers.
## How to Use
The indicator is intended to help traders study price behavior around recent liquidity levels.
A typical bullish sequence is:
Recent Low → Liquidity Sweep → Reclaim → Bullish Confirmation
A typical bearish sequence is:
Recent High → Liquidity Sweep → Rejection → Bearish Confirmation
Users can combine these observations with their own market analysis, timeframe context, and risk-management approach.
## Limitations
Liquidity sweeps can occur without producing a sustained directional move. A confirmed signal does not guarantee a particular market outcome.
The indicator is based on historical price data and should be treated as an analytical tool rather than a prediction system. Market conditions can change rapidly, and users should independently evaluate each setup.
This script does not guarantee profits, accuracy, or future performance.
## Originality
The indicator combines recent liquidity-level detection, sweep recognition, configurable confirmation logic, and visual sweep zones into a focused price-action tool. Its purpose is to provide a clear framework for observing liquidity events and subsequent price behavior without relying on excessive chart elements.
This publication is intended for educational and analytical purposes and is not financial advice.
อินดิเคเตอร์

Three Drives Pivot Scanner [Trishul]1. Description
The Three Drives pattern is a structural price formation made up of three sequential directional drive-legs, each separated by a corrective retracement. Each successive drive extends beyond the last within defined Fibonacci proportions, while each retracement holds within a defined range relative to the preceding move. The completed structure is traditionally read as an exhaustion pattern, with the completion of the third drive forming a Potential Reversal Zone (PRZ).
Three Drives Pivot Scanner detects Three Drives structures automatically using a pivot based detection system and, provides two concurrent methods:
Pivot Confirmed — waits for the complete six-point structure to be confirmed.
Live Projection — projects the PRZ while the third drive is still forming and identifies when price first trades into the projected zone.
2. Features
Pivot-Based Structural Detection
Structural swing highs and swing lows are identified using Pine Script's built-in pivot functions. The pivot length is user adjustable, allowing the detector to be tuned from more reactive short-term structures to broader, slower moving structures. Confirmed pivots are stored in an array and evaluated sequentially to determine whether the resulting swing structure satisfies the Three Drives geometric requirements.
pivot high = ta.pivothigh(high, pivLen, pivLen)
pivot low = ta.pivotlow(low, pivLen, pivLen)
// default pivot length is 5.
// shorter pivot length produces more patterns,
Method 1 — Pivot Confirmed
The Pivot Confirmed method requires all six pivot points (start. three drives , two retracements) to already be confirmed pivots before plotting. This is the most structural complete interpretation but by nature introduces delay inherent in pivot confirmation. A confirmed pattern is rendered as a polyline connecting all six pivot points.
Method 2 — Live Projection
The Live Projection method is designed to identify the potential completion of a Three Drives pattern before the final drive is confirmed.
Once the first five pivot points have been established, Trishul calculates the Fibonacci based Projected Reversal Zone ( PRZ) for the anticipated third drive and projects that zone forward. Instead of waiting for a validated swing high/low on the current bar, the script actively scans forward bar-by-bar to identify the moment price first intersects the PRZ. This continuous, intra-bar scanning ensures the PRZ is never ignored or bypassed, capturing the earliest possible structural touch. The developing pattern is rendered as a bull/bear colored polyline with numbered drive labels (1, 2, 3) and a dashed projected-zone box. Unlike the Pivot Confirmed method, the Live Projection method does not require the third drive to subsequently become a confirmed pivot before the potential completion is identified. Both methods are plotted by default so users can compare and contrast their behavior, with the option to turn either one off.
Pattern Time–Price Symmetry
When in Live Projection, Trishul validates the Three Drives pattern using both price and time symmetry. It measures the bar width between Drive 1 and Drive 2 as a reference interval. To pass validation, the time elapsed between Drive 2 and Drive 3 must reach the projected reversal zone (PRZ) within a window of 0.5× to 2.628× that reference interval. Moves occurring too early lack structural development, while those taking too long break temporal symmetry and are rejected.
Pattern Age Filter
A maximum pivot array size and configurable maximum pattern bar-width settings keep only structurally recent patterns on the chart rather than accumulating stale historical ones indefinitely. 3. Future Development
Trishul is a demonstration of how a pivot-based architecture can be applied to automated pattern recognition. The underlying framework can be further expanded to identify or construct a variety of price structures including trend lines, channels and multi-leg patterns. Future planned development will extend the framework into harmonic pattern detection systems (Gartley, Butterfly, Bat, Crab, and others).
4. Default Settings
Pivot Point length: 5
Retracement Ratio: 0.5 - 0.886
Extension Ratio: 1.13 - 1.618
Tolerance: 0.9 - 1.1
3rd Drive Time Multiplier: 0.5 - 2.628
Max Pattern Bar Width: 300 bars
日本語概要 (Japanese Summary)
Three Drives Pivot Scanner は、3つの連続する推進波(ドライブ)と2つの調整波(リトレースメント)からなる構造的な価格パターンを自動検出する高機能インジケーターです。各波動はフィボナッチ比率に基づいて厳格に評価され、パターンの完成時にトレンド転換の可能性が高い領域である Potential Reversal Zone (PRZ) を形成します。内蔵されたジグザグ機能とピボットポイントのアルゴリズムを用いることで、相場の重要な節目を正確に捉えながら、ユーザーの設定に合わせたピボット長や比率の柔軟なカスタマイズを可能にしています。
本スクリプトの最大の特徴は、アプローチの異なる2つの検出方法をリアルタイムに同時提供する点にあります。6つすべての構造ポイントが完全に確定してから綺麗なパターンを描写する保守的な「Pivot-Confirmed」と、最初の5つのポイントから最終レッグの到達点を先読みして価格がPRZに達した瞬間にリアルタイム検知する「Live Projection」を搭載しています。これにより、確定済みの信頼性を重視するトレーダーと、未確定の段階から一歩先んじて反転ゾーンを狙いたいトレーダーの両方のニーズに同時に応えるインジケーターとなっています。
中文概要(Chinese Summary)
Three Drives Pivot Scanner 是一款結構分析指標,能自動檢測由三個連續推進浪(Drive)與兩個修正浪(Retracement)所組成的結構性價格形態。各個波段皆依據斐波那契比率進行嚴格評估,並在第三個推進浪完成附近形成可能發生趨勢反轉的目標區域(Potential Reversal Zone, PRZ)。該指標內建 ZigZag 功能與轉折點(Pivot Points)演算法,能精確捕捉市場的關鍵拐點,同時允許用戶根據自身需求,靈活調整轉折點長度、回撤與擴展比率及容許誤差。
本腳本的核心優勢在於同步提供兩種互補的偵測模式。保守的「Pivot-Confirmed」模式會等待所有六個結構點完全確認後,才在圖表上繪製出完整的形態,有效過濾虛假訊號;而「Live Projection」模式則在前面五個結構點成形時,便提前推算最終浪的落點,並在價格首次觸及 PRZ 預測分區的瞬間實時觸發告警。這項設計讓重視訊號確認的穩健型交易者,與傾向在形態完成前搶先佈局反轉點的左側交易者,都能兼顧各自的策略需求。
Disclaimer:
This script is a research tool for market structure analysis and educational purposes only. It does not constitute financial advice. Trading involves risk. อินดิเคเตอร์

BYO Pattern V1 [Trendoscope]🎲 Overview
BYO Pattern V1 (Build Your Own Pattern) is a highly flexible open-source indicator that empowers traders to design, define, and automatically detect custom geometric patterns based on Fibonacci ratios between zigzag pivots.
Unlike traditional harmonic or chart pattern indicators that come with fixed, pre-defined rules, this tool puts the power of pattern creation entirely in your hands. You choose the number of pivots (5 or 6), enable the specific ratio conditions you care about, set exact values or ranges, and the indicator scans the chart in real time for matching structures.
Default configuration is set to the classic Three Drives pattern, but you can reconfigure it in seconds to detect almost any ratio-based pattern — including custom variations of ABCD, Gartley-style structures, Three Drives, 5-0, or completely original patterns of your own invention.
🎲 Core Concept
The indicator works on the principle that many powerful reversal and continuation patterns can be described as a sequence of alternating pivots (X-A-B-C-D or X-A-B-C-D-E) whose price legs satisfy specific Fibonacci retracement or extension relationships.
You define those relationships. The script does the heavy lifting:
Builds a zigzag of the required depth
Extracts the most recent 5 or 6 pivots
Calculates the relevant Fibonacci ratios between those pivots
Validates them against your enabled ratio rules (with optional tolerance)
Draws the valid pattern with labels, ratio annotations, and a Potential Reversal Zone (PRZ)
This approach is especially useful for traders who want to:
Test proprietary ratio combinations
Adapt classical patterns to different markets or timeframes
Explore less common structures that commercial indicators ignore
Create rules-based patterns for systematic trading or research
🎲 Supported Pattern Structures
5-Pivot Patterns (X-A-B-C-D) - Classic XABCD-style and many harmonic variations.
6-Pivot Patterns (X-A-B-C-D-E) - Three Drives and more complex multi-leg structures.
🎲 Available Ratio Conditions
You can independently enable and configure the following ratios:
XAB - Retracement of XA by AB
ABC - Retracement of AB by BC
BCD - Retracement of BC by CD
CDE - Retracement of CD by DE (6 pivots only)
XAD - Retracement of XA by AD
XCD - Retracement of XC by CD
ABE - Retracement of AB by BE (6 pivots only)
ADE - Retracement of AD by DE (6 pivots only)
Each ratio can be set as:
An exact value (the Error Percent setting expands it into a tolerance band)
A range (Start Value → End Value)
At least one terminal ratio must be enabled depending on the pivot count (validation is enforced at runtime). For example,
5 pivot pattern should at least have one of the ratio enabled among BCD, XAD or XCD.
6 pivot pattern should at least have one of the ratio enabled among CDE, ABE and ADE
🎲 Key Features
Fully Customizable Pattern Definition — Name, pivot count, and all ratio rules
Error Tolerance — Built-in percentage tolerance for practical real-world matching
Log Scale Support — Calculate ratios on logarithmic scale when needed
Automatic Pattern Drawing - draws patterns with labelling of pivots and ratios
Potential Reversal Zone (PRZ) — Automatically calculated and displayed as a shaded box based on the active terminal ratios
Color Theme Support — Dark / Light theme with automatic color cycling so multiple patterns remain distinguishable
Duplicate Filtering — Prevents redrawing identical pivot sets
Summary Table — Live table showing pattern name, pivot count, active ratio ranges, and total patterns identified
Real-time or Confirmed Bars — Option to include or exclude forming bars
🎲 How Detection Works
A zigzag is calculated using the user-defined length.
When a new pivot is confirmed (and enough pivots exist), the script extracts the latest 5 or 6 points.
All relevant Fibonacci ratios are calculated.
Each enabled ratio is validated against its defined range (or exact value ± error percent).
If all enabled ratios pass validation and the pattern is not a duplicate of an already drawn one, it is accepted.
The pattern is drawn with the next available theme color, labels, ratio annotations, and PRZ (if applicable).
🎲 Settings Guide
🎯 Zigzag Group
Length — Controls the sensitivity of the underlying zigzag (higher = fewer, more significant pivots)
Depth - Depth of zigzag level 1 to be considered for recursive zigzag calculation. Higher depth will result in more recursive levels and hence will scan higher number of patterns. However, this will also slow down the algorithm and can lead to runtime errors
Use Real Time Bars — Include the current forming bar in calculations
🎯 Pattern Group
Title — Custom name that appears in the summary table and can help you identify different configurations
Number of Pivots — Choose 5 or 6
Error Percent — Tolerance applied when a ratio is set as an exact value
Log Scale — Use logarithmic price differences for ratio calculations
🎯 Ratios Group
Individual enable toggles + Start/End value inputs for every supported ratio
Only the ratios you enable are checked
CBE, ABE, and ADE ratios are only available for 6 pivot patterns
🎯 Display Group
Theme (Dark / Light)
Show / Hide Pivot Labels
Show / Hide Ratio Labels
Show / Hide Summary Table
🎲 Example Use Cases
Load the default Three Drives configuration and study how frequently it appears on your instruments
Recreate a classical ABCD pattern by setting 5 pivots and enabling XAB + ABC + BCD with the classic ratios
Design a proprietary 6-leg structure and backtest its appearance across multiple symbols
Use tight error percentages for high-precision setups or wider ranges for more frequent signals
You can also try out some other simple harmonic patterns. There are lots of educational ideas published in tradingview about harmonic ratios. One such example is Advanced Harmonic Pattern Ratios by cmjohnson36
However, the real power of this indicator is that you can build your own set of ratio combinations and come up with new patterns.
🎲 Important Notes
This is a detection and visualization tool. It does not generate buy/sell signals or manage trades.
Pattern quality still depends on the quality of the underlying zigzag. Experiment with different Length values.
For 6-pivot patterns, at least one of CDE / ABE / ADE must be enabled.
For 5-pivot patterns, at least one of BCD / XAD / XCD must be enabled.
Your Patterns. Your Rules. Design it. Detect it. Trade it. อินดิเคเตอร์

Terminator HarmonyGivTerminator Harmony
A time-projection tool that predicts when the day's next moves are likely to happen — a Fibonacci Time Zone engine anchored to the session open and the day's first expansion swing.
Most indicators tell you where price might go. Terminator Harmony tells you when. It measures the time it took the market to travel from the day's open to the first swing that launched a real expansion, then projects that rhythm forward across the rest of the session.
How it works
It's built on two anchors:
- Anchor 0 — the day open. Auto-placed at either midnight ET (true day open) or the Globex 18:00 ET futures open, your choice. In Globex mode it correctly grabs the most recent 18:00 at or before your swing (the prior evening if your swing is in the morning).
- Anchor 1 — the expansion swing. The first structural swing high/low that caused a relatively big leg of expansion. This is a discretionary read, so you place it with one click and it becomes a draggable dot — move it and the whole projection re-casts live.
The distance between them (base = Anchor1 − Anchor0) becomes the market's time "unit" for the day. The indicator then casts vertical zone lines forward at multiples of that base — the times where turns, exhaustions, and new legs tend to cluster.
Projection modes
- Equal steps (default) — evenly spaced zones (1×, 2×, 3×… the base).
- Fibonacci sequence — zones at 1, 2, 3, 5, 8, 13, 21… (classic Fib Time Zone spacing).
- Fib ratios — a fib-retracement ladder on the time axis: the two anchors (0 and 1.0, in orange) plus standard extensions past the swing — 1.272, 1.618, 2.0, 2.618, 3.618, 4.236, then the golden powers 6.854 (φ⁴) and 11.09 (φ⁵) so it spans the full day.
- Custom — type your own multiples (comma-separated).
Usage
Each day, drop the dot on that day's expansion swing and read the projected vertical lines as timing windows — moments to watch for reactions, rather than price levels. Built for the 5-minute chart. Anchor lines are orange, projected zones blue, each labeled with its multiple/ratio; colors, width, line style, and zone count are all configurable. อินดิเคเตอร์

Square Bar/Calendar Count Verticals (Gann)█ OVERVIEW
Square Bar/Calendar Count Verticals plots vertical time lines on the chart at squared counts measured from user-selected pivot anchors, in two independent units: trading bars and calendar days. The thesis, drawn from W.D. Gann's time-counting methods, is that elapsed time from a significant price extreme reaching a perfect square (81, 100, 121, 144, 289, 361) marks a date of elevated probability for a trend pause, inflection, or termination, and that the strongest of these dates occur where a bar-count square and a calendar-day square coincide.
█ HISTORY / BACKGROUND
Counting time in squares from major highs and lows originates with W.D. Gann, who treated time and price as interchangeable quantities and used the squares of small integers as recurring measures of trend duration. Constance Brown's published work on Gann analysis demonstrates the method in modern markets: bar counts of 9², 10², 11², and 12² projected from a swing extreme, a 17² calendar-day count from a significant low, repeats of the 144 count monitored from key pivots, and the square of 19 tracked as a separate helix cycle. This indicator implements that specific working set as a chart tool.
The conceptual basis is that these verticals are time factors only. They carry no directional information. Their value is realized when a squared count expires while price is simultaneously at a level identified by independent price-based methods.
█ HOW IT WORKS
1 — The user supplies a comma-separated list of roots (default 9,10,11,12,17,19). At the first bar the script parses the list and computes the square of each root.
2 — Each of up to three anchors is a timestamp selected on the chart. The anchor is resolved to a bar by containment: the anchor bar is the first bar whose closing time exceeds the anchor timestamp. This makes resolution independent of exchange timezone and safe when the timestamp falls on a weekend or holiday.
3 — For every anchor and every square s, the script computes two targets:
- a trading-bar target at anchor bar index + s (bar unit follows the chart timeframe), and
- a calendar-day target at anchor time + s days (independent of timeframe).
With inclusive counting enabled (default) the anchor bar or anchor day is counted as 1, so targets land at s minus 1 units after the anchor.
4 — When the root 12 is present and the repeat setting exceeds 1, additional verticals are drawn at 288, 432, and further multiples of 144, in both units, up to the chosen repeat count.
5 — On the last bar the script draws the verticals once: solid lines in bar-index coordinates for bar squares (projected up to roughly 490 bars into the future) and dashed lines in time coordinates for calendar squares (projectable to any future date). Each line carries a label naming the root, the square, and the unit. The anchor itself is marked with a heavier line and a date label.
6 — A status table reports, per active anchor, the elapsed count in both units and the next upcoming square in each unit, with the bars remaining and the calendar date.
7 — Three alert conditions fire on the bar that completes a bar-count square, the bar that contains a calendar-day square date, and the bar on which both occur together.
█ HOW TO USE
The verticals are appointments in time, not signals. The intended workflow:
- Anchor each slot on a significant swing extreme. Significance is an analytical judgment; the script deliberately performs no automatic pivot detection.
- Validate an anchor by inspecting the verticals already in the past. If historical squared counts from that anchor align with real pivots, the anchor is worth keeping. If they align with nothing, move or disable it.
- When price approaches an upcoming vertical, consult independent price analysis. A squared count expiring while price sits at a level derived from other methods is the condition of interest. A squared count expiring in open space warns at most of a pause or stall.
- The highest-weight event this tool can flag is the third alert: a bar square and a calendar square completing on the same bar.
Bar counts are timeframe-relative by design: the same anchor produces different bar-square dates on daily and weekly charts, and both are legitimate counts on their own timeframe. Calendar-day counts are identical on every timeframe. The tool is designed for daily and weekly swing analysis, where Gann's counts were applied; on intraday charts the calendar counts remain valid but bar counts become session-dependent.
Visual elements: solid vertical lines are trading-bar squares, dashed vertical lines are calendar-day squares, the heavy line with a date label is the anchor, labels above price name bar counts, labels below price name calendar counts, and the top-right table summarizes elapsed and upcoming counts.
█ SETTINGS
- Square roots: comma-separated integer roots to square. Default 9,10,11,12,17,19.
- Inclusive count: anchor bar or day counts as 1 when enabled. Default on.
- Trading-bar squares: show or hide bar-count verticals. Default on.
- Calendar-day squares: show or hide calendar-count verticals. Default on.
- 144-cycle repeats: number of 144 multiples to project; 1 disables repeats. Default 3.
- Anchor 1, 2, 3: enable flag, pivot timestamp (Anchor 1 prompts for a chart click on load), and line color per anchor. Defaults: Anchor 1 enabled, Anchors 2 and 3 disabled.
- Status table: show or hide the summary table. Default on.
- Label size: tiny, small, or normal. Default small.
█ WHAT MAKES IT ORIGINAL
Most Gann-count scripts plot a single count series in a single unit. This implementation differs in three specific ways. First, it runs trading-bar and calendar-day counts in parallel from the same anchor and explicitly detects their coincidence, which is the confluence condition emphasized in the source methodology rather than an afterthought. Second, anchor resolution uses closing-time containment instead of naive date equality, so anchors survive timezone differences, weekends, and holidays without silently shifting by one bar. Third, projection is handled correctly per unit: calendar squares are drawn in time coordinates and can therefore mark dates arbitrarily far in the future, while bar squares are drawn in bar coordinates and are projected only within the platform's future-bar range, keeping both unit systems accurate to their own definition.
█ NOTES / LIMITATIONS
- Drawings are created once per script load on the last bar. As new realtime bars form, elapsed counts in the table and newly reachable verticals refresh only when the script recalculates, for example after a settings change or chart reload.
- Bar-count verticals can be projected at most about 490 bars beyond the current bar, a platform ceiling on future bar-index coordinates. Calendar-day verticals have no such ceiling.
- The script draws up to 500 lines and 500 labels. Many roots combined with three anchors, both units, and repeats can reach this ceiling, at which point the oldest objects are removed.
- If an anchor timestamp predates the symbol's available history, the anchor resolves to the first available bar and every count measures from there, which is unlikely to be the intended pivot.
- Bar counts depend on the chart timeframe and on the symbol's session definition. Symbols with irregular sessions or many holidays will show bar squares and calendar squares diverging substantially, which is expected behavior, not an error.
- The indicator plots time factors only. It produces no directional forecast, and no claim is made about the outcome of price at any vertical. อินดิเคเตอร์

Gold Fibonacci Multiple Grid█ OVERVIEW
Gold Fibonacci Multiple Grid draws, on the price chart, a static grid of horizontal levels at Fibonacci-number multiples of a fixed base price, 35 currency units per ounce by default. The thesis under examination is an observation from technical analysis literature that gold has tended to reverse near prices equal to Fibonacci numbers times the 35 dollar official price fixed in 1934. The script renders the grid, identifies the nearest levels above and below the current price, and flags proximity; it does not assert that the observation is valid.
█ HISTORY / BACKGROUND
The Gold Reserve Act of 1934 fixed the official US dollar price of gold at 35 dollars per troy ounce. That price held through the two-tier market of 1968 and ended with the suspension of dollar convertibility in 1971, after which gold floated. Because 35 dollars was the last administratively fixed price, some technicians, including Robert Prechter, have used it as a permanent anchor and observed that subsequent multi-year turning points in gold have clustered near Fibonacci-number multiples of it, for example 55 times 35 equals 1925, 89 times 35 equals 3115, and 144 times 35 equals 5040. The observation is two sided: certain multiples have coincided with major highs while others have coincided with major lows, so each multiple carries a role, not just a price. Whether that clustering exceeds what random level placement would produce is an open empirical question. This script is a visualization of the hypothesis, built so the reader can inspect the historical record directly.
█ HOW IT WORKS
• On the first bar, the script generates the sequence of distinct Fibonacci numbers, 1, 2, 3, 5, 8, 13, 21, 34, 55, 89, 144, 233, 377, 610, 987 and onward, up to the configured count.
• Each level equals the base price times one Fibonacci number. The level prices are constants that never move or depend on price history. To keep the price scale usable, only levels inside the visible price range expanded by the range margin are drawn as horizontal lines extended across the whole chart. The possible turning multiples are exempt from the margin when the always-draw option is on, or automatically when the chart is zoomed out so the visible window spans at least the configured number of years; zooming back in hides them again. The script recalculates when the chart is scrolled or zoomed, so the drawn set follows the current view; levels outside the band remain part of every calculation.
• On every bar, the script computes the percent distance from the closing price to each level, records the nearest level, the nearest level above and the nearest level below, and detects whether the close crossed any level relative to the prior close.
• When the distance to the nearest level is at or below the proximity threshold, that level's line and label switch to the proximity color and gain width, and an alert condition becomes true on the first bar of the approach. A second alert condition fires on any bar whose close crossed a level. Every other drawn level is colored by its assigned role: three user-editable lists designate each multiple as a high target, a low target or a possible future turning level, multiples on no list use the neutral color, possible turning levels draw dashed, and labels append the assigned role.
• An optional table shows the nearest level above and below with their multiples and percent distances, the nearest possible turning level at or above the current price, and the distance to the nearest level. The exact distance is also exposed in the data window.
█ HOW TO USE
In plain terms, the script draws a ladder of fixed price rungs. Every rung is the old 35 dollar gold price multiplied by a Fibonacci number, so the rungs get further apart as price rises, roughly 62 percent apart, matching the way gold's swings have grown with its price. The claim being examined is that gold tends to stall or turn near these rungs. Scroll back through history and judge for yourself how often turns landed near a rung and how often they ignored the grid entirely. The table always tells you the next rung overhead, the next rung underneath, and how far away the closest one is. When price gets within the threshold of a rung, that rung lights up.
The grid is designed for charts quoted in US dollars per troy ounce of gold: spot gold, gold futures, or a gold index. The levels are timeframe independent; daily and weekly charts are the practical choices because the observation concerns multi-year turning points. Treat a highlighted level as a location of interest for confluence with independent analysis, not as a prediction of reversal. A level is one price; nothing in the script measures whether price will respect it.
█ SETTINGS
• Base price, currency units per ounce. Default 35. Every level is this value times a Fibonacci number. Changing it repurposes the grid for any anchored-multiple study.
• Number of Fibonacci multiples. Default 15, which spans 35 to 34545 at the default base. Maximum 20.
• Proximity threshold, percent of level. Default 2. Price within this percent of a level counts as at the level.
• Range margin, percent. Default 20. A level beyond the visible price extremes is drawn only when it lies within this percent of them, so the price scale stays close to the price data on arithmetic charts and a level appears overhead or underneath as price approaches it. Raising the margin draws more of the grid at the cost of scale headroom. Undrawn levels still participate in every calculation and in the table.
• High target multiples, comma separated. Default 21, 55, 144. Levels at these multiples always draw in the high target color.
• Low target multiples, comma separated. Default 1, 3, 8, 34, 89. Levels at these multiples always draw in the low target color. Multiples on no list draw in the neutral color.
• Possible turning multiples, comma separated. Default 233, 377, 610. Unreached multiples treated as possible future turning levels, drawn dashed in the possible turning color.
• Always draw possible turning levels. Default off. Forces the possible turning multiples on screen regardless of zoom, which expands the price axis on an arithmetic scale; a logarithmic scale is recommended while enabled. When off, the nearest possible turning level is still reported in the table.
• Auto-show possible levels when visible span exceeds, years. Default 10. When the visible window spans at least this many years, the possible turning multiples draw even though they lie beyond the range margin, and they hide again when the chart is zoomed back in.
• Show level labels. Default on. Each label states the multiple, the base, the resulting price and the assigned role.
• Show nearest-level table. Default on.
• High target color, Low target color, Possible turning color, Unassigned level color and Proximity color. Defaults red, green, blue, gray and orange. The table rows for the nearest level above and below inherit the role color of that level; the proximity color overrides the nearest level when price is within the threshold.
█ WHAT MAKES IT ORIGINAL
Fibonacci tools on this platform are almost always relative: retracements, extensions and fans measured between two user-selected swing points, which move whenever the anchors change. This grid is absolute. Every level is a constant derived from one historically fixed price and the integer Fibonacci sequence, so the entire level set is defined before any chart data is read, identical on every symbol and timeframe, and immune to anchor-selection bias. The script adds mechanical proximity detection, crossing detection and nearest-level reporting on top of the static grid, which turns a qualitative literature observation into an inspectable, falsifiable chart object.
█ NOTES / LIMITATIONS
• The levels are meaningful only on series quoted in US dollars per troy ounce. On gold ETFs, gold miners, or gold quoted in other currencies, the default grid does not correspond to the underlying observation; the base price would need to be redefined.
• The level prices are static constants and there are no lookahead or higher-timeframe requests. Which levels are drawn depends on the visible price range, so the drawn subset changes as the chart is scrolled or zoomed, and the script recalculates on each change of the visible range. Calculations, alerts and the table always use the full level set and are unaffected by the view.
• Proximity and crossing calculations use closing prices. On the developing bar they update until the close and do not change afterward.
• Labels are positioned a few bars past the last bar and reposition as new bars print. The table renders on the last bar only.
• The script draws at most 20 lines and 20 labels, far below platform object limits.
• Level spacing follows the Fibonacci sequence, so consecutive levels are roughly 62 percent apart at scale. Between rungs the script is silent by design.
• The default role assignments restate a published observation about which multiples coincided with historical highs and lows. The script does not verify the assignments, and both lists are editable.
• The script visualizes a hypothesis. It performs no statistical test of whether reversals near these levels occur more often than chance would produce. อินดิเคเตอร์

อินดิเคเตอร์

ZENKO Session FVG# ZENKO FVG — Session-Based Fair Value Gap
ZENKO FVG is a clean Fair Value Gap (FVG) indicator designed to help traders identify price imbalances within selected trading sessions while keeping the chart simple and easy to read.
The indicator was developed around the ZENKO trading approach, where Fair Value Gaps are used as potential areas of interest rather than standalone entry signals.
## Core Concept
A Fair Value Gap represents an imbalance created during strong price displacement. These areas may become relevant when price later revisits them as the market searches for liquidity or rebalances inefficient price delivery.
ZENKO FVG automatically detects these imbalances and displays them directly on the chart.
## Key Features
• Automatic Bullish & Bearish FVG Detection
Identifies three-candle Fair Value Gap structures automatically.
• Session-Based Filtering
Allows traders to focus on FVGs formed during selected trading sessions such as Asia and London, reducing unnecessary zones from outside the intended trading period.
• Clean FVG Zones
Bullish and bearish FVGs are displayed as clear zones without overcrowding the chart.
• FVG Midpoint
Each FVG can display its 50% equilibrium level, providing an additional reference point when price returns to the imbalance.
• Customizable Display
Users can adjust FVG colors, zone appearance, session settings and other visual parameters according to their chart preference.
• Multiple Timeframe Application
The indicator can be applied across different chart timeframes depending on the trader's execution model.
## ZENKO Trading Approach
ZENKO FVG is primarily designed to help locate higher-quality areas of interest.
A typical ZENKO workflow may involve:
Higher-Timeframe FVG → Price returns into the area → Liquidity reaction or sweep → Lower-timeframe imbalance / IFVG confirmation → Execution.
For example, a trader may identify an important FVG on M15 and then move to lower timeframes such as M1–M4 to look for additional confirmation.
The indicator itself does not determine whether a trade should be taken. Market structure, liquidity, displacement, session context and risk management should still be considered.
## Purpose
The main objective of ZENKO FVG is simple:
**Reduce chart noise and make relevant Fair Value Gaps easier to identify.**
Instead of manually marking every imbalance, traders can use the indicator to quickly visualize FVG locations and focus their attention on price action around those areas.
## Important
ZENKO FVG is an analytical tool and should not be treated as an automated buy or sell system.
Fair Value Gaps do not guarantee that price will react, reverse or continue from a specific level. Traders should combine the indicator with their own market analysis, confirmation criteria and risk-management rules.
Past market behavior does not guarantee future results.
**ZENKO — Find the imbalance. Wait for confirmation. Execute with discipline.** อินดิเคเตอร์

Reticle - Structural Reversal GridWhy This Works
Financial markets rarely move in uninterrupted straight lines. Asset prices expand in directional vectors, exhaust themselves, and retrace back toward their origins to trap counter-trend traders before continuing. Reticle is designed to map this structural reality geometrically.
Most traders rely on static, horizontal support and resistance levels. The Reticle engine relies on the mathematical squaring of time and price. By anchoring a vector to a verified structural leg (A to B), the script projects a dynamic diagonal trend floor (the "Death Line") and mathematically subdivides the entire move. Furthermore, historical testing across crypto and legacy markets consistently demonstrates that the 50% to 62.5% retracement band is the highest-probability zone for trend continuation to occur following a structural push.
How This Works
Reticle operates as a dual-engine geometric tracker:
The Anchoring Engine: It auto-detects the dominant macro swing (highest high and lowest low over a specified lookback period) to find the current active leg in the market. It marks the start of the move as Anchor A and the climax as Anchor B.
The Geometry Engine: Once A and B are locked, it draws an 8x8 fractional lattice to subdivide the zone, extends a golden Exhaustion Box highlighting the 50–62.5% retracement levels, and calculates the true geometric "Death Line." The slope of this line dynamically adjusts to the actual ratio of the move, preventing the distortion that usually ruins diagonal trendlines across varying chart scales.
How to Use Reticle
The primary utility of this script is finding high-confluence continuation entries and identifying exact structural invalidation points.
1. Finding Entries in the Exhaustion Zone
Wait for an impulsive move to define Anchors A and B. As the price pulls back from B, watch for it to enter the golden 50–62.5% Exhaustion Box. This is your strike zone. You want to see the price wick into this box and print a strong rejection candle that closes back outside of it. The box dynamically flares red the deeper price pushes into it, visually highlighting peak tension.
2. Managing the Trade via the Death Line
The red diagonal Death Line originating from Anchor A acts as the ultimate structural invalidation. It rises in tandem with time. If the asset respects its market geometry, it should bounce out of the Exhaustion Box and remain on the "safe" side of the Death Line.
3. Trading the Break
If a candle cleanly closes across the Death Line (marked on the chart by a red ✕), the geometric structure of that leg is broken. If you are in a trend-continuation trade, this is your hard exit signal. Conversely, advanced traders can use this Death Line break as an entry trigger to play the structural reversal.
Settings Guide
Every chart and asset breathes differently. Use these settings to perfectly calibrate Reticle to your chosen instrument.
Anchor Mode & MTF
Auto Anchors: Leave this checked to let the script find the A and B swing points automatically. Unchecking it disables the script until you define manual time anchors.
Use Higher Timeframe (MTF) Swings: A powerful feature that allows you to calculate the dominant A→B swing on a macro timeframe (like the Daily) while executing your trades on a lower timeframe (like a 40-minute chart) without losing the structural geometry.
Auto Engine: Choose between "Dominant Swing" (finds the absolute high and low of the lookback window) or "Latest Pivots" (strictly grabs the last two confirmed pivot points).
Dominant Swing Lookback / Pivot Strengths: Adjusts how many bars the script scans to define a swing. Increase these numbers to track massive macro trends; decrease them to trade rapid intraday micro-structures.
Engine Parameters & Squaring
Death Line Slope Basis: Dictates the math behind the red invalidation line.
Auto (A→B Ratio): Recommended. The slope perfectly mirrors the steepness of the structural push.
Squaring Factor: Forces the line to rise by a fixed, absolute price amount per bar, achieving true Gann-style 1x1 squaring.
True Squaring (Price Units per Bar): Active only if "Squaring Factor" is chosen above. Input exactly how many dollars/cents the line should rise per bar (e.g., 100 means a $100 climb per candle).
Death Line Angle ×: Multiplies the final slope. 0.5 acts as a 1x2 support line hugging price action. 1.0 acts as a steep 1x1.
Exhaustion Band Forward Extension: Determines how many bars into the future the golden retracement box is drawn.
Toggle Visuals: Checkboxes to hide or show the Lattice, the Band, the Death Line, and the A→B Vector Spine to keep your chart uncluttered.
Alerts
Select exactly which structural events you want to be notified about. Reticle features a unified alert system that ensures signals are only fired on confirmed candle closes to avoid false wick triggers.
Format Alerts as JSON: Check this box if you are connecting the indicator to automated trading bots via webhooks. It outputs a clean, machine-readable data payload instead of standard text.
Status Table
Show Status Table: Toggles the HUD panel that provides live data readouts regarding the current vector size, slope settings, and the exact percentage distance between current price and the Death Line invalidation.
Position: Move the data panel to any corner of the chart to prevent it from covering active price action. อินดิเคเตอร์

Fibonacci Vault [JOAT] JackOfAllTrades presents — Fibonacci Vault
A self-anchoring Fibonacci engine that locks onto the latest impulse leg and keeps the Golden Pocket glowing — no manual drawing.
━━━━━━━━━━━━━━━━━━━━━━━━━━━━━
◆ WHAT IT IS
Drawing Fibonacci by hand means re-anchoring every time structure changes. Fibonacci Vault does it for you: it identifies the most recent confirmed impulse leg , lays the retracement shelves automatically, and treats the Golden Pocket (0.618–0.65) as a first-class zone rather than a single line. It is a pure confluence tool — it maps levels, it does not print buy/sell signals.
This is 100% original code, written from scratch. It does not reuse any other author's Fibonacci script.
━━━━━━━━━━━━━━━━━━━━━━━━━━━━━
◆ HOW IT WORKS
1. Leg detection. The tool tracks confirmed swing highs and lows (using your chosen strength) and defines the active leg between the two most recent. Leg direction is inferred from which swing printed first — a low-then-high sequence is an up-impulse, and vice versa.
2. Size filter. A leg is only used if it is large enough — a minimum size expressed in ATR multiples — so the Vault anchors to meaningful impulses and ignores insignificant wiggles. As structure evolves, the anchor re-arms itself automatically.
3. The shelves. From the active leg, the standard retracements are projected: 0.236, 0.382, 0.5, 0.618, 0.65, 0.786, plus the 0 and 1 leg endpoints. Optional extension shelves at 1.272 and 1.618 project continuation targets beyond the leg.
4. The Golden Pocket. The 0.618–0.65 band is rendered as a glowing zone , and price trading inside it can optionally tint the background — the area many traders watch for reactions.
━━━━━━━━━━━━━━━━━━━━━━━━━━━━━
◆ WHAT YOU SEE
• Auto-anchored retracement shelves with optional price tags
• A glowing Golden Pocket zone and optional 1.272 / 1.618 extensions
• An impulse-leg line marking the anchor
• A resizable dashboard showing the active leg and direction, leg size in ATR, how far price has retraced (with a gauge), the Golden Pocket range and whether price is inside it, the nearest shelf, and the projected extensions
━━━━━━━━━━━━━━━━━━━━━━━━━━━━━
◆ HOW TO USE IT
• Use the shelves as confluence for entries, targets and invalidation — not as standalone signals.
• The Golden Pocket is the tool's focal zone; combine a pocket tap with your own trigger for a pullback entry.
• Extensions give objective targets once an impulse resumes.
• The retraced % readout tells you at a glance how deep the current pullback is.
• Works on all symbols and timeframes. Raise swing strength and the minimum leg size to anchor to larger structure only.
━━━━━━━━━━━━━━━━━━━━━━━━━━━━━
◆ NOTES & LIMITATIONS
Because the leg re-anchors on confirmed swings, the active leg updates as new structure is validated. Fibonacci levels are reference zones, not predictions — the tool is not financial advice and cannot guarantee a reaction at any level. Use it as confluence within your own method and risk plan.
— made with passion by officialjackofalltrade
อินดิเคเตอร์

Harmonic XABCD Pattern DetectorOverview
This overlay indicator scans the chart for classic XABCD harmonic formations using pivot-based structure detection. When a valid five-point pattern completes at pivot D, it draws the zigzag legs, labels key ratios, and optionally highlights the Potential Reversal Zone (PRZ) near D.
The script is designed for visual pattern recognition and education . It does not place orders, generate trade signals for automation, or guarantee future price behavior.
Supported patterns
Gartley
Bat
Butterfly
Crab
Deep Crab
Cypher
Shark
AB=CD
Three Drives (7-point structure)
Key features
Strict and Soft modes — Strict uses fixed Fibonacci ratio rules. Soft applies a user-defined percentage tolerance around standard harmonic levels.
PRZ box — Optional orange zone at D showing the projected reversal area.
Structural stop line — Optional stop reference beyond D based on CD leg size and ATR buffer (visual reference only).
Pattern score and confluence — Each completed pattern receives a quality score and a confluence count based on nearby pivot density.
See the Future — When X-A-B-C is complete but D is not yet confirmed, the script can project possible D zones for active setups.
On-chart table — Summary panel with pivot count, detection mode, pending projection status, average pattern score, and recent pattern history.
Alerts — Optional alerts for pattern completion, future zone touch, and possible formation in the projected D zone.
How detection works
The script identifies swing pivots using configurable left/right bar settings, then evaluates consecutive pivot sequences against harmonic ratio rules. A pattern is drawn only after the pivot structure and ratio checks pass the selected mode (Strict or Soft).
Important: Pivot D is confirmed only after the configured Pivot Right Bars have closed. Until then, price action near the projected zone is handled by the See the Future module, not as a completed pattern.
Main settings
Pivot Settings — Pivot left/right bars and maximum stored pivots.
Filter Settings — Minimum leg size (ATR multiplier) and ATR period.
Detection Mode — Strict vs Soft ratio control; Soft tolerance (%).
Pattern Filters — Enable or disable individual harmonic types.
Visual Settings — Labels, leg ratios, butterfly wings, PRZ, stop line, colors, and history table rows.
See the Future — Projected D zones, zone merge, touch markers, and extension length.
Storage — Maximum stored patterns for redraw and history.
Alerts — Toggle alert conditions for completion and future-zone events.
Analytics — Confluence ATR multiplier for pivot clustering near PRZ.
Alerts
Three optional alert conditions are available:
Pattern Completed — a valid XABCD (or Three Drives) formation is detected and drawn.
Future Zone Touched — price enters a projected D zone while XABC is still active.
Possible Formation — price reaches an extremum inside a projected D zone before D is confirmed.
Limitations
Harmonic patterns are subjective geometric models . Different pivot settings, timeframes, and tolerance modes will produce different results.
Overlapping patterns are filtered, but dense or choppy markets may still produce frequent redraws on setting changes.
The optional stop line is a structural visual reference , not a validated risk-management rule.
See the Future projections are hypothetical until pivot D is confirmed by the pivot engine.
This indicator runs on overlay=true and is intended for manual chart analysis on TradingView.
Disclaimer
This script is provided for informational and educational purposes only. It does not constitute investment advice, financial advice, trading advice, or a recommendation to buy or sell any instrument.
Trading involves substantial risk of loss. Past pattern occurrences do not guarantee future results. Always do your own research and consult a qualified financial professional before making trading decisions.
The author makes no warranties about the accuracy, completeness, or suitability of the detected patterns for any particular market or timeframe.
อินดิเคเตอร์

อินดิเคเตอร์

Hurst Cycles What it is . An implementation of J.M. Hurst's nominal cyclic model. Hurst's premise: price movement is partly the sum of several nested cycles of roughly fixed wavelength (20-day, 40-day, 80-day, 20-week, 40-week, 18-month, 54-month...), harmonically related — each roughly half the length of the next — plus an underlying trend and noise. The indicator detects each cycle's troughs from price pivots, marks troughs and peaks with stacked diamonds (peaks defined properly, as the highest high between consecutive troughs), draws each cycle as a sine wave phased to its last trough, sums the enabled cycles into a composite model line that rides the candles, projects expected future trough dates as vertical lines with a tolerance window, and offers FLDs (price displaced forward half a wavelength — crossings generate Hurst's classic targets). Wavelengths are defined in calendar days on the daily timeframe and auto-rescale so the same cycle structure appears on any chart timeframe.
How to use it properly. The workflow that matches how Hurst actually worked: start on the daily chart with everything at defaults and check whether the diamonds are landing near obvious lows — if the instrument's real cycles run consistently longer or shorter than nominal, adjust the wavelength inputs until troughs line up (Hurst expected the nominal values to be starting points, not universal constants). Then trade the synchrony: the meaningful moments are when several cycles trough together — the composite dipping while multiple vertical windows cluster in the same zone is the signal Hurst's whole method builds toward, and one cycle's window alone is weak evidence. Use the manual anchors as your judgment layer: pivot confirmation takes half a wavelength, so when you believe a major low just printed, enter its date and price and the model re-phases immediately — that's how you keep the projection current instead of half a cycle stale. And treat the tolerance windows as zones to watch for a turn with confirmation from price, never as dates to blindly buy.
Downfalls — read these before trusting it with money. The structural ones first: cycle troughs confirm half a wavelength after they occur, so every automatic phasing is backward-looking by design — the 18-month cycle's trough isn't machine-confirmed until ~9 months later (manual anchors are the workaround, but then the phasing is your opinion). Second, the tolerance window is a heuristic, not Hurst's statistics — real Hurst analysis derives timing variance from the instrument itself, and this ±% is a stand-in you should tune. Third, the model is phase-only: amplitude weighting is a wavelength-based approximation, and the composite says nothing about how far price moves, only roughly when it might turn. Fourth, pivot detection is mechanical — it will happily phase a cycle off a news-spike low that a human analyst would skip, and in strong trends the shorter cycles' troughs get dragged late (Hurst's own observation). Practical ones: future projections extrapolate calendar time from recent bar spacing, so on stock charts distant dates drift slightly since future weekends aren't skipped; the biggest cycles can't pivot-confirm on intraday charts (Pine's 5000-bar lookback limit) and rely on manual anchors there; history only draws as far back as bars loaded on your chart; and each new confirmed trough re-phases everything, so projections legitimately move over time — that's the method working, not the indicator glitching.
The honest framing . Cycle analysis is a minority view of how markets work — the academic mainstream is skeptical that fixed-period cycles persist, and even practitioners regard Hurst's model as a probabilistic timing framework, not a prediction machine. Its best use is narrowing when to pay attention and stacking confluence with your other analysis; its worst use is treating a vertical line nine months out as an appointment price is obligated to keep. Nothing it draws is financial advice, and the further into the future a projection extends, the more decorative it becomes. อินดิเคเตอร์
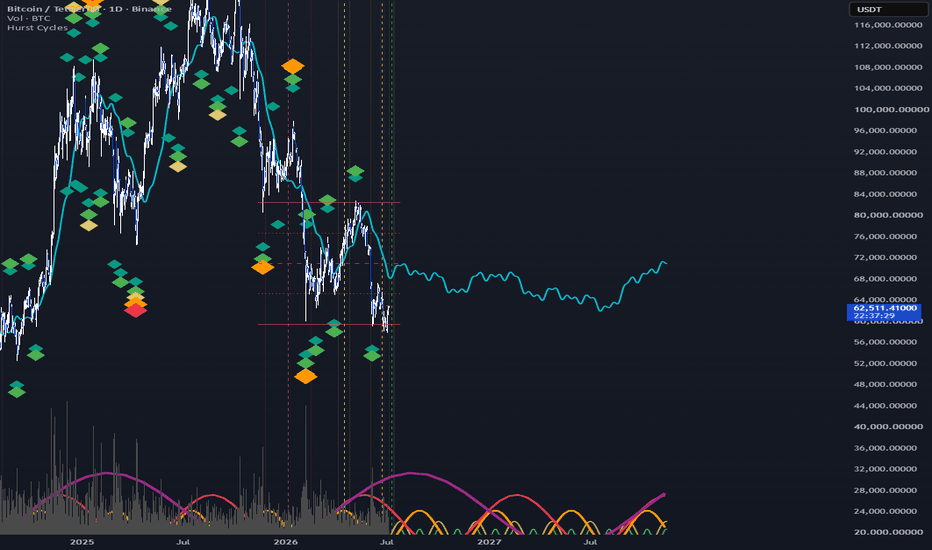
Adaptive Harmonic Ribbons# Adaptive Harmonic Ribbons (AHR)
Adaptive Harmonic Ribbons (AHR) is a trend and market structure indicator that replaces fixed moving-average lengths with an adaptive framework driven by the market's estimated dominant cycle.
Traditional moving-average ribbons, including GMMA-style approaches, use predefined periods such as 5, 10, 20 or 60 bars. While effective under stable conditions, these lengths represent a fixed assumption about market behaviour and must often be re-optimized when volatility or market rhythm changes.
AHR takes a different approach. Instead of using fixed lookback periods, it estimates the current dominant market cycle using a Hilbert Transform-based approach. Every moving average in the ribbon is then derived from that cycle, allowing the entire ribbon to expand and contract automatically as market conditions evolve.
Rather than changing only a single adaptive moving average, AHR adapts the entire ribbon while preserving proportional spacing through harmonic scaling. This allows the relationship between the ribbon layers to remain consistent across changing market regimes.
---
## Methodology
The indicator consists of four main components:
### 1. Dominant Cycle Estimation
The market's dominant cycle is estimated continuously using a Hilbert Transform implementation inspired by John F. Ehlers' work on digital signal processing. The measured cycle is constrained within user-defined minimum and maximum bounds to improve stability.
This dominant cycle becomes the reference period from which every ribbon length is calculated.
### 2. Harmonic Length Generation
Instead of manually specifying twelve moving-average periods, AHR generates them automatically.
Fast ribbon lengths are created by dividing the dominant cycle using a harmonic expansion factor.
Slow ribbon lengths are created by multiplying the dominant cycle by the same factor.
Because every ribbon layer is derived from the same adaptive reference, the spacing between layers remains proportional even as market conditions change.
The expansion multiplier can be adjusted to produce tighter or wider ribbon structures using relationships such as:
* Third-Octave (1.26)
* Half-Octave (1.414)
* Golden Ratio (1.618)
* Full Octave (2.0)
### 3. Adaptive Smoothing
Each ribbon layer can be calculated using one of several smoothing engines:
* SuperSmoother Filter (SSF)
* Three-Pole SuperSmoother (SSF3)
* EMA
* Double EMA (EMA2)
The adaptive framework remains unchanged regardless of the smoothing method selected.
### 4. Dynamic Ribbon Construction
The resulting fast and slow ribbon groups continuously adjust their lengths as the estimated dominant cycle changes.
Instead of requiring manual optimization for different symbols or timeframes, the ribbon geometry adapts automatically while maintaining its overall structure.
---
## Interpreting the Indicator
AHR is intended as a trend analysis and market structure tool rather than a signal generator.
Some common observations include:
Trend Agreement
When both ribbon groups slope in the same direction and maintain consistent separation, the market may be exhibiting directional strength.
Compression
When ribbon layers contract toward one another, the market may be entering a lower-volatility consolidation phase.
Expansion
When the ribbons begin separating after a period of compression, this may indicate increasing directional momentum.
Pullbacks
During established trends, price retracements into the fast ribbon or the space between ribbon groups can help traders evaluate whether trend structure remains intact.
As with any moving-average-based indicator, AHR should be used alongside broader market context and appropriate risk management.
---
## Inputs
Source
Price series used for all calculations.
Minimum / Maximum Dominant Cycle
Defines the allowable range for the adaptive cycle estimator.
Moving Average Type
Selects the smoothing algorithm used to construct the ribbon.
Expansion Multiplier
Controls the proportional spacing between ribbon layers.
Maximum Transparency
Adjusts the visual fading effect within each ribbon.
---
## Acknowledgements
This indicator draws inspiration from two well-established areas of technical analysis:
* John F. Ehlers' research into dominant cycle estimation, Hilbert Transform techniques and SuperSmoother filtering.
* Daryl Guppy's concept of separating market participants into fast and slow moving-average groups.
The adaptive ribbon construction, harmonic length generation, dominant-cycle-derived scaling, and dynamic ribbon framework are original components developed specifically for this implementation.
อินดิเคเตอร์

Astro: Planetary Time Projection [invincible3]Astro: Planetary Time Projection
Astro: Planetary Time Projection is a time-analysis indicator inspired by the market philosophy of W.D. Gann, who believed that markets are governed not only by price but also by recurring cycles of time.
Unlike traditional technical indicators that attempt to forecast future prices, this indicator is designed to project **potential market timing windows**. It starts from an important market high or low (the Anchor) and projects future dates based on the angular movement of selected celestial bodies.
The underlying idea is simple:
A significant market high or low establishes the starting point. As planets advance through specific angular distances from that anchor, the market may enter a period where a reversal, acceleration, breakout, or change in behavior becomes more likely.
The indicator does not predict price direction. Instead, it identifies when market participants may want to pay closer attention to price action.
-----------------------------------------------------------------------------------------------
Core Concept
The workflow follows four simple steps.
Step 1 — Identify an Important Anchor
Select a meaningful market event to use as the Anchor Date.
Typical anchors include:
• Major swing highs
• Major swing lows
• Bull market bottoms
• Bear market tops
• Long-term support or resistance reversals
• Breakout or breakdown dates
• Major economic or geopolitical events
The quality of the anchor often determines the usefulness of the projected timing windows.
-----------------------------------------------------------------------------------------------
Step 2 — Select One or More Planets
The indicator allows multiple planets to be enabled simultaneously.
Supported bodies include:
• Sun
• Moon
• Mercury
• Venus
• Mars
• Jupiter
• Saturn
• Uranus
• Neptune
• Pluto
• North Lunar Node
Each body moves at its own average angular speed, producing unique timing cycles.
-----------------------------------------------------------------------------------------------
Step 3 — Select Planetary Angles
Choose one or more angular projections.
Available presets include:
15°
30°
45°
50°
60°
72°
75°
87°
90°
115°
120°
144°
180°
216°
240°
270°
315°
360°
Custom angles may also be entered to support individual trading methodologies.
-----------------------------------------------------------------------------------------------
Step 4 — Project Future Time Windows
The indicator calculates the amount of time required for each selected planet to travel the chosen angular distance from the Anchor Date.
Those calculated dates are displayed as vertical timing lines on the chart.
These dates represent **potential periods of increased market significance**, where traders may observe:
• Trend reversals
• Trend continuation
• Breakouts
• Breakdown attempts
• Volatility expansion
• Momentum shifts
• Cycle completions
-----------------------------------------------------------------------------------------------
The Gann Perspective
W.D. Gann believed that markets exhibit recurring mathematical and natural cycles.
One of his enduring principles was:
"When Time is fulfilled, Price becomes vulnerable."
Rather than attempting to predict exact prices, Gann often focused on identifying moments when the market had completed an important time cycle.
This indicator adopts that philosophy by using planetary angular movement as a timing mechanism.
It does not assume that planets directly influence financial markets. Instead, planetary cycles are used as a structured and repeatable way to measure the passage of time from significant market events.
-----------------------------------------------------------------------------------------------
Time Projection Instead of Price Prediction
This indicator answers a different question than most technical tools.
Traditional indicators ask:
"Where might price go?"
Astro: Planetary Time Projection asks:
"When should I pay closer attention?"
The projected dates are intended to highlight periods where market behavior may become more dynamic. These dates should always be interpreted alongside price action and broader market context.
-----------------------------------------------------------------------------------------------
Time Confluence
One of the most valuable features of the indicator is the ability to enable multiple planets simultaneously.
When projections from different planetary cycles occur close together, a time confluence is created.
Many Gann practitioners consider these clustered periods to be more significant than isolated timing projections, as multiple independent cycles converge within a relatively short time window.
-----------------------------------------------------------------------------------------------
Repeat Cycle Projection
Markets often display repeating cyclical behavior over longer periods.
The Repeat Cycle option extends each selected planetary projection by additional 360° revolutions.
For example:
90°
450°
810°
1170°
-----------------------------------------------------------------------------------------------
This feature allows users to study both short-term and long-term timing relationships.
-----------------------------------------------------------------------------------------------
Forward and Backward Analysis
The indicator supports both:
Forward Projection
Projects future timing windows beyond the selected anchor.
Backward Projection
Projects historical timing relationships prior to the anchor, making it useful for research and historical cycle analysis.
-----------------------------------------------------------------------------------------------
Suggested Workflow
A common workflow is:
1. Identify a significant market high or low.
2. Set the Anchor Date.
3. Enable one or more planets.
4. Select the desired angular projections.
5. Observe where multiple planetary timing lines cluster.
6. Monitor those dates for technical confirmation using market structure, support and resistance, trend analysis, volume, or momentum indicators.
The indicator is intended to complement—not replace—traditional technical analysis.
-----------------------------------------------------------------------------------------------
Features
• Multiple planetary selection
• Planet-specific color coding
• User-defined Anchor Date
• Multiple angle projections
• Custom angular inputs
• Forward and backward projections
• Repeat 360° cycle projections
• Vertical timing windows
• Optional labels
• Lightweight TradingView implementation
-----------------------------------------------------------------------------------------------
Current Calculation Model
The current version estimates planetary movement using average angular speeds to generate practical timing projections within Pine Script.
It is designed as a lightweight and educational implementation suitable for market timing studies.
It is not intended to reproduce high-precision astronomical ephemeris calculations or professional astrology software.
-----------------------------------------------------------------------------------------------
Disclaimer
Astro: Planetary Time Projection is an educational market timing tool inspired by Gann's time-cycle methodology.
The projected dates identify potential timing windows, not guaranteed market reversals or price targets.
No indicator can predict future market movements with certainty. Users should combine this tool with sound technical analysis, disciplined risk management, and independent judgment before making trading decisions.
อินดิเคเตอร์

Triangle Pattern Scanner (Symmetric / Ascending / Descending)Triangle Pattern Scanner automatically detects and draws Symmetric,
Ascending, and Descending triangle formations on the chart in real time,
using pivot-based geometry validation to ensure only structurally sound
patterns are displayed. A multi-timeframe table shows at a glance which
triangle types are currently forming across five user-defined timeframes.
━━━━━━━━━━━━━━━━━━━━━━━━━━━━━━━━
BACKGROUND — WHY TRIANGLE PATTERNS?
━━━━━━━━━━━━━━━━━━━━━━━━━━━━━━━━
Triangle patterns are among the most widely recognized continuation and
reversal formations in technical analysis. They form when price makes a
series of pivot highs and pivot lows that converge toward a single apex
point, compressing volatility before a potential breakout in either
direction.
Identifying them manually requires drawing trendlines across multiple
pivots, verifying that price stays within the boundaries throughout the
formation, checking that the lines actually converge ahead, and
distinguishing between the three types based on the angle of each
boundary line. This indicator automates all of those steps.
━━━━━━━━━━━━━━━━━━━━━━━━━━━━━━━━
THREE PATTERN TYPES
━━━━━━━━━━━━━━━━━━━━━━━━━━━━━━━━
SYMMETRIC TRIANGLE
Both the upper trendline (connecting pivot highs) and the lower trendline
(connecting pivot lows) slope toward each other — the upper falling, the
lower rising. Neither side is horizontal. The pattern is considered neutral
until the breakout direction is confirmed. A symmetry ratio check ensures
the two slopes are reasonably balanced rather than one side being nearly
flat while the other is very steep.
ASCENDING TRIANGLE
The upper trendline is nearly horizontal (price repeatedly tests the same
resistance level) while the lower trendline slopes upward (higher lows).
The pattern is considered bullish by structure, with the expectation of
an upward breakout through the flat resistance. The angle tolerance for
the horizontal line is configurable, giving you control over how strictly
"flat" the upper line must be.
DESCENDING TRIANGLE
The lower trendline is nearly horizontal (price repeatedly tests the same
support level) while the upper trendline slopes downward (lower highs).
The pattern is considered bearish by structure, with the expectation of
a downward breakout through the flat support. The same configurable angle
tolerance applies to the lower line.
━━━━━━━━━━━━━━━━━━━━━━━━━━━━━━━━
HOW IT WORKS — TECHNICAL DETAIL
━━━━━━━━━━━━━━━━━━━━━━━━━━━━━━━━
PIVOT DETECTION
The indicator uses Pine Script's ta.pivothigh() and ta.pivotlow() to
collect recent swing highs and swing lows. The Pivot Length input controls
the symmetric left-right lookback used by both functions — a pivot high
requires the highest high compared to an equal number of bars on both
sides. Up to 8 recent pivots of each type are stored in memory for
pattern scanning.
GEOMETRY VALIDATION
For each combination of two pivot highs and two pivot lows, the indicator
calculates the slopes and intercepts of the upper and lower trendlines,
then verifies:
— Convergence: the two lines must actually meet ahead of the current
bar (apex in the future), not behind it
— Containment: every bar between the formation's start and end must
have its high below the upper trendline and its low above the lower
trendline — no violations allowed
— Slope direction: upper falling + lower rising for symmetric; upper
flat + lower rising for ascending; lower flat + upper falling for
descending
— Alternating pivots: the four pivot points (2 highs, 2 lows) must
alternate in time order (H, L, H, L or L, H, L, H) — this prevents
false formations where all highs come before all lows or vice versa
— Symmetry ratio (symmetric only): the ratio of the two slopes must
exceed a minimum threshold so neither side dominates
ANGLE NORMALIZATION
The angle calculation normalizes price change against the formation's
own height and bar count rather than using raw price differences. This
makes the angle tolerance behave consistently across different symbols,
price ranges, and timeframes — the same degree setting works on a $1
stock and a $50,000 asset alike.
DUPLICATE FILTERING
Once a valid formation is found, its starting bar position is recorded.
Any subsequent formation of the same type starting within a short
distance of an existing one is treated as a duplicate and skipped,
preventing the same structure from being drawn multiple times with
slightly different pivot combinations.
━━━━━━━━━━━━━━━━━━━━━━━━━━━━━━━━
MULTI-TIMEFRAME TABLE
━━━━━━━━━━━━━━━━━━━━━━━━━━━━━━━━
A table in the bottom-right corner runs the same pattern detection
logic across five user-defined timeframes simultaneously and displays
whether each triangle type is currently detected on each timeframe.
A ✅ marks a detected pattern; — means none found.
This gives you a fast structural overview without switching charts —
if the 1H and 4H both show an ascending triangle, that confluence may
carry more weight than a pattern on a single timeframe alone.
The MTF scan uses a sampled bar validation (checking approximately 12
evenly-spaced points within the formation rather than every bar) to
keep performance reasonable across multiple timeframes.
━━━━━━━━━━━━━━━━━━━━━━━━━━━━━━━━
HOW TO USE
━━━━━━━━━━━━━━━━━━━━━━━━━━━━━━━━
1. SET PIVOT LENGTH
Controls how significant a swing high or low must be. Lower values
(2–5) detect more frequent, shorter-term pivots. Higher values
(10–20) require more surrounding bars and detect only major structure.
2. SET LOOKBACK
Maximum bar span a formation can cover. Increase this to allow
larger, longer-term formations; decrease it to focus on recent
structure only.
3. ADJUST FLAT LINE ANGLE TOLERANCE
For ascending and descending triangles, this controls how strictly
the flat boundary must be horizontal. At 0° only perfectly
horizontal lines qualify; at 10–15° a moderate slope is allowed.
Increase if you want more patterns detected; decrease for stricter
horizontal requirement.
4. CONTROL MAX PATTERNS
Each pattern type has a separate maximum count. Set to 1 to show
only the most recent valid formation per type, or increase to see
multiple simultaneous formations.
5. SET LINE EXTENSION
How many bars beyond the formation the trendlines extend, giving
a visual projection of where the boundaries will be in the future.
6. READ THE MTF TABLE
Use the bottom-right table to check whether the same pattern type
is forming on higher timeframes, and prioritize formations that
appear on multiple timeframes.
━━━━━━━━━━━━━━━━━━━━━━━━━━━━━━━━
WHERE TO USE IT
━━━━━━━━━━━━━━━━━━━━━━━━━━━━━━━━
Works on any asset class (crypto, forex, equities, indices, commodities)
and any timeframe. Particularly useful for:
— Breakout traders who want to be positioned before a triangle resolves
— Swing traders looking for compression zones where volatility is
contracting ahead of an expansion move
— Multi-timeframe analysis where higher-timeframe triangle formations
provide context for lower-timeframe entries
— Market structure analysis where triangle patterns help define the
current phase of price action (consolidation vs. expansion)
━━━━━━━━━━━━━━━━━━━━━━━━━━━━━━━━
SETTINGS REFERENCE
━━━━━━━━━━━━━━━━━━━━━━━━━━━━━━━━
Pivot Length — symmetric lookback for swing high/low detection
Lookback — maximum bar span a formation may cover
Max Triangles (each) — maximum formations shown per pattern type
Show/Hide (each type) — toggle each pattern type independently
Line Width — visual thickness of the trendlines
Line Extension (Bars) — how far beyond the formation lines extend
Show Labels — enable/disable the formation labels on chart
Flat Line Angle Tolerance — horizontal strictness for ascending/descending
MTF Timeframes (TF 1–5) — the five timeframes scanned in the MTF table
━━━━━━━━━━━━━━━━━━━━━━━━━━━━━━━━
ORIGINALITY
━━━━━━━━━━━━━━━━━━━━━━━━━━━━━━━━
Triangle pattern detection is a known concept, but this indicator's
specific implementation combines several elements not commonly found
together: full bar-by-bar containment validation (not just endpoint
checking), alternating pivot order enforcement, normalized angle
calculation that works consistently across different assets and
timeframes, and a simultaneous five-timeframe detection table — all
within a single indicator. The flat-line angle tolerance using
formation-height normalization is the author's own approach to making
ascending and descending triangle detection robust across varied market
conditions.
━━━━━━━━━━━━━━━━━━━━━━━━━━━━━━━━
DISCLAIMER
━━━━━━━━━━━━━━━━━━━━━━━━━━━━━━━━
This indicator is intended for educational and analytical purposes only.
Triangle patterns do not guarantee a breakout in any particular
direction. Always use proper risk management and combine multiple forms
of analysis before making trading decisions. อินดิเคเตอร์

อินดิเคเตอร์