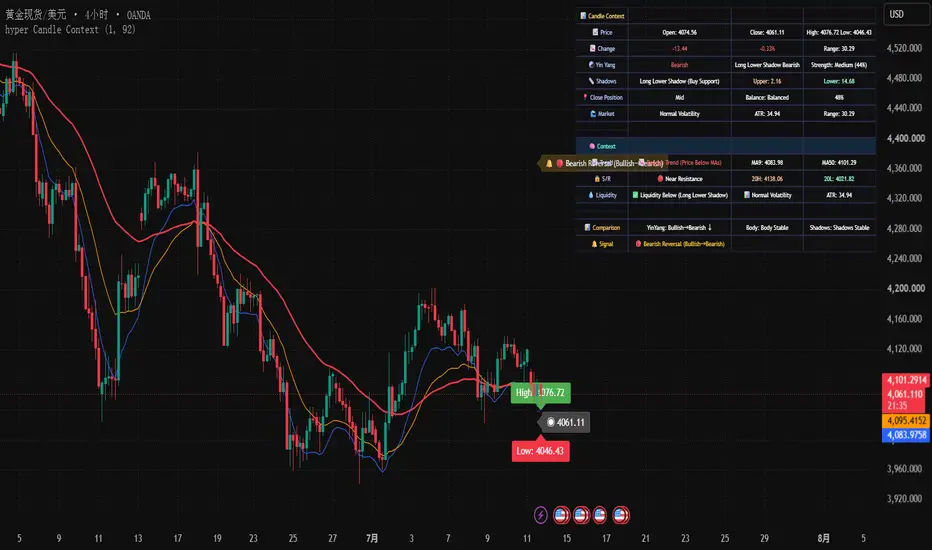
ATK/DEF Hyper Candle Context | Price Action Analyzer Hyper Candle Context is a comprehensive price action analysis tool to traders learning candle structure, market behavior, and current chart context through a multi-layer analytical dashboard.
This indicator focuses on pure price action observation by analyzing candle formation, including candle body strength, candle range, upper and lower wick behavior, closing position, volatility condition, and short-term market structure.
Unlike traditional indicators that rely mainly on mathematical oscillators, Hyper Candle Context focuses on reading the information contained inside each candle and presenting it in a structured way.
Candle Structure Analysis
The indicator evaluates candle characteristics through:
• Candle body size and strength
• Body-to-range percentage relationship
• Bullish and bearish candle balance
• Upper shadow and lower shadow analysis
• Doji and neutral candle identification
• Candle expansion and contraction behavior
These measurements provide a clearer understanding of how price is moving within each candle.
Price Action Context
Hyper Candle Context compares current candle behavior with previous candle information to highlight changes in market behavior:
• Bullish and bearish candle transitions
• Body strength changes
• Shadow development
• Momentum changes between candles
• Increasing or decreasing price pressure
This allows users to observe the evolution of candle behavior instead of looking at isolated candles.
Market Condition Analysis
The indicator includes market environment analysis using price volatility and range behavior:
• Current candle range compared with ATR volatility
• Narrow and expanding market conditions
• Volatility increase or decrease
• Market compression observation
This helps users understand whether the market is experiencing low activity, normal movement, or increased volatility.
Trend and Market Context
Additional context is provided through optional moving averages:
• EMA 9
• EMA 21
• EMA 50
The indicator displays the relationship between price and moving averages to help users observe general market alignment.
Support, Resistance and Liquidity Observation
The script monitors recent price areas and candle reactions:
• Recent high and low zones
• Potential support and resistance areas
• Upper wick rejection areas
• Lower wick reaction areas
• Liquidity-related candle behavior
These features are designed to assist manual chart analysis and market observation.
Information Dashboard
The built-in dashboard displays multiple layers of candle information:
• price data
• Candle direction
• Candle strength classification
• Candle pattern description
• Shadow condition
• Closing position
• Market volatility state
• Trend context
• Support and resistance context
• Liquidity observation
• Previous candle comparison
All information is organized into a visual dashboard for easier chart interpretation.
Designed For
Hyper Candle Context is designed for traders who learning:
• Price Action
• Candlestick analysis
• Market structure
• Volatility behavior
• Chart context
The indicator is intended as a visual analysis assistant to support independent market research and decision-making.
Important Notes
Hyper Candle Context does not provide trad decisions, outcomes, or advice.
It is a price action analysis tool designed to help users better understand current market information and develop their own interpretation of price behavior. อินดิเคเตอร์

Liquidity Sweep + TargetLiquidity Sweep + Target
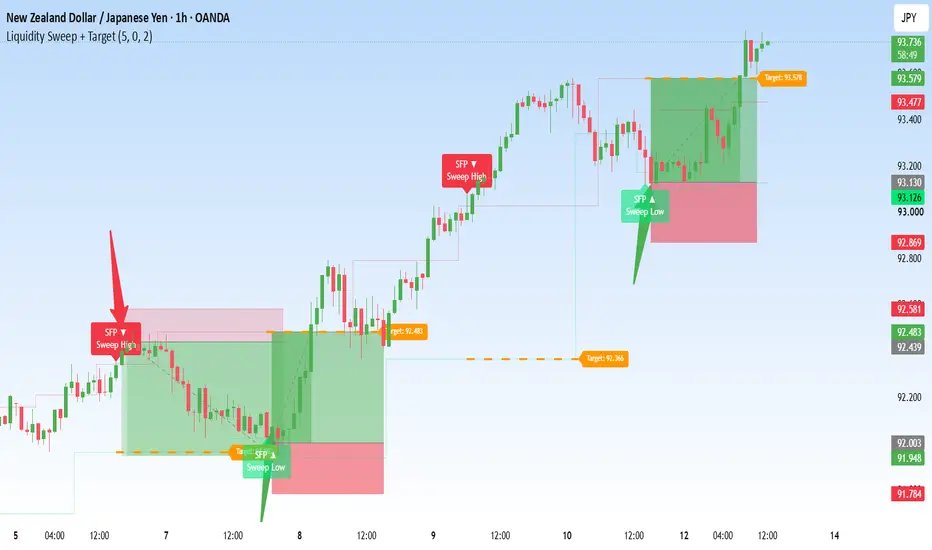
This indicator detects liquidity sweeps — moments where price wicks beyond a recent swing high or low to trigger stops/liquidity, then closes back inside the range (a classic stop-hunt / SFP pattern). Once a sweep is confirmed, the indicator automatically plots a target level for the expected reversal move.
How it works:
Identifies swing highs and lows using an adjustable pivot lookback.
Bearish Sweep: price wicks above the last swing high but closes back below it → signals potential downside reversal, target plotted below.
Bullish Sweep: price wicks below the last swing low but closes back above it → signals potential upside reversal, target plotted above.
Target calculation: choose between (1) the next opposite-side liquidity level (previous swing point) or (2) a fixed risk:reward multiple of the sweep range — fully configurable in settings.
Features:
Clean sweep labels (bullish/bearish) plotted directly on the chart
Dashed target lines with price labels
Adjustable pivot sensitivity, wick threshold, and RR multiple
Built-in alert conditions for both bullish and bearish sweeps
How to use it:
Wait for a sweep label to print, then look for confirmation (structure shift, momentum candle, or your own entry trigger) before acting on the plotted target. This tool identifies liquidity grabs — it does not predict direction with certainty, so always combine with proper risk management. อินดิเคเตอร์

อินดิเคเตอร์

Custom Built IndicatorCustom Built Indicator | MisinkoMaster
Trading is often viewed as a purely mathematical or technical discipline, but the truth is that successful trading requires immense creativity. There are thousands of brilliant traders who have incredible, unique structural concepts in their minds but feel held back because they do not know how to write code. The Custom Built Indicator (CBI) was created to bridge that gap.
This indicator acts as a blank, programmable canvas designed to unlock your inner quantitative designer. It is a fully modular trading framework that allows you to build, test, and personalize your own technical systems without touching a single line of code. By giving you absolute control over the baseline foundation, the volatility wrapper, the smoothing layer, and the conditional trend logic, CBI makes algorithmic design accessible to everyone. Think of it as trading art—a sandbox where you can bring your most detailed visual concepts to life, spark your curiosity, and perhaps even inspire you to take your first steps into learning Pine Script development.
How It Works: The Modular Sandbox
Instead of trapping you inside a single, rigid formula, CBI breaks down technical analysis into five independent, hot-swapping algorithmic layers:
Baseline Settings: This establishes the gravitational core of your asset's price action. You can set this baseline using standard moving averages, advanced low-lag options, mathematical centerpoints like the median or statistical mode, or even a pure historical price offset.
Volatility Settings: This dictates how your system measures market expansion and compression. You can wrap your baseline using standard range tools, pure standard deviation, or robust absolute deviation models to map out precise market extremes.
Smoothing Settings: A unique layer that allows you to smooth out the upper and lower boundary bands independently of the central baseline. Applying secondary smoothing allows you to create highly tailored, fluid bands that conform uniquely to market noise.
Trend Logic Settings: The brain of your strategy. Here, you decide exactly what constitutes a market regime shift. You can define trend conditions based on price breaking the outer channels, crossing the baseline, or even pure momentum acceleration.
Confirmation Filters: To minimize false signals, you can apply secondary algorithmic checks—such as volume verification, rate of change agreement, or candle validation—before any structural trend shift is confirmed.
An Ocean of Creative Possibilities
To understand just how massive this sandbox is, we can calculate the exact number of unique logical setups available. If we completely ignore all numerical values (like lookback periods or band multipliers) and only look at the dropdown menus, the sheer volume of structural combinations is staggering:
Baseline Type: 11 options
Volatility Type: 5 options
Upper Band Smoothing Type: 11 options
Lower Band Smoothing Type: 11 options
Long Signal Logic: 3 options
Short Signal Logic: 3 options
Confirmation Type: 4 options
The Custom Built Indicator provides exactly 239,580 unique, without numerical inputs, meaning everyone will have a completely unique layout that fits them and their style.
When you factor in that the crossover and crossunder source inputs can also be independently assigned to any price data point, the mathematical possibilities soar into the millions. Every single trader can find, name, and perfect a structural footprint that is entirely their own.
Key System Features
On-Chart Canvas Synchronization: The system automatically tracks your custom logical state and dynamically projects it back onto the screen, shifting candle colors and painting custom visual envelopes to represent your unique market regime.
Asymmetric Modeling: Because the upper and lower multipliers and smoothing options are completely separated, you can build asymmetric strategies—such as tight, highly sensitive upper boundaries for fast momentum breakouts combined with wide, volatile lower boundaries to catch major macroscopic market drops.
Forward-Looking Integration: The conditional logic allows you to experiment with advanced structural confirmations, such as requiring two consecutive breakout bars or demanding expanding volume before confirming a trend pivot.
Input Parameters Layout
General & Baseline Settings
Source: The primary price feed running into your system core.
Baseline Type & Lookback: Chooses the foundational trend line, offering options ranging from traditional SMA, EMA, and WMA, to advanced zero-lag options like TEMA, HMA, ALMA, or statistical Mode and Median.
Volatility & Smoothing Settings
Volatility Type & Lookback: Defines the range measurement matrix (Average True Range, Median True Range, Standard Deviation, Mean Absolute Deviation, or Median Absolute Deviation).
Upper & Lower Multipliers: Independently scales the distance of the bands from the baseline.
Additional Smoothing Type & Lookback: Provides an extra filtering pass specifically for the outer bands to eliminate jagged lines and smooth out execution zones.
Trend Logic Settings
Crossover/Crossunder Source: Selects the specific price sources required to breach the upper and lower boundaries.
Long/Short Signal Logic: Sets the core activation condition (breaking bands, crossing the baseline, or tracking positive/negative rate of change).
Confirmation Type: Applies an optional secondary validation layer (Volume, Baseline ROC, or Extra Bar validation).
Embrace the Art of Strategy Design
The ultimate goal of the Custom Built Indicator is to prove that technical analysis doesn't have to be rigid or intimidating. It is a playground for your ideas. Load it onto your chart, test out your most unconventional theories, mix architectures that traditional packages keep separate, and discover what works for your unique visual style. If you find a combination that speaks to you, use that spark to look under the hood—because the journey from clicking options to writing your own custom scripts is much shorter than you think.
Disclaimer: Trading financial markets involves high risk. This technical script is designed as an educational and informational tool to support your rule-based mechanical execution system and does not constitute financial advice.
Final Note: If you find any bugs, errors, contact me either through DMs or in the comments, and I will fix them and update the script. อินดิเคเตอร์

Liquidity Radar Engine [MarkitTick]💡 The financial markets operate on a continuous search for liquidity, moving dynamically from areas of consolidation to zones of unmitigated resting orders. This technical evaluation tool is engineered to objectively map these critical liquidity thresholds and provide a comprehensive framework for identifying high-probability market reversals and continuation phases. By tracking the exact interaction between historical pivot structures and real-time volume dynamics, it offers a highly systemic, algorithmic approach to charting price action.
✨ Originality and Utility
● A Synergistic Approach to Market Dynamics
Standard technical tools typically evaluate a single dimension of market data, such as momentum or trend direction, which frequently leads to fragmented analysis and false signals. This script stands out by synthesizing pure price structure, volume delta approximation, and multi-timeframe consensus into a unified visual environment. It removes the guesswork from order block and liquidity trading by mathematically defining structural shifts.
• Justification of the Integrated Logic
This tool is a deliberate fusion of price action concepts and mathematical volume filtering. Relying strictly on a breakout of a previous day's high or low can be highly susceptible to false moves and liquidity traps. By incorporating a relative volume (RVOL) filter and a proprietary candle-based delta estimation, the tool validates structural shifts with quantifiable market participation. Additionally, the inclusion of momentum divergence protocols ensures that price action is aligned with the anticipated structural pivot, filtering out low-probability setups in exhausted trends.
🔬 Methodology and Concepts
● Core Analytical Framework
The script operates by mapping significant price extremes across varying temporal horizons and evaluating the market's precise reaction when these zones are breached.
• Liquidity Sweep Detection
The algorithm constantly monitors the Highs and Lows of the Previous Day, Week, and Month. When current price action breaches one of these levels but fails to sustain the breakout—closing back inside the defined range—a sweep zone is generated. This defines a failed auction mechanism where stops may have been triggered without genuine directional follow-through from larger market participants.
• Equal Highs and Lows (EQH/EQL)
To identify resting liquidity pools, the script evaluates historical pivot points within an adjustable lookback window. Using the Average True Range (ATR) as a dynamic tolerance threshold, it mathematically defines whether two separate swing points are functionally "equal," marking them as magnetic targets for future price action.
• Structural Shifts and Displacement
Once a sweep occurs, the engine scans for a localized Change in State of Delivery (CISD). A valid shift requires displacement, which is measured by comparing the breakout candle's body size against a moving average of recent candle bodies, or by the immediate formation of a Fair Value Gap (FVG).
• Multi-Factor Validation
Signals are not generated strictly on price structure. They must pass a rigorous matrix of internal filters:
Relative Volume (RVOL): Requires the sweep or shift to occur with volume significantly exceeding the recent moving average.
Cumulative Volume Delta (CVD): Approximates buying and selling pressure within the candle spread to confirm directional momentum.
Trend Alignment: Evaluates the current price against a long-term Exponential Moving Average (EMA).
Volatility Squeeze Avoidance: Uses ATR ratios to actively block signals in exceptionally low-volatility environments.
Currency Correlation: Compares the traded pair against a reference index to ensure macroeconomic alignment.
News Blackout: Blocks all signals during user-defined, high-impact news windows to protect against erratic slippage.
🎨 Visual Guide
● Chart Elements and Topography
The visual interface is meticulously designed to present complex, multi-dimensional data without obfuscating the primary candlestick action.
• Historical Liquidity Levels
PDH/PDL Lines: Displayed as subtle, translucent lines indicating the Previous Day's High and Low.
PWH/PWL Lines: Denoting the Previous Week's extremes in distinct, moderately visible hues.
PMH/PML Lines: Marking the Previous Month's extremes for macro higher-timeframe context.
Equilibrium Line: A distinct midline drawn between the daily extremes to gauge intraday premium and discount pricing.
• Structural Zones and Markers
Sweep Zones: Highlighted boxes marking the exact area of a failed breakout. Buy-side sweeps appear in a muted green-toned box, while sell-side sweeps are marked in a red-toned box. These zones feature active aging, gently fading as time progresses.
FVG Clouds: Displayed as gold or yellow background areas denoting supply/demand imbalances.
EQH/EQL Markers: Small textual annotations above or below the price, bounded by a semi-transparent box, indicating concentrated liquidity pools.
• Execution and Management Visuals
Signal Labels: Distinct text markers indicating validated Buy or Sell conditions upon bar close.
Position Boxes: When a signal is active, a structured box appears showing the Entry level (dashed neutral line), Stop Loss (dashed red line), and up to three Take Profit targets (dashed teal lines).
Heatmap Candles: The main chart candles are dynamically colored based on the dominant daily bias or RSI momentum.
• The Multi-Timeframe (MTF) Dashboard
A tabular data panel positioned on the chart displays the trend and liquidity status across three distinct timeframes. It also features a comprehensive statistics section monitoring the active trading session, the current volatility regime, the count of unfilled fair value gaps, and the dynamic risk-to-reward ratio of any open simulated positions.
📖 How to Use
● Interpreting the Data
The primary workflow involves observing the direct interaction between price velocity and the mapped structural zones.
• Executing an Analysis
Wait for a visual Sweep Zone to form, indicating that a significant historical level has been tested and rejected by the market.
Observe the Signal Labels. A signal is only printed if the internal confluence engine—validating volume, delta, and structural displacement—has fully approved the setup.
If the FVG entry model is active, wait for price to retrace into the highlighted Fair Value Gap cloud before considering the setup valid for engagement.
• Trade Management
Utilize the plotted Position Boxes to evaluate the mathematical risk profile. The entry, stop loss, and targets are drawn directly on the chart for immediate visual feedback.
Monitor the MTF Dashboard to ensure the lower timeframe execution signal is not fighting a dominant higher timeframe trend.
If Dynamic Trade Management is enabled, closely observe the Stop Loss line as it automatically trails price based on the selected ATR, Swing, or Chandelier mathematical logic.
⚙️ Inputs and Settings
● Configuration Options
The script is heavily modular, allowing for extensive adjustment of its internal validation logic.
• General and Display Limits
Toggle the visibility of specific liquidity levels (Daily, Weekly, Monthly) and limit the maximum number of historical zones, FVG clouds, or signal boxes retained on the chart to maintain a highly optimized workspace.
• Validation Filters
Volume Validation: Adjust the Moving Average length and the RVOL threshold multiplier to define what constitutes a genuine volume climax.
Delta Filter: Toggle the requirement for estimated volume delta to perfectly align with the signal direction.
Divergence Source: Choose whether the script requires RSI, MACD, or a combination of both to display divergence before validating a reversal.
ADX Threshold: Define the strict minimum trend strength required for continuation signals.
• Target and Management Settings
Risk to Reward (R:R) Inputs: Define the exact mathematical multiples for Target 1, Target 2, and Target 3.
Position Sizing: Input an account balance and risk percentage to have the engine calculate the exact unit size for the plotted setup.
Trailing Logic: Select between None, ATR-based, Swing-based, or Chandelier-based trailing stops, complete with user-defined multiplier adjustments and partial profit scaling.
• Dashboard and Visual Preferences
Modify the specific timeframes monitored by the MTF panel, alter its position, and heavily customize the color palettes for all sweep zones, lines, heatmaps, and interface text.
🔍 Deconstruction of the Underlying Scientific and Academic Framework
● Theoretical Foundations
The architecture of this script is grounded in several well-documented financial theories, primarily focusing on Auction Market Theory and the statistical modeling of price volatility distributions.
• Auction Market Theory and Liquidity
The core premise of the sweep detection logic rests securely on the concept of order matching and liquidity cascades. Markets move constantly to facilitate trade, frequently gravitating toward areas with a high density of resting stop orders, such as historical highs and lows. When these areas are breached but fail to attract aggressive participation, the auction process is deemed to have failed. This script mathematically quantifies these failed auctions by tracking the spatial relationship between the breakout wick and the closing price relative to the historical pivot.
• Statistical Variance and Normalization
The tool heavily utilizes the Average True Range (ATR) as a core normalization factor. Financial time series exhibit continuous heteroskedasticity, meaning volatility varies over time. Hardcoding a fixed point-value for concepts like "Equal Highs" or "Trailing Stops" is mathematically flawed. By utilizing ATR ratios, the algorithm rapidly adapts its spatial thresholds to the current standard deviation of price movement, ensuring highly consistent behavior across varying market regimes and asset classes.
• Momentum Divergence and Rate of Change
The inclusion of oscillators like the Relative Strength Index (RSI) and Moving Average Convergence Divergence (MACD) serves to measure the first and second derivatives of price—specifically velocity and acceleration. By actively requiring a divergence between price extremes and momentum extremes, the script effectively filters for environments where the kinetic energy of the prevailing trend is decaying, thereby increasing the statistical probability of a mean-reverting event or structural reversal.
• Volume Delta Approximation
While granular tick data is technically required for an exact volume delta calculation, the script employs a highly robust approximation algorithm that distributes volume proportionally across the candle's spread. This provides a quantifiable metric of localized supply and demand imbalances, adhering strictly to the Wyckoffian principle of Effort versus Result, ensuring that price moves are backed by actual transactional weight.
⚠️ Disclaimer
All provided scripts and indicators are strictly for educational exploration and must not be interpreted as financial advice or a recommendation to execute trades. We expressly disclaim all liability for any financial losses or damages that may result, directly or indirectly, from the reliance on or application of these tools. Market participation carries inherent risk where past performance never guarantees future returns, leaving all investment decisions and due diligence solely at your own discretion. อินดิเคเตอร์

Capitulation Stretch Reversion [Jayadev Rana]OVERVIEW
Capitulation Stretch Reversion is a long-biased, price-action mean-reversion strategy. Its thesis is simple: in an established uptrend, sharp multi-bar pullbacks that stretch price well below its short-term mean tend to snap back. The strategy waits for that stretched, capitulating condition, enters on the first sign of a turn, and exits when price reverts to the mean.
Everything is derived from raw price and range (EMAs of price and Average True Range) - there are no oscillators or external data.
HOW IT WORKS
1. Regime filter. A long EMA (default 200) defines the regime. Long trades are only permitted while price is above it, keeping every entry aligned with the prevailing drift. A symmetric short side exists but is OFF by default (see Direction).
2. Stretch + capitulation. A setup can only arm when price has extended at least a set number of ATRs below a short reversion mean (default 0.5 x ATR from a 5-EMA) AND has printed a run of consecutive lower closes (default 2). This is the "capitulation" filter - it avoids buying shallow noise and waits for a genuine flush.
3. Entry. When the stretched, capitulating condition is met and the current bar closes back up (a reversal bar), a long is taken on the confirmed bar.
4. Exit - three ways. The target is a reversion to the mean: the position is closed once price closes back at or above the reversion EMA. A protective stop sits a wide, volatility-based distance below entry (default 3 x ATR). A time stop closes any trade that has neither hit target nor stop within N bars (default 10).
WHY THE STOP IS WIDE
Mean reversion trades a high hit-rate against an unfavourable reward-to-risk: the target (a snap back to the mean) is near, while the protective stop is deliberately wide so normal wobble does not knock you out. This produces frequent winners but occasional losers that are larger than a typical win. That trade-off is intentional and is shown honestly in the results below - read the LIMITATIONS section carefully.
BACKTEST (defaults, on the loaded history)
Tested on SPY daily with the default inputs and the properties set in the script (10,000 initial capital, 100% of equity per trade, 0.03% commission, 2 ticks slippage). On the sample available in the Strategy Tester this produced roughly a 67% win rate with a profit factor near 1.67, a max drawdown around 10%, and no margin calls, modestly ahead of buy-and-hold over the same window. This is a limited in-sample backtest, not a forward result - your own data window, symbol, fees and fills will differ.
SETTINGS
Regime EMA Length - trend filter that gates entries.
Reversion Mean Length - the EMA used as the snap-back target.
Stretch (ATR from mean) - how far price must extend before a setup arms.
Capitulation Bars - consecutive closes required to confirm exhaustion.
Protective Stop (ATR) and Time Stop (bars) - the exit envelope.
Direction - Trade Longs (on) and Trade Shorts (off by default; counter-trend shorts on up-drifting index ETFs have a much lower hit-rate).
Dashboard - live regime, position, win rate, profit factor and net profit.
LIMITATIONS
Signals are evaluated on bar close, not intraday. The reported win rate is in-sample on a finite history and will not persist unchanged out of sample. Because winners are small and losers wide, a cluster of stopped trades can still produce a meaningful drawdown despite a high win rate - position size accordingly. Percent-of-equity sizing at 100% is for demonstration; use realistic risk-based sizing in practice. Mean reversion underperforms in strong, one-directional trends where price never stretches, and can suffer if a pullback turns into a full regime change. This script is a research and educational tool, not financial advice or a guarantee of future performance.
ORIGINALITY
The contribution is the specific combination: an ATR-normalised "stretch" distance from a fast mean, gated by a consecutive-lower-close capitulation count and a regime filter, with a mean-touch target against a wide ATR stop and a time stop. It is built from first principles on price and range, not a wrapper around a built-in indicator. กลยุทธ์

อินดิเคเตอร์

Stryk TrendsStryk: ATR Trends
Everything in this tool is measured in units of one master ATR. Change that one length and the whole indicator retunes together — the candle coloring, the compression reads, the reversal checks, and the trailing stop all use the same yardstick.
What it is
At the center is a composite value line: a weighted blend of seven EMAs (8 through 144) and a rolling volume-weighted average. The VWMA leans the line toward where volume actually transacted, and its window can auto-size to your chart timeframe so it covers a similar span whether you're on the 1-minute or the daily. Price tends to return to this line, and the whole tool reads price against it.
Candles color by distance from that line. Near it, they're neutral. The further price stretches away, the deeper the up or down color gets, reaching full saturation at a set ATR distance. A signal can also flip the candles to a solid color temporarily, so you can run the tool with every line hidden and still get the read from the candles alone.
The engines
Compression coil. A dedicated ATR is ranked into a percentile. When it compresses into the bottom of its range, the market is coiled. When the coil releases and price is at the same time over-extended from the composite, a fade marker prints back toward the line. One fire per release, inside a short window. A second marker can print if volume steps up afterward.
Compression release. A separate lens using Donchian width (highest high minus lowest low) ranked in the same percentile framework. When the envelope tightens and then releases, a marker prints in the direction of an ATR-normalized momentum read. This is not a Bollinger-inside-Keltner squeeze — it's built entirely in percentile space.
Reversal engine. Once price has stretched a set number of ATRs from the composite, the engine watches for the turn. It counts four independent checks: an RSI rollover, a close back inside the band around the line, a confirmed pivot, and a volume climax. When enough agree, a reversal marker prints — once per leg, and it won't re-arm until price comes back near the line. Pivots confirm after their right-side bars complete, so that check is delayed by design rather than repainting.
Whale and spike. A per-bar order-flow estimate built from close location and volume. Two whale reads fire from it: a fade of a volume spike where the delta ran against the move, and absorption — heavy delta into a bar that barely moved. Both can be gated by trend so you don't fade into a strong stretch. Bars at the extreme relative-volume threshold print a spike marker instead; the whale band sits below that threshold, so the two never fire on the same bar. The spike is an attention marker, not a directional call.
ATR trailing stop. A ratcheting volatility stop, either always on or armed by a coil fire. The default runs a tight 3/3 configuration as the real line, with a wider manual configuration drawn faintly beside it as a reference. The stop's ATR can be pulled from a higher timeframe, lookahead-off.
Volume participation. A volume EMA normalized 0 to 100 against its own recent range. Fifty is average. The extremes tint the background and the value sits in the status box.
Status box. One table on the chart reports every active engine on the last bar — stop side and level, compression stage, last reversal with its confluence count, last release, whale scenario, last spike, and participation. Rows light up when fresh and dim after a few bars. Every row can be toggled and the layout can run stacked or horizontal.
How I use it
Candle color is the base read. The coil and release tell me volatility compressed and which way it resolved. The reversal and whale engines flag exhaustion at the stretched edges. The trailing stop manages the rest. Each engine is independent — turn off what you don't use.
Originality
The rolling VWMA is the plain public-domain construction, sum(price x volume) / sum(volume), implemented directly with no external library. The compression framework — ATR-percentile coil plus Donchian-width release, scored in one percentile system — is original construction. Native built-ins only. Non-repainting on closed bars: higher-timeframe requests are lookahead-off on confirmed values, and alerts are meant for once-per-bar-close.
Notes
Built for standard candles only. The volume engines need a symbol with real volume, and the whale delta is an estimate from bar structure, not exchange order-flow data. This is an analysis tool, not advice, and it doesn't predict anything.
อินดิเคเตอร์

Moving Averages TrendFour independently configurable moving averages (type, length, source, color each) let you build the classic multi-MA trend stack in one indicator — a long-term filter to define the overall regime, an intermediate MA for the broader trend, and a fast pair for tactical entries on pullbacks within it. Used purely as an overlay, this is a continuation tool: you only take trades in the direction the slower MAs already agree on, using the faster pair to time entries once price pulls back into alignment.
The MA3/MA4 cross-signal layer is what sets this apart from a plain crossover system. Instead of waiting for the two faster MAs to physically cross — which is already stale information by the time it happens — it takes each MA's recent slope and projects it forward by a configurable number of bars, firing the buy/sell label as soon as that projected path crosses rather than the actual one, giving you a signal a few bars earlier than a textbook crossover. A minimum-separation filter (scaled to ATR) throws out weak "touch and go" near-misses, and the signal only fires when price is already sitting on the correct side of both MAs and each MA is still actively moving in that direction on the current bar — all of which is meant to filter out low-conviction crosses in choppy conditions. An optional daily+-only restriction keeps the signal from firing on intraday noise for traders who only want to act on it at swing timeframes.
Best applied in trending or newly-trending markets, as a combined trend filter (from the 4 plotted MAs) and tactical entry trigger (from the cross signal) rather than as a mean-reversion tool — it has little to offer in a flat, range-bound market since the slope and separation conditions are designed specifically to avoid firing in that environment. อินดิเคเตอร์

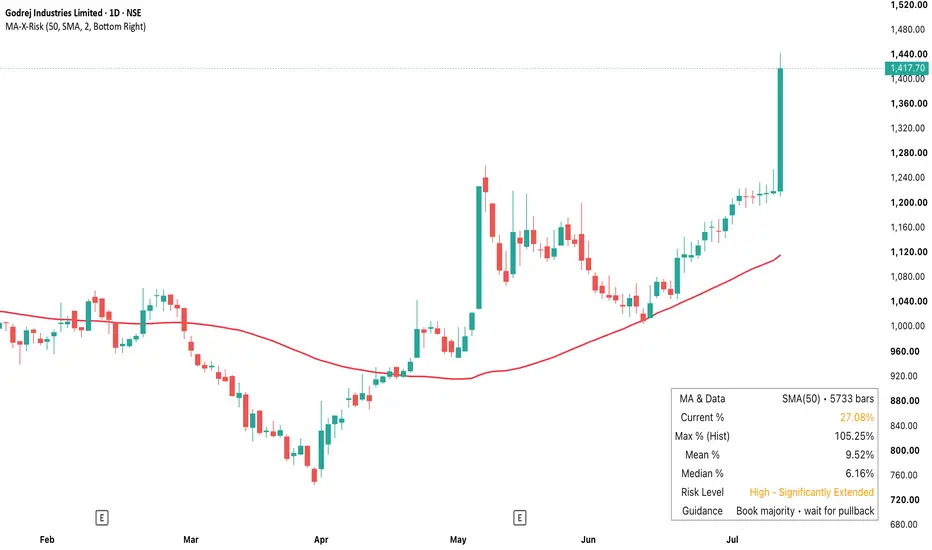
[EWT] MA Extension Risk Stats MA Extension Risk Stats helps traders objectively measure how extended a stock, index, or any instrument is relative to its own historical behavior from a moving average.
Instead of guessing whether price “looks high,” this indicator calculates the percentage distance of every historical bar from a configurable SMA or EMA and then displays the Maximum, Mean, and Median deviations in a clean, updating table. By comparing the current deviation against these historical benchmarks, you get clear, data-driven context for profit booking decisions.
Key Benefits
Objective Extension Measurement: See exactly where the current price stands in the instrument’s historical distribution of moves away from its moving average.
Better Profit Booking Decisions: Know whether the current extension is normal, moderate, high, or near the historical maximum — removing emotion from scaling out of positions.
Risk Context at a Glance: Color-coded risk levels (Low / Moderate / High / Very High) combined with concise guidance help you quickly decide whether to book partial profits (30-50%) or exit most/all of a position.
All-History Perspective: Unlike rolling-window tools, this indicator uses the entire available dataset on your chart, giving you a complete picture across different market regimes.
Fully Customizable: Choose SMA or EMA, any period length, and position the compact table anywhere on the chart. The table automatically adapts to your light or dark chart theme for excellent readability.
Practical Use Cases
Trend Following & Swing Trading: When price stretches far above its MA during a strong uptrend, use the stats to scale out systematically instead of hoping for more upside.
Mean Reversion Setups: Identify when price has extended unusually far below its MA and prepare for potential bounces with better risk awareness.
Position Management: Apply consistent rules such as “book 50% when current deviation exceeds 1.5× median” or “exit fully when approaching historical maximum.”
Multi-Timeframe Analysis: Run it on daily charts for swing trades and weekly charts for positional decisions using the same logic.
Whether you trade stocks, indices, forex, or crypto, MA Extension Risk Stats gives you a professional, repeatable framework to manage extension risk and improve profit-taking discipline. It is especially valuable for traders who want to move from subjective “it looks extended” decisions to quantifiable, historically grounded rules.
Add it to your chart, adjust the MA period to match your style, and start making more confident, data-backed decisions on when to lock in profits. อินดิเคเตอร์

อินดิเคเตอร์

VWAP BandsEvent Based VWAP Bands with EMA & TP Signals - Complete Guide
📊 Indicator Overview
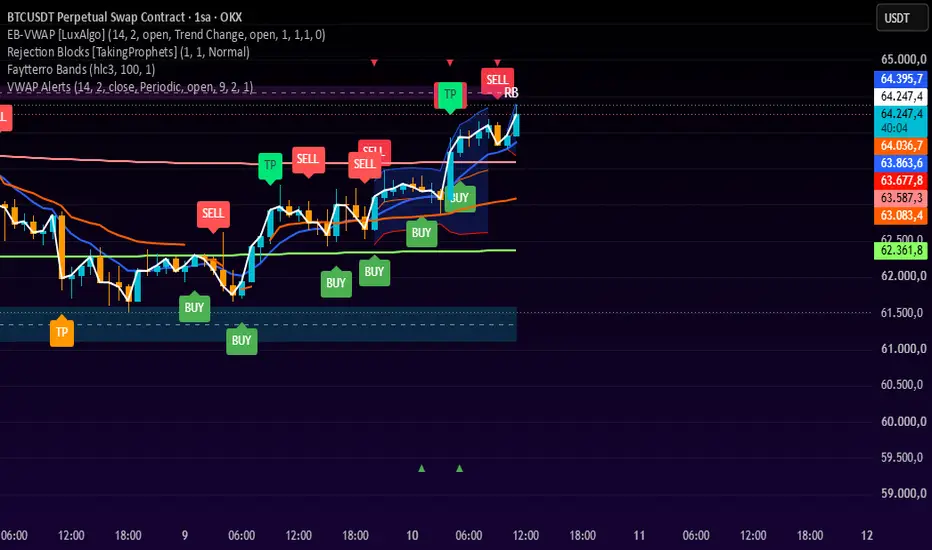
This enhanced version of LuxAlgo's Event Based VWAP Bands combines the powerful Volume Weighted Average Price (VWAP) indicator with Exponential Moving Average (EMA) crossover signals and real-time Take Profit (TP) signals. The indicator provides a comprehensive trading system with multiple entry and exit signals based on price interactions with VWAP bands.
🔍 Core Components
1. VWAP (Volume Weighted Average Price)
Basis Line (Orange): Represents the volume-weighted average price
Upper Band (Blue): Basis + (Standard Deviation × Multiplier)
Lower Band (Red): Basis - (Standard Deviation × Multiplier)
Band Width: Determined by the Multiplier value (3.5 recommended)
2. EMA (Exponential Moving Average)
Blue Line: Smoothed price average with ultra-fast response (Length: 1 recommended)
Provides early entry signals through crossover detection
3. Take Profit (TP) System
BUY TP: Triggers IMMEDIATELY when price touches the Upper Band
SELL TP: Triggers IMMEDIATELY when price touches the Lower Band
Real-time detection: No waiting for bar close
🎯 Signal Logic & Timing
Signal Type Trigger Condition Timing Visual
BUY EMA crosses ABOVE VWAP Basis Bar Close Green "BUY" label
SELL EMA crosses BELOW VWAP Basis Bar Close Red "SELL" label
BUY TP Price touches Upper Band IMMEDIATE Lime "BUY TP" label
SELL TP Price touches Lower Band IMMEDIATE Fuchsia "SELL TP" label
Signal Detection Logic:
text
BUY Signal = ta.crossover(ema_value, pvwap) // EMA crosses above
SELL Signal = ta.crossunder(ema_value, pvwap) // EMA crosses below
BUY TP Signal = high >= upper_band and low <= upper_band // Price touches upper band
SELL TP Signal = high >= lower_band and low <= lower_band // Price touches lower band
⚙️ Recommended Settings (Default)
📈 VWAP Settings
text
✅ Start At First Bar: CHECKED
Length: 14 periods
Multiplier: 3.5 ★ (Critical for TP sensitivity)
Source: open
🎯 Event Settings
text
Event Type: Trend Change
External Cross/Event: open
📊 EMA Settings
text
EMA Length: 1 (Ultra-fast response)
Show EMA: CHECKED
🔔 Alert & Display Settings
text
Enable Alerts: CHECKED
Show TP Signals: CHECKED
Enable TP Alerts: CHECKED
💡 Why These Settings Work Best:
Setting Value Reason
Multiplier 3.5 Wider bands reduce false TP signals while capturing significant price movements
Source open More stable VWAP calculation using opening price
Event Trend Change Resets VWAP at trend reversals for better adaptability
EMA Length 1 Highly responsive to price changes for earlier signals
Start At First Bar True Ensures consistent VWAP calculation from chart beginning
🚨 Alert System
The indicator includes 4 separate alert conditions for comprehensive monitoring:
EMA Signals:
Buy Alert: "EMA crossed above VWAP Basis! Buy signal"
Sell Alert: "EMA crossed below VWAP Basis! Sell signal"
TP Signals:
Buy TP Alert: "Price touched VWAP Upper Band! BUY TP signal"
Sell TP Alert: "Price touched VWAP Lower Band! SELL TP signal"
Alert Status Indicators:
▲ (Green): Buy Alert Trigger
▼ (Red): Sell Alert Trigger
⬆ (Lime): Buy TP Trigger
⬇ (Fuchsia): Sell TP Trigger
📝 How to Use This Strategy
Entry Strategy (EMA Crossovers)
BUY Entry: When EMA crosses above VWAP Basis → Consider entering long position
SELL Entry: When EMA crosses below VWAP Basis → Consider entering short position
Exit/Take Profit Strategy
BUY TP: When price touches Upper Band → Take profit on long positions
SELL TP: When price touches Lower Band → Take profit on short positions
Risk Management Notes
Use Upper Band as realistic profit target for long positions
Use Lower Band as realistic profit target for short positions
Wider multiplier (3.5) provides more achievable profit targets
TP signals trigger in real-time, allowing immediate action
🎨 Visual Guide
Element Color Symbol Meaning
Upper Band Blue Line Resistance/Profit Target
Basis Orange Line VWAP Center
Lower Band Red Line Support/Profit Target
EMA Blue Line Moving Average
BUY Signal Green "BUY" label Entry signal
SELL Signal Red "SELL" label Entry signal
BUY TP Signal Lime "BUY TP" label Take profit signal
SELL TP Signal Fuchsia "SELL TP" label Take profit signal
⚠️ Important Notes
TP signals are real-time: Trigger immediately when price touches bands, bar close not required
EMA signals are bar-close: Traditional crossover signals confirmed at bar close
Multiplier affects all signals: Higher multiplier = wider bands = fewer but more significant signals
Multiple signals possible: EMA and TP signals can occur independently
Event-based reset: VWAP recalculates at Trend Change events for better accuracy
🔧 Customization Options
Users can adjust:
Multiplier: Control band width and TP sensitivity
EMA Length: Adjust signal speed (1 = fastest)
Source: Change VWAP calculation base
Event Type: Modify reset conditions
Colors: Customize visual appearance
Alerts: Enable/disable specific signals
📊 Example Scenario
text
Price Action:
1. EMA crosses above VWAP Basis → BUY signal (Green label)
2. Price rises and touches Upper Band → BUY TP signal (Lime label)
3. Take profit at Upper Band
4. Price reverses, EMA crosses below VWAP Basis → SELL signal (Red label)
5. Price falls and touches Lower Band → SELL TP signal (Fuchsia label)
6. Take profit at Lower Band
🙏 Special Thanks & Credits
This indicator builds upon the exceptional work of LuxAlgo, the original creator of the Event Based VWAP Bands indicator.
Why LuxAlgo's Work Matters:
Innovative Approach: Revolutionized VWAP calculation with event-based resets
Versatile Framework: Allows for creative extensions like this enhanced version
Professional Quality: Industry-standard code structure and reliability
Open Source Contribution: Enables the trading community to build and improve
Thank you, LuxAlgo, for developing such a robust and versatile VWAP framework that serves as the foundation for this enhanced indicator. Your contribution to the trading community is invaluable.
📌 Quick Reference Card
text
┌─────────────────────────────────────────────────────────────┐
│ SIGNAL REFERENCE CARD │
├─────────────────────────────────────────────────────────────┤
│ ENTRY SIGNALS: │
│ BUY : EMA crosses ABOVE VWAP Basis (Bar Close) │
│ SELL : EMA crosses BELOW VWAP Basis (Bar Close) │
│ │
│ EXIT/TP SIGNALS: │
│ BUY TP : Price touches UPPER Band (IMMEDIATE) │
│ SELL TP: Price touches LOWER Band (IMMEDIATE) │
├─────────────────────────────────────────────────────────────┤
│ RECOMMENDED SETTINGS: │
│ Multiplier: 3.5 │ EMA Length: 1 │
│ Source: open │ Event: Trend Change │
│ Start At First Bar: ✓ │ All Alerts: ✓ │
├─────────────────────────────────────────────────────────────┤
│ ALERT MESSAGES: │
│ 🟢 "EMA crossed above VWAP Basis! Buy signal" │
│ 🔴 "EMA crossed below VWAP Basis! Sell signal" │
│ 🟢 "Price touched VWAP Upper Band! BUY TP signal" │
│ 🔴 "Price touched VWAP Lower Band! SELL TP signal" │
└─────────────────────────────────────────────────────────────┘
🎯 Final Notes
This enhanced indicator provides traders with:
Clear entry signals through EMA crossovers
Real-time profit targets through TP signals
Multiple alert options for automated monitoring
Customizable settings for different trading styles
Professional-grade code based on LuxAlgo's framework
Disclaimer: This indicator is for educational and informational purposes only. Always conduct your own research, practice proper risk management, and test thoroughly before using in live trading. Past performance does not guarantee future results.
อินดิเคเตอร์

For-Loop Vote Trailing Stop | MiesOnChartsFor-Loop Vote Trailing Stop
Overview
For-Loop Vote Trailing Stop is a trend-following tool that combines two ideas: a multi-horizon momentum vote to decide the direction of the market, and an ATR-based ratcheting trailing stop to ride and eventually exit the move. Rather than judging momentum from a single lookback, it polls dozens of horizons at once and lets them vote; the winning side then sets a stop line that trails price and only flips when the opposite side wins the election.
The script plots as a single stop line that sits below price in an uptrend and above price in a downtrend, changing colour and side when the regime turns.
The script is designed and tuned for the 1D (daily) timeframe, though its inputs are fully adjustable for other timeframes.
The idea behind it
Momentum measured over one lookback is fragile: a 10-bar reading and a 60-bar reading frequently disagree, and whichever you pick can be caught out by the other's timescale. This indicator treats direction as an election across horizons instead of a single measurement.
For every horizon from the minimum to the maximum, it asks a simple yes/no question is price higher now than it was that many bars ago? Each horizon casts a vote of +1 (higher) or −1 (lower). Summing and normalising these votes produces a single momentum score between −1 and +1 that reflects how broadly the move is supported across timescales. A score near +1 means price is up over nearly every horizon (a broad, persistent advance); near −1 means the opposite; near 0 means the horizons are split and there is no coherent trend.
That breadth-of-momentum score is more robust than any one lookback because agreement across many horizons is harder to fake than a single reading, and disagreement is surfaced honestly as a neutral score rather than hidden inside one arbitrary length.
How it works
1. The vote
A for loop runs from Min Horizon to Max Horizon, comparing the source against its value "i" bars ago and adding +1 or −1 for each horizon. The total is divided by the number of horizons, giving a normalised score in the range .
2. The regime.
The score is compared against two thresholds:
-- If it reaches the Long Threshold, the regime turns long.
-- If it falls to the Short Threshold, the regime turns short.
-- Between the thresholds the current regime is held, the tool does not flip on marginal readings.
3. The trailing stop
An offset equal to ATR Multiplier × ATR is placed on the correct side of price:
-- On a fresh long signal the stop is set below price; while the long regime persists it only ever ratchets upward, locking in progress and never loosening.
-- On a fresh short signal the stop is set above price; while short it only ratchets downward.
-- The regime flips, and the stop jumps to the other side when the opposite threshold is met.
Because the stop can only tighten in the direction of the trend, it behaves like a one-way ratchet that follows favourable moves and holds its ground against pullbacks until the vote itself reverses.
Signal logic and markers
-- The stop line is green while the regime is long (plotted beneath price) and red while short (plotted above price).
-- A green up-triangle marks each flip to long; a red down-triangle marks each flip to short.
-- Two alert conditions, Vote Stop Long and Vote Stop Short, fire on those flips so the regime changes can be wired to TradingView alerts.
Inputs
-- Source : the price series the vote is measured on (default: hl2, the bar midpoint, which is slightly steadier than close).
-- Min Horizon / Max Horizon : the shortest and longest lookbacks in the vote. A wider span blends more timescales into the score.
-- Long Threshold : how strong the bullish vote must be to turn the regime long. Higher values demand broader agreement before committing.
-- Short Threshold : how weak (negative) the vote must be to turn the regime short.
-- ATR Length : the lookback for the Average True Range used to size the stop offset.
-- ATR Multiplier : how far the stop sits from price, in ATR units. Larger values give the trend more room to breathe (fewer, later exits); smaller values keep the stop tighter (quicker exits, more flips).
Note that the two thresholds are independent, so the tool can be set asymmetrically for example, requiring a stronger vote to enter long than to flip short, or vice versa to reflect a directional bias or differing conviction on each side.
How to use it
-- Trend direction and stop management : the line's side and colour give the current regime at a glance, while its level offers a systematic, volatility-scaled trailing reference that adapts as ATR expands and contracts.
-- Entries and exits : the flip markers indicate when broad momentum has changed sides; the trailing line indicates where that thesis would be invalidated.
-- Volatility awareness : because the offset is ATR-based, the stop automatically widens in turbulent conditions and tightens in calm ones, rather than using a fixed distance.
Notes and limitations
-- This is a reactive, trend-following tool. It follows momentum that is already underway and will change sides after a reversal has begun, not before it. It does not predict future prices.
-- In ranging or choppy markets the vote can oscillate around the thresholds, producing repeated flips ("whipsaw"). Wider horizon spans, more separated thresholds, and a larger ATR multiplier reduce this at the cost of responsiveness.
-- The stop is a calculated reference level, not a guaranteed exit price; actual fills depend on your broker, slippage, and market conditions.
-- There is no universally correct setting; the horizon range, thresholds, and ATR multiplier should be adjusted to the instrument and timeframe you trade.
Originality
This is not a standard ATR trailing stop or SuperTrend clone. The direction that governs the stop is not derived from a single moving average or band, but from a cross-sectional vote computed in a loop across many momentum horizons. The ensemble vote and the ratcheting ATR stop are combined into one tool: the breadth of momentum decides the regime, and the volatility-scaled stop expresses that regime as an adaptive, one-way trailing level.
Disclaimer
This indicator is provided for educational and informational purposes only and does not constitute financial, investment, or trading advice, nor a recommendation to buy or sell any asset. It is a decision-support tool, not a trading system, and the trailing stop it draws is a reference level, not an order or a guaranteed exit. Trading and investing carry substantial risk, including the possible loss of all capital. Past behaviour of any indicator or market is not indicative of future results, and no representation is made that its signals will be profitable. You are solely responsible for your own trading decisions and should conduct your own research and consult a licensed financial professional where appropriate. The author accepts no liability for any loss or damage arising from the use of this script. อินดิเคเตอร์

อินดิเคเตอร์

DN ULTIMATE SUPER SCANNER + SIGNAL DASHBOARDDN Ultimate Super Scanner + Signal Dashboard is a full trading framework built for traders who want one clean tool for trend direction, momentum, volume, breakout conditions, and trade management.
This indicator combines the Doing Numbers 9 / 65 / 200 framework with an added 9 / 21 / 65 + 200 signal dashboard. It is designed to help identify bullish and bearish trend alignment, high-volume candles, buy-the-dip opportunities, sell-the-rally setups, range breaks, squeeze conditions, and potential continuation setups.
Key features:
• Auto timeframe mode for 1M scalp, 5M day trade, 15M entry, 1H confirmation, and swing trading
• 9 / 65 / 200 EMA framework stack
• 9 / 21 / 65 + 200 signal panel
• VWAP confirmation for intraday trades
• RSI and relative volume checks
• High-volume and low-volume candle markers
• Buy dip and sell rally signals
• Range high and range low breakout alerts
• Breakout score based on price, volume, ATR, RSI, moving averages, 52-week high proximity, and squeeze conditions
• TTM-style squeeze detection
• ATR trail, entry price, and TP progress panel
• Buffered Trend Cloud for visual trade management
• Built-in alerts for scalp, day trade, swing, range break, squeeze, and panel signals
How I use it:
The scanner is not meant to be a blind buy or sell system. It is a confirmation tool. I use it to identify when trend, volume, momentum, and structure are lining up. Entries should still be confirmed with price action, support/resistance levels, candle closes, and risk management.
Best use:
• 1M / 5M / 15M for intraday setups
• 1H / 4H / Daily for swing confirmation
• Combine with manual support, resistance, supply, demand, and market context
The goal of this tool is simple:
Plan the trade. Wait for confirmation. Execute with discipline. Manage risk.
Disclaimer:
This script is for educational and research purposes only. It is not financial advice. Trading stocks and options involves risk, and options can lose 100% of premium. อินดิเคเตอร์

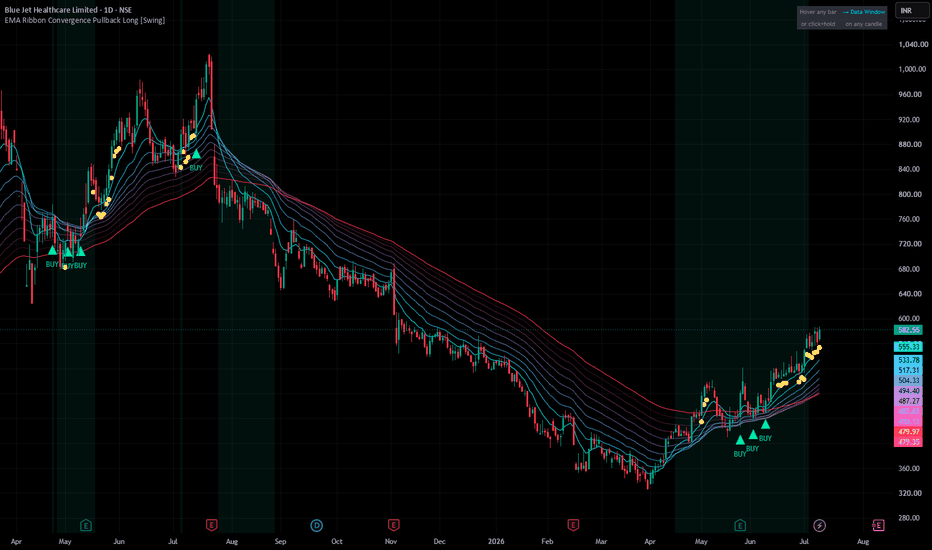
EMA Ribbon Convergence Pullback Long [Swing]EMA Ribbon Convergence Pullback Long v10
Type: Long-only entry signal indicator (Pine Script v5, indicator())
Market: Indian equities (NSE), daily timeframe — works on other markets/timeframes but tuned for daily swings
Core idea: Flag a long entry when a 10-EMA ribbon (10 to 100) has recently tightened into a basing zone, price pulls back into it, and then closes back above the fastest EMA.
Note: This is the indicator version — it plots entry signals and alerts only. It does not size positions, place stops/targets, or run backtests. See the separate strategy() build (v11+) if you need Strategy Tester results with stop-loss/target logic.
1. Concept
The ribbon is 10 EMAs (10, 20, 30 ... 100). Three market states matter:
Basing (convergence): the EMAs bunch close together — the stock is consolidating rather than trending.
Pullback: after an uptrend resumes, price dips back down and touches or dips slightly below the ribbon.
Reversal (trigger): price closes back above the fastest EMA (EMA10), confirming buyers have stepped back in.
The indicator signals on step 3, provided step 1 happened recently and the broader trend (price vs EMA100) is still up.
Important design note: the ribbon does not need to be tightly converged on the trigger bar itself. A real pullback naturally causes the fast EMA to dip below the slower ones — requiring "tight AND perfectly ordered" on the same bar as the breakout is close to a contradiction. This version checks convergence over a recent lookback window, then checks the breakout separately as a distinct condition.
2. Entry Logic (all must be true)
#ConditionDescription1Basing RecentlyRibbon spread was "tight" (below threshold) at some point in the last N bars (convergenceLookback)2Trend UpPrice is above EMA100 (or EMA100 rising, depending on mode selected)3Pulled BackPrice's low touched or dipped below EMA10 within the last N bars (pullbackLookback)4Reversal TriggerClose crosses back above EMA10 (or, optionally, a bullish engulfing/hammer candle)5CooldownAt least cooldownBars bars since the last signal, to reduce signal spam
A yellow dot marks "near miss" bars — everything above is true except the trigger hasn't fired yet. Useful as an early watchlist flag.
Known gap in this version: cooldown is bar-count based only — there is no price-distance check, so two signals can fire close together in price if they land just outside the cooldown window on the same basing structure (this was fixed with a price-gap filter in v11).
3. What This Version Does Not Include
No stop-loss or target levels
No position sizing or backtest stats (Strategy Tester tab will not appear — this is an indicator(), not a strategy())
No price-distance-based duplicate-signal suppression (bar-count cooldown only)
No higher-timeframe (weekly) trend filter
4. Key Inputs Reference
Convergence
useAdaptive (default ON) — auto-scales the "tight ribbon" threshold to the stock's own recent volatility (percentile-based) instead of a fixed %. Recommended ON, especially across stocks at very different price levels.
convergenceThresh (default 3.0%) — fixed threshold used only if useAdaptive is OFF, and as the automatic fallback during the adaptive method's warm-up period (first ~150 bars of a chart's history).
pctLen (default 150) — lookback window for the adaptive percentile calculation.
pctRank (default 30) — lower = stricter/tighter convergence requirement.
Ribbon Order
requireBullishOrder (default OFF) — if ON, also requires EMA10 > EMA50 > EMA100 strictly on the trigger bar. Keep OFF for normal pullback entries; turning it ON produces a much rarer "clean trend only" variant. When OFF, this is tracked as an informational-only value in the Data Window.
Setup / Pullback / Trend
convergenceLookback (default 10) — how far back to check for a basing zone.
pullbackLookback (default 6) — how far back to check for a dip into the ribbon.
trendFilterMode (default "Price Above EMA100, no slope") — choose between slope-based or simple price-vs-EMA100 trend filters.
trendLen (default 10) — slope lookback, only used in the 10-bar EMA100-rising mode.
cooldownBars (default 5) — minimum bars between signals.
Candle Confirmation
requireCandlePattern (default OFF) — if ON, requires an engulfing or hammer candle in addition to the crossover. OFF gives more signals; ON gives fewer, higher-conviction ones.
useEngulfing, useHammer, minBodyATRRatio — pattern-detection sub-settings, only relevant if the above is ON or you're using patterns as an alternative trigger.
Diagnostics
showDebugTable — live stats panel (top-right) showing hover/click instructions.
showSetupMarkers — yellow "near miss" dots.
showWarmupBg — shades the region at the start of the chart where the adaptive threshold hasn't fully matured yet (using the fixed-% fallback instead).
Hidden 🔍-prefixed data-window plots — hover any bar (or click-and-hold on the chart) and open TradingView's Data Window (right-hand toolbar icon, or Alt+D) to see the live true/false state of every condition for that specific bar: Spread %, Threshold Used, Converged, EMA Order, Ribbon Bullish, Basing Recently, Pulled Back, Close Crossed Up, Candle Pattern, Trend Up, and the final BUY Signal flag. This is the fastest way to understand why a bar did or didn't signal.
5. How to Use
Paste the script into Pine Editor and add to chart.
Set an alert on the built-in alertcondition ("EMA Ribbon Long Entry") if you want notifications — set trigger to "Once Per Bar Close" to avoid intrabar flicker.
Use the Data Window (see Diagnostics above) to inspect any historical bar and confirm which conditions passed.
Because there's no stop-loss/target built in here, define your own risk management manually before acting on a signal (e.g., stop below the pullback low, target at a fixed risk-multiple).
6. Known Limitations
Long-only, daily-timeframe design. No short logic; not tested on intraday timeframes.
No higher-timeframe (weekly) trend filter — the indicator can still fire during a daily pullback that's actually part of a larger weekly downtrend. Consider manually checking the weekly chart before taking a signal.
No exit logic. This tells you when to consider entering, not when to exit — position sizing, stop-loss, and target are entirely up to you at this version.
Not backtested with real trade statistics at this stage — visual/historical review only. Use the v11+ strategy() build for Strategy Tester metrics (win rate, profit factor, drawdown).
This is not financial advice. Validate signals manually, paper trade, and manage risk according to your own plan before using with real capital. อินดิเคเตอร์
Quantum Market FlowQuantum Market Flow
Overview
Quantum Market Flow is an advanced trend and momentum indicator designed to help traders identify high-quality market opportunities by combining trend analysis, volatility measurement, and momentum confirmation into a single, easy-to-read tool. Rather than relying on a single indicator, Quantum Market Flow evaluates multiple market conditions simultaneously to provide clearer market context and improve trading confidence.
The indicator is built for traders who prefer clean charts without sacrificing analytical depth. It can be used for trend following, pullback trading, breakout confirmation, and general market analysis across multiple asset classes.
---
Key Features
Dynamic Trend Engine
Uses adaptive trend calculations to identify bullish and bearish market conditions while filtering out unnecessary market noise.
Smart Momentum Filter
Evaluates momentum strength before generating signals, helping reduce weak or low-quality entries during ranging markets.
Volatility Analysis
Incorporates market volatility into its calculations, allowing the indicator to adapt automatically as market conditions change.
Buy & Sell Signals
Generates easy-to-read visual signals when multiple market conditions align, making it suitable for discretionary trading and trade confirmation.
Trend Background
Displays market bias directly on the chart using background colors, allowing traders to recognize trend direction instantly.
Fully Customizable
Every major parameter can be adjusted to suit different trading styles, assets, and timeframes.
TradingView Alerts
Supports built-in TradingView alerts so traders can receive notifications whenever a new trading signal appears.
---
Best Markets
Quantum Market Flow is designed to work on a wide range of financial markets, including:
- Cryptocurrency
- Forex
- Stocks
- Indices
- Commodities
- Futures
---
Recommended Timeframes
The indicator performs well across multiple timeframes, including:
- 5 Minute
- 15 Minute
- 30 Minute
- 1 Hour
- 4 Hour
- Daily
- Weekly
Higher timeframes generally produce stronger trend confirmation, while lower timeframes provide more frequent trading opportunities.
---
How to Use
Bullish Conditions
- The indicator identifies an established uptrend.
- Momentum confirms buying strength.
- Volatility supports continued price movement.
- A buy signal appears, indicating a potential long opportunity.
Bearish Conditions
- The indicator identifies a downtrend.
- Momentum confirms selling pressure.
- Volatility supports downside continuation.
- A sell signal appears, indicating a potential short opportunity.
For improved decision-making, combine Quantum Market Flow with support and resistance, market structure, volume analysis, or your preferred risk management strategy.
---
Risk Management
No indicator can predict the market with complete accuracy. Quantum Market Flow is intended to assist traders by providing additional market context rather than guaranteeing profitable trades.
Always:
- Use stop-loss orders.
- Manage your position size.
- Avoid excessive leverage.
- Confirm signals with your own analysis before entering a trade.
---
Why Choose Quantum Market Flow?
- Clean and user-friendly interface
- Adaptive calculations for changing market conditions
- Designed for multiple asset classes
- Suitable for beginners and experienced traders
- Lightweight and efficient
- Supports real-time alerts
- Easy to customize
---
Disclaimer
Quantum Market Flow is an analytical tool intended solely for educational and informational purposes. It should not be considered financial or investment advice. Trading financial markets involves substantial risk, and past performance does not guarantee future results. Always conduct your own research and use proper risk management before making any trading decisions.
Thank you for using Quantum Market Flow. Your feedback and suggestions are always appreciated and will help guide future updates and improvements. อินดิเคเตอร์

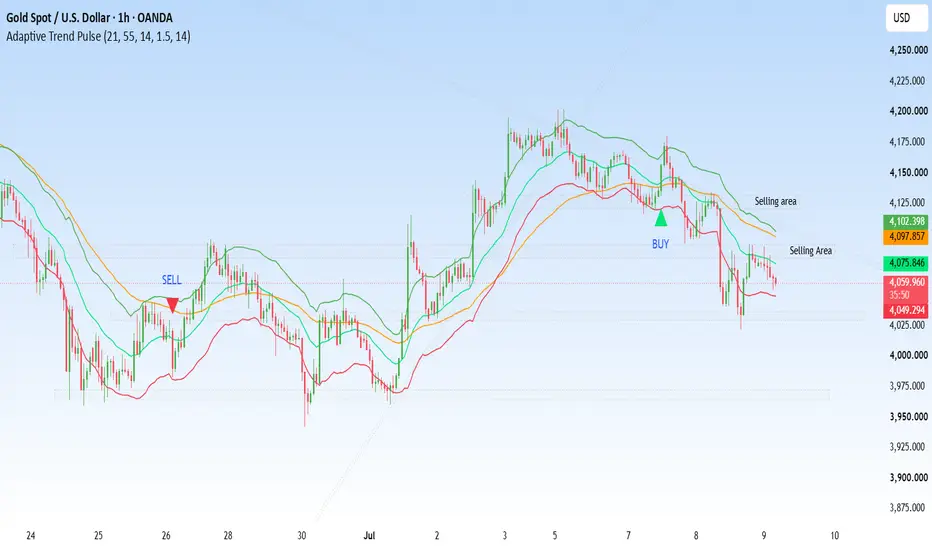
Adaptive Trend PulseAdaptive Trend Pulse
Overview
Adaptive Trend Pulse is a trend-following indicator designed to help traders identify market direction, momentum, and potential entry opportunities using a combination of moving averages, volatility, and momentum analysis. Instead of relying on a single technical indicator, Adaptive Trend Pulse combines multiple market factors into one clean and easy-to-read system that helps reduce noise while keeping traders aligned with the prevailing trend.
The indicator is suitable for beginners looking for a simple trend confirmation tool, as well as experienced traders who want an additional layer of confirmation before entering or exiting trades.
---
How It Works
Adaptive Trend Pulse analyzes price action through a combination of:
• Fast and Slow Exponential Moving Averages (EMAs) to determine the current market trend.
• Average True Range (ATR) to dynamically measure market volatility and generate adaptive price bands.
• Relative Strength Index (RSI) to confirm momentum and filter out weak trading signals.
By combining these components, the indicator attempts to highlight higher-probability trading opportunities while filtering out many false signals that occur during sideways market conditions.
---
Features
✔ Adaptive Trend Detection
Uses a dual EMA system to identify bullish and bearish market structure.
✔ Dynamic ATR Bands
Volatility-based bands automatically adjust according to current market conditions, providing a better understanding of price expansion and contraction.
✔ Momentum Confirmation
RSI confirmation helps improve signal quality by ensuring momentum aligns with the current trend.
✔ Buy & Sell Signals
Generates visual buy and sell signals when trend and momentum conditions align.
✔ Background Trend Visualization
The chart background changes color to quickly identify bullish and bearish market environments.
✔ Customizable Inputs
All major settings including EMA lengths, ATR parameters, RSI period, and display options can be customized to fit different trading styles.
✔ Alert Support
Built-in TradingView alerts allow traders to receive notifications whenever a new signal is generated.
---
Best Timeframes
Adaptive Trend Pulse works across multiple timeframes, including:
• 5 Minute
• 15 Minute
• 30 Minute
• 1 Hour
• 4 Hour
• Daily
Higher timeframes generally provide stronger and more reliable trend signals, while lower timeframes may generate more frequent opportunities.
---
Markets Supported
The indicator is designed to work on virtually any liquid financial market, including:
• Forex
• Cryptocurrencies
• Stocks
• Indices
• Commodities
• Futures
---
Suggested Trading Approach
Bullish Conditions
• Fast EMA is above the Slow EMA.
• Price remains above the Fast EMA.
• RSI confirms bullish momentum.
• Buy signal appears.
Bearish Conditions
• Fast EMA is below the Slow EMA.
• Price remains below the Fast EMA.
• RSI confirms bearish momentum.
• Sell signal appears.
For improved results, consider combining Adaptive Trend Pulse with support and resistance levels, higher-timeframe trend analysis, volume analysis, or sound risk management techniques.
---
Risk Management
No technical indicator can predict future market movements with complete accuracy. Adaptive Trend Pulse should be used as a decision-support tool rather than a standalone trading system.
Always:
• Use appropriate stop-loss levels.
• Manage position sizing carefully.
• Avoid overleveraging.
• Confirm signals with your own market analysis.
---
Customization
Users can adjust:
• Fast EMA Length
• Slow EMA Length
• ATR Length
• ATR Multiplier
• RSI Length
• ATR Band Visibility
These settings allow the indicator to adapt to different assets, market conditions, and trading strategies.
---
Disclaimer
Adaptive Trend Pulse is an analytical tool designed to assist traders in identifying trends and momentum. It does not guarantee profits or eliminate trading risk. Past performance is not indicative of future results. Traders should always perform their own research and use proper risk management before making any trading decisions.
Thank you for using Adaptive Trend Pulse. I hope it becomes a valuable addition to your TradingView toolkit. Feedback and suggestions are always welcome and will help shape future improvements and updates. อินดิเคเตอร์

อินดิเคเตอร์

กลยุทธ์

TRADERXMOM IndicatorTRADERXMOM Indicator (Heikin Ashi/EMA Momentum)
What it does
Plots directional momentum signals on Heikin Ashi price action, generated from three independently-gated pattern types: an initial breakout, a pullback-and-continuation, and an EMA-cross condition. "Signal Up"/"Signal Down" markers indicate qualifying momentum shifts within active sessions.
How it works
Heikin Ashi values are calculated manually within the script rather than via a built-in HA ticker override, keeping signal computation independent from the real OHLC series. A fast EMA pair (8/21) drives trend direction and entry timing; a separate, slower EMA pair (13/48) is shown purely as visual reference and isn't part of the signal logic. Each of the three pattern types requires a full-bodied Heikin Ashi candle (no wick on the trend side) as confirmation:
Breakout — a strong-bodied HA candle closing beyond both EMAs in trend direction
Pullback — trend intact, price pulled back toward the fast EMA over the prior several bars, then a strong-bodied HA candle resumes in trend direction
EMA Cross — the fast/slow EMA pair crosses, confirmed by a strong-bodied HA candle
Recognizing three distinct momentum behaviors rather than relying on a single crossover rule is the core differentiator from standard single-trigger EMA/HA scripts, which typically only catch one of these patterns and miss the others.
Signals are further gated by up to four configurable session windows, a cooldown period between signals to prevent clustering, a defined kill zone that blocks signals late in the session, and an optional VWAP directional filter.
How to use it
Built for micro index futures (MNQ, MES) on lower intraday timeframes. Enable or disable individual sessions and the VWAP filter to match your own trading windows. Signal markers indicate conditions worth evaluating, not automatic entries — always apply your own risk management. อินดิเคเตอร์

For-Loop Consensus MA | MiesOnChartsFor-Loop Consensus MA
Overview
For-Loop Consensus MA is a trend indicator that replaces a single moving average with an ensemble of exponential moving averages (EMAs) and asks them to "vote" on the direction of the market. Instead of committing to one length -- where a value of 20 and a value of 50 can disagree and either can be wrong at any given time -- it evaluates many lengths at once and only signals a trend when a large majority of them agree. The result is a single line whose colour reflects the level of agreement across the whole set of lookbacks.
The idea behind it
A recurring problem with moving-average trend tools is parameter sensitivity: the "best" length is only known in hindsight and changes with market conditions. A short EMA reacts quickly but whipsaws in noise; a long EMA is stable but late. Picking one is a compromise.
This indicator borrows a concept from statistics and machine learning known as model averaging (also called ensembling or bagging): rather than trusting one model, you build many variations of it and combine their outputs. The aggregate is generally more robust than any single member, because the idiosyncratic errors of individual lengths tend to cancel out while the shared trend signal reinforces.
Two things are aggregated here:
The line itself -- the average of all EMAs in the ensemble, producing a smoothed consensus curve.
The direction vote -- the fraction of EMAs that price is currently trading above.
How it works
The script uses a for loop to construct and maintain a series of EMAs spanning a range of lengths:
It steps from Min EMA Length to Max EMA Length in increments of Length Step (for example 20, 40, 60… 140).
Each EMA is computed manually from its smoothing factor alpha = 2 / (length + 1), and its running value is stored in a persistent array -- one slot per length -- so every member carries its state forward bar to bar.
On each bar the loop does two things: it sums the EMA values (to build the consensus line), and it counts how many EMAs price closes above (to build the vote).
From these:
Consensus line = the mean of all EMAs in the ensemble.
Vote share = number of EMAs price is above ÷ total number of EMAs, a value between 0 and 1.
Signal logic
The vote share drives the trend state through a symmetric threshold:
Bullish when the vote share is greater than or equal to the Supermajority Vote Share input (default 0.7) -- i.e. at least 70% of the lookbacks agree price is in an uptrend. The line turns green.
Bearish when the vote share is at or below its mirror (1 - threshold, so 0.3 at the default) -- at least 70% agree on a downtrend. The line turns red.
Neutral in between, when the ensemble is split and no supermajority exists. The line is grey, indicating indecision or a ranging market.
Requiring a supermajority rather than a simple majority is deliberate: it filters out the marginal, split-vote conditions where moving averages are least reliable, and only commits to a trend colour when the evidence across timescales is broad.
Inputs
Source -- the price series the EMAs are built from (default: close).
Min EMA Length / Max EMA Length -- the shortest and longest lookbacks in the ensemble. A wider span blends more timescales.
Length Step -- the spacing between ensemble members. A smaller step packs in more EMAs (finer, heavier); a larger step uses fewer.
Supermajority Vote Share -- how strong the agreement must be before a trend is declared. Higher values (e.g. 0.8) demand stronger consensus and produce fewer, more selective signals; lower values (e.g. 0.6) are more responsive but less discriminating.
How to use it
Trend context -- read the colour of the line as a regime filter. Green suggests a broad-based uptrend across lookbacks; red a broad downtrend; grey a lack of consensus where trend-following is riskier.
Trend confirmation -- the line can be used alongside price structure or other tools to confirm that a move is supported across multiple horizons rather than by one arbitrary length.
Neutral zones -- grey stretches highlight indecision and can be treated as periods to stand aside or tighten expectations.
Two alert conditions are included -- Consensus MA Long (bullish) and Consensus MA Short (bearish) -- so the trend states can be wired to TradingView alerts.
Notes and limitations
Like all moving-average-based tools, this indicator is reactive: it describes the trend that price is already in and will lag turning points. It does not predict future prices.
Signals reflect agreement among lagging averages, so expect the trend colour to change after a reversal has begun, not before it.
Wider length ranges and larger supermajority thresholds increase robustness at the cost of responsiveness. There is no universally correct setting; adjust to the instrument and timeframe you trade.
This script is a decision-support tool, not a standalone trading system and not financial advice. It does not include risk management and makes no representation about future performance.
Test any settings on your market before relying on them. อินดิเคเตอร์

AWR 5MA 3TF - Advanced Multi-Timeframe Moving Average DashboardAWR_5MA_3TF est un outil d'analyse de tendance tout-en-un conçu pour offrir une vision claire et synthétique du marché à travers de multiples unités de temps (Multi-Timeframe). Que vous fassiez du scalping, du day trading ou du swing trading, cet indicateur regroupe vos moyennes mobiles et calcule leur distance par rapport au prix sur trois horizons de temps différents, le tout dans un tableau de bord ultra-lisible.
🌟 Fonctionnalités Principales
1. 5 Moyennes Mobiles 100% Personnalisables
Affichez jusqu'à 5 moyennes mobiles sur votre graphique. Pour chacune, vous pouvez configurer individuellement :
La longueur (Length) : 7, 20, 50, 100, 200 par défaut.
Le type de moyenne : EMA, SMA, WMA, RMA, VWMA, HMA.
L'unité de temps (Timeframe).
L'esthétique : Couleur, transparence et épaisseur de ligne.
2. Système "Master" (Gain de temps)
L'indicateur inclut une fonction "Master Timeframe" et "Master Type". En un clic, vous pouvez forcer toutes les moyennes mobiles affichées ou celles du tableau à adopter la même unité de temps ou le même type (ex: basculer tout en EMA ou tout en H4), sans avoir à modifier les 5 MAs une par une.
3. Tableau de Bord Récapitulatif (3 Timeframes)
C'est le cœur de l'indicateur. Un tableau personnalisable s'affiche sur votre graphique et compare vos 5 MAs sur 3 unités de temps distinctes (TF A, TF B, TF C - par défaut : 1h, Journalier, Hebdomadaire).
Distance en % : Affiche la distance exacte en pourcentage entre le prix actuel (Close) et chaque moyenne mobile. Idéal pour repérer les sur-extensions (marché suracheté/survendu).
Code Couleur Visuel : Les pourcentages bénéficient d'un gradient de couleur (du vert au rouge) et d'un ajustement de la transparence en fonction de l'éloignement.
4. L'Harmonie des Moyennes (Ranking Visuel Intelligent)
Le tableau ne se contente pas d'afficher des chiffres purs : il intègre un algorithme de classement dynamique qui évalue la position relative de vos 5 moyennes mobiles. Un code couleur spécifique est appliqué au fond de chaque cellule pour vous permettre de lire l'état du marché en une fraction de seconde :
Alignement Parfait (Tendance forte) : Si les couleurs forment une suite logique et ordonnée dans votre colonne (par exemple, la MA courte est strictement au-dessus de toutes les autres, jusqu'à la plus longue), vous avez la confirmation visuelle immédiate d'une tendance saine et harmonieuse (Full Bullish ou Full Bearish).
Chaos / Consolidation : Si les couleurs sont mélangées ou désordonnées, le marché est en phase de range, de compression ou en pleine inversion de tendance. C'est un filtre visuel redoutable pour éviter de trader dans de mauvaises conditions de marché !
5. Alertes Complètes et Marquages Graphiques
Le script est pensé pour le trading automatisé ou la notification en temps réel. Il surveille l'unité de temps C (TF C, hebdomadaire par défaut) pour déclencher des alertes sur :
Croisements Cours / MA : Le prix croise les MAs 20, 50, 100 ou 200.
Croisements MA / MA : Surveille les croisements majeurs (ex: 20/50, 20/200, et le fameux 50/200 - Golden Cross / Death Cross).
Signaux visuels : Des pastilles apparaissent directement sur le graphique lors des croisements 50/200 (cercle blanc pour haussier, orange pour baissier).
💡 Comment l'utiliser ?
Analyse de Tendance Multi-TF : Utilisez le tableau pour confirmer la tendance de fond (TF C), la tendance intermédiaire (TF B) et trouver votre point d'entrée (TF A). Si l'harmonie des couleurs est parfaite et que les pourcentages sont cohérents, la dynamique globale est claire.
Retour à la moyenne (Mean Reversion) : Surveillez la colonne "Dist %". Un pourcentage exceptionnellement élevé indique que le prix s'est trop éloigné de sa moyenne mobile, suggérant une potentielle correction à venir.
Golden / Death Cross : Activez les alertes pour être notifié instantanément lorsqu'un croisement majeur (50/200 par exemple) se produit sur votre unité de temps de référence, sans avoir à surveiller le graphique en permanence.
⚙️ Paramètres Clés
Master TF / Type : Activez l'écrasement global pour aligner toutes les configurations d'un seul clic.
Table Settings : Positionnez le tableau (haut, bas, gauche, droite), ajustez la taille de la police et désactivez-le si vous souhaitez un graphique épuré.
Gradient Settings : Réglez le pourcentage maximum (Max abs % for gradient, par défaut 15%) pour calibrer l'intensité des couleurs du tableau selon la volatilité de l'actif que vous tradez.
(Note : Cet indicateur est un outil d'aide à la décision et ne constitue pas un conseil financier. Utilisez-le en conjonction avec d'autres méthodes d'analyse comme le Price Action ou le volume.) อินดิเคเตอร์