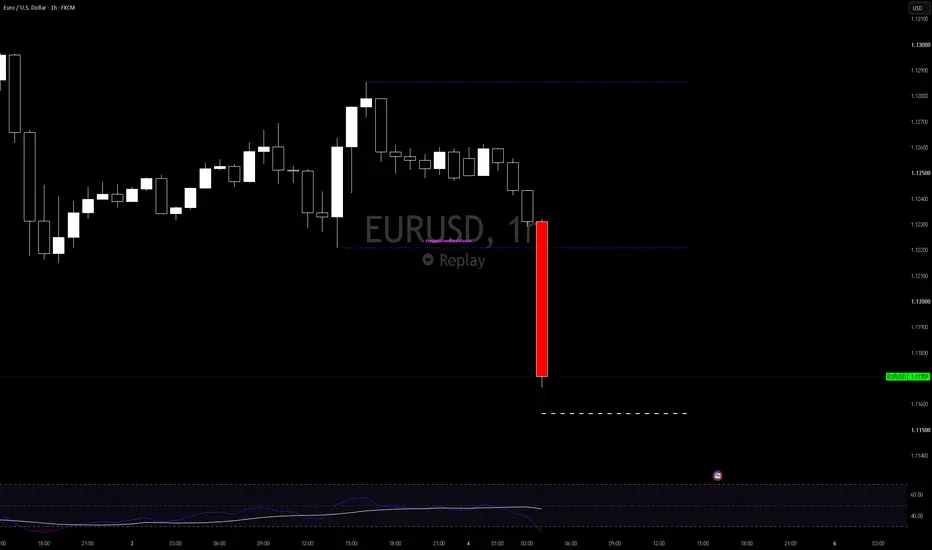
Dynamic Double-Touch S&R Zones [V6]This script is designed to identify high-probability Support and Resistance zones based on historical price retests. Unlike standard S&R indicators that draw simple lines, this tool identifies "Supply and Demand" areas by capturing the entire price action between the candle body and the wick extremity.
How it Works
Pivot Detection: The script identifies major price peaks and valleys using a customizable lookback period.
Confirmation (The Double-Touch): To keep the chart clean, a zone is
อินดิเคเตอร์