อินดิเคเตอร์

CASCADE DCA - Spot Long Strategy# CASCADE DCA 🌊 — Spot Long Strategy
### Intelligent accumulation with dynamic exits. No RSI. No guesswork.
---
## What is CASCADE DCA?
Most DCA strategies buy blindly at fixed intervals. CASCADE DCA is different — it only buys when the price is **consolidating at support**, not in free fall. It scales in with increasing position sizes as price drops, then exits when the bullish impulse is fully exhausted.
The result: high win rates, low drawdowns, and exits timed to capture the full bounce — not just the first tick of recovery.
---
## How It Works
### 🟢 Entry Logic — The "Scouting Entry"
The first buy is intentionally small (configurable, default $5). It fires when price drops a defined % from a recent swing high **and** lands in a consolidation zone. Think of it as placing a sensor, not a bet.
If price keeps falling, the strategy scales in with progressively larger positions at deeper levels — but only when price consolidates again. It never buys into a free fall.
### 📉 DCA Levels — Mathematical Progression
Drop distances follow a user-defined formula. You set the first DCA drop % and choose the progression type:
- **Linear (+)**: each level adds a fixed increment → 50% / 60% / 70% / 80%...
- **Geometric (×)**: each level multiplies → 50% / 65% / 84.5% / 109.8%...
Position sizes grow with each level (configurable multiplier), with a hard **safety cap** to prevent oversizing accidents.
### 🔲 Consolidation Filter — The Key Differentiator
Every buy — initial and DCA — requires the price to be in a **lateral zone**, detected by two independent indicators:
- **BBW** (Bollinger Band Width): narrow bands = price coiling = consolidation
- **ADX**: low values = no directional trend = sideways market
You can require either condition (permissive) or both simultaneously (strict mode).
### 💨 Exit Engine — VWM (Volume-Weighted Momentum)
This is the original indicator at the heart of CASCADE DCA. **No RSI used.**
**Formula:**
```
ROC = Rate of Change of price (n bars)
rVol = current volume / average volume
VWM = EMA( ROC × rVol , smoothing )
```
**Interpretation:**
- VWM > 0 and rising → impulse building → **HOLD**
- VWM > 0 and falling for N consecutive bars → impulse dying → **EXIT**
The exit only fires when the position is already profitable (configurable minimum). This prevents closing at a loss during post-entry noise.
An optional **Supertrend safety exit** catches sudden reversals that VWM might take longer to detect.
---
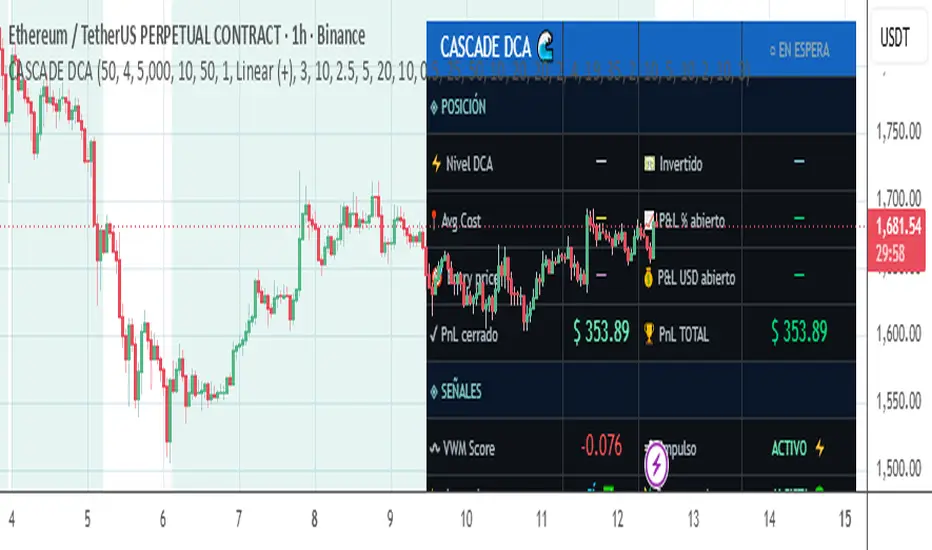
## Dashboard
A full real-time control panel shows:
- **Active DCA level** and total USD deployed
- **Average cost**, entry price, open P&L %
- **Open P&L USD**, closed P&L, and **Total P&L** (matches backtest exactly)
- Live VWM score and impulse status
- Lateral zone confirmation (BBW + ADX)
- Supertrend direction
- Full DCA schedule with drop %, trigger prices, and USD amounts — with ✓ for filled levels and ► for the next pending level
---
## Backtest Results (1H, Binance Spot Perpetuals)
| Pair | Period | Win Rate | Profit Factor | Total PnL|
|--------------------|---------------|--------------|-----------------|------------|
| 1000RATSUSDT | 18 months | **93.59%** | 1.87 | +$26.65 |
| AIOTUSDT | 13 months | **89.71%** | **23.97** | +$816.92 |
| ACXUSDT | 16 months | 80.00% | **9.54** | +$131.55 |
| ACTUSDT | 14 months | 85.19% | 2.47 | +$75.79 |
| 1000MOGUSDT | 17 months | 82.22% | 5.11 | +$72.19 |
| ACEUSDT | 15 months | 76.00% | 2.51 | +$25.38 |
| AEROUSDT | 14 months | 82.50% | 2.55 | +$46.95 |
| ACHUSDT | 15 months | 85.71% | 3.16 | +$14.08 |
> ⚠️ *Past performance does not guarantee future results. Always backtest on the specific pair and timeframe before live trading.*
---
## Recommended Settings (Starting Point)
| Parameter | Value | Notes |
|---------------------------|----------------|---------------------------------------|
| Base USD | $5 | Small scouting entry |
| Amount Increment | 10× | Scales fast — use the cap |
| Max USD Cap | $200 | Hard safety ceiling per level |
| Initial drop | 5% | From recent swing high |
| First DCA drop | 50% | From initial entry price |
| Progression | Linear +10% | Predictable spacing |
| DCA Levels | 9 | Red of safety — most never fire |
| Min profit to exit | 2% | Avoids exiting at a loss |
| Supertrend exit | ON | Safety net for sudden reversals |
---
## Best Use Cases
- ✅ Mid-cap altcoins on 1H timeframe (XXX/USDT spot)
- ✅ Markets that have already experienced a significant correction
- ✅ Pairs with volume — the VWM engine requires real volume data
- ❌ Do NOT use during sustained bear markets with no consolidation
- ❌ Do NOT use on illiquid pairs with manipulated volume
---
## Why No RSI?
RSI is a great indicator. It's also in roughly 80% of all published TradingView strategies. The VWM (Volume-Weighted Momentum) was designed specifically to measure impulse exhaustion using price velocity amplified by volume conviction — giving you a more dynamic read of when a rally is truly running out of steam, not just when price is "overbought" by a fixed threshold.
---
## Parameters Guide
**💰 DCA Amounts**
- `Base Amount`: USD invested on the initial scouting entry
- `Amount Increment`: Multiplier per level. Level 0 = Base×1, Level 1 = Base×1.5, etc.
- `Max USD Cap`: Hard ceiling — no single level can exceed this amount. **Always set this first.**
**📉 DCA Drop Progression**
- `Initial Entry drop %`: How far below the recent swing high to open the first position
- `First DCA drop %`: The anchor of the progression formula (measured from initial entry)
- `Progression Type`: Linear or Geometric spacing between levels
- `Linear Increment / Geometric Multiplier`: Controls how fast levels spread apart
**🔲 Lateral Zone Detection**
- `BBW threshold`: Lower = stricter consolidation requirement
- `ADX threshold`: Lower = stricter no-trend requirement
- `Require BOTH`: AND mode for strictest filtering
**🚀 Exit — VWM**
- `Min profit %`: Position must be profitable before exit can fire
- `Decay bars`: Consecutive bars of VWM decline needed to trigger exit
- `Supertrend exit`: Additional safety exit on trend reversal
---
*Built with 10 years of algorithmic trading experience. Designed for spot markets. Long only.*
*The VWM indicator is original to this strategy.*
กลยุทธ์

Nadaraya-Watson Regression Liquidity Sweeps [AlgoAlpha]🟠 OVERVIEW
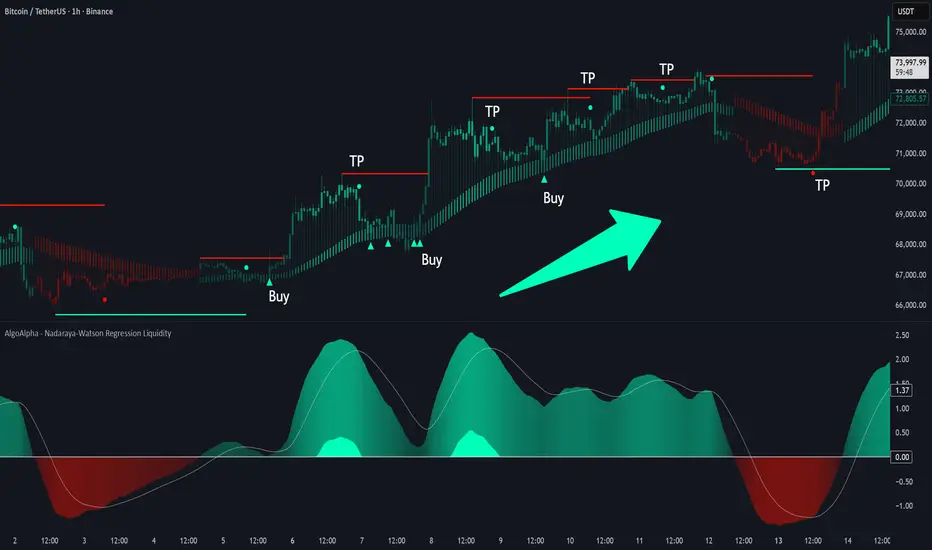
This script combines Nadaraya-Watson regression, momentum analysis, and liquidity level tracking into a single workflow. It measures the slope of a smoothed price regression curve, converts that slope into a normalized oscillator, and uses momentum shifts to identify areas where liquidity may be resting.
The oscillator is built from the rate of change of the Nadaraya-Watson estimate rather than price itself. This allows momentum transitions to be measured relative to the underlying regression trend. When momentum weakens after an extended move, the script records swing-based liquidity levels that can later be swept by price.
A volatility-adjusted Nadaraya-Watson band is also displayed on the chart. This provides context for trend direction, momentum strength, and potential rebound conditions around the regression value.
🟠 CONCEPTS
Nadaraya-Watson Regression — A kernel-based smoothing method that estimates an underlying price curve by weighting nearby historical data more heavily than distant data.
Normalized Regression Slope — The change in the Nadaraya-Watson estimate divided by its recent standard deviation, allowing momentum strength to be compared across different market conditions.
Liquidity Sweep Level — A horizontal level created from a swing high or swing low when momentum begins to weaken, representing an area that may later attract price.
Oscillator Signal Line — An EMA of the normalized oscillator used to identify momentum crossovers and momentum phase changes.
Rebound Condition — A signal generated when price moves back through the Nadaraya-Watson value while oscillator direction remains aligned with the prevailing momentum bias.
🟠 FEATURES
Normalized Nadaraya-Watson Oscillator — Measures momentum using the slope of a smoothed regression curve.
Liquidity Sweep Detection — Creates liquidity levels when bullish or bearish momentum begins to weaken.
Volatility-Adjusted Regression Band — Displays a dynamic overlay around the Nadaraya-Watson estimate using smoothed ATR values.
Momentum Weakening Signals — Marks locations where oscillator momentum begins to lose strength against the current directional bias.
Rebound Signals — Highlights situations where price reclaims or loses the regression value while momentum remains aligned with trend direction.
🟠 HOW TO USE
Monitor the oscillator relative to its signal line to identify momentum shifts and changes in directional bias.
Watch for newly created liquidity levels after momentum weakening events, as these levels may become future sweep targets.
Use sweeps of upper or lower liquidity levels to identify areas where price has taken resting liquidity.
Look for bullish rebound signals when price reclaims the regression value while bullish momentum remains active.
Look for bearish rebound signals when price loses the regression value while bearish momentum remains active.
Combine oscillator direction, liquidity levels, and regression band structure to build context around trend continuation or reversal scenarios.
🟠 CONCLUSION
The Nadaraya-Watson Regression Liquidity Sweeps indicator combines regression-based momentum analysis, volatility-adjusted trend structure, and liquidity level tracking. By linking momentum transitions to swing-derived liquidity zones, it helps identify where liquidity may be forming and when it has been swept. This provides traders with additional context for trend analysis, pullbacks, and potential reversal areas. อินดิเคเตอร์

Adaptive Expansion Framework Adaptive Expansion Framework (AEF)
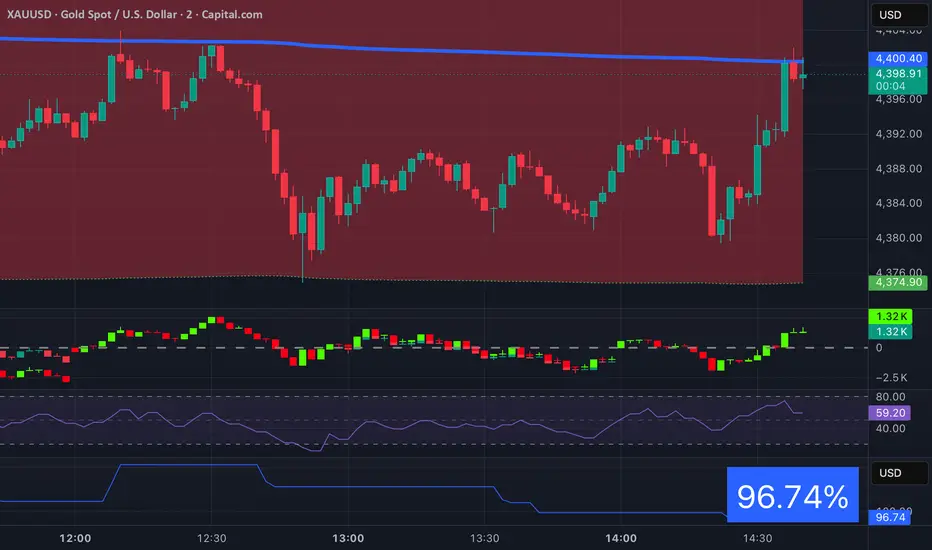
AEF combines six classic volatility/structure concepts into one clean overlay so you can read market structure and expansion potential at a glance, without stacking five separate indicators.
WHAT IT COMBINES
1. Regression channel — a straight linear-regression channel (mid ± stdev) defines the prevailing structure and slope.
2. Equilibrium zone — an inner band around the regression line marks "fair value," helping separate mean-reversion from continuation context.
3. Volatility compression — Bollinger band-width is ranked as a percentile against its own lookback; when volatility coils into the lowest percentiles, the equilibrium band brightens and the chart gets a faint tint.
4. Range vs trend detection — Kaufman-style efficiency ratio plus slope classify the tape as Compression, Trending, or Ranging.
5. Breakout detection — a close beyond a channel wall, confirmed by range expansion (and optional volume), flags a breakout.
6. Expansion projection — on a confirmed break, a measured-move target (full channel height) is projected forward, with a 0–100 breakout-quality grade attached.
BREAKOUT QUALITY SCORE (0–100)
Each breakout is graded from four inputs: range expansion (35%), volume (25%), how compressed volatility was just before the break (25%), and how decisively price pierced the wall (15%). Grades A/B/C/D help filter weak or suspect breaks from clean ones.
DASHBOARD
Shows current regime, efficiency %, compression percentile, price position vs equilibrium, and the last signal with its quality grade.
HOW TO USE
- Use the regime label to pick context: fade extremes inside the channel when Ranging, look for breaks when Compression resolves.
- Treat the projection target as a reference level, not a guarantee.
- Higher-grade breakouts (A/B) that resolve a compression phase tend to be the cleaner setups; low-efficiency C/D breaks are more prone to fade.
KEY INPUTS
- Regression length: structural context window.
- Channel width (stdev x) and Equilibrium band: zone sizing.
- Compression percentile: how tight volatility must get to flag a setup.
- Trend efficiency threshold: range vs trend sensitivity.
- Breakout range x ATR / optional volume: how decisive a break must be.
BEHAVIOR ON THE LAST BAR
The channel, equilibrium band and projection are drawn on the most recent bar and update live. Breakout signals are evaluated on closing crosses, so on the currently forming (real-time) bar a signal can appear and disappear until the bar closes. Always confirm signals on closed bars before acting.
NOTES
This is an analysis tool, not a signal service. It does not predict price and is not financial advice. Test settings on your own instrument and timeframe before relying on it. Defaults are tuned for liquid index instruments on intraday timeframes (volume confirmation is off by default). อินดิเคเตอร์

Micro Pivot
Short description:
A structure-based intraday framework that highlights small pivot points where price may be transitioning from continuation to rejection, or from pullback to renewed directional control.
Full description:
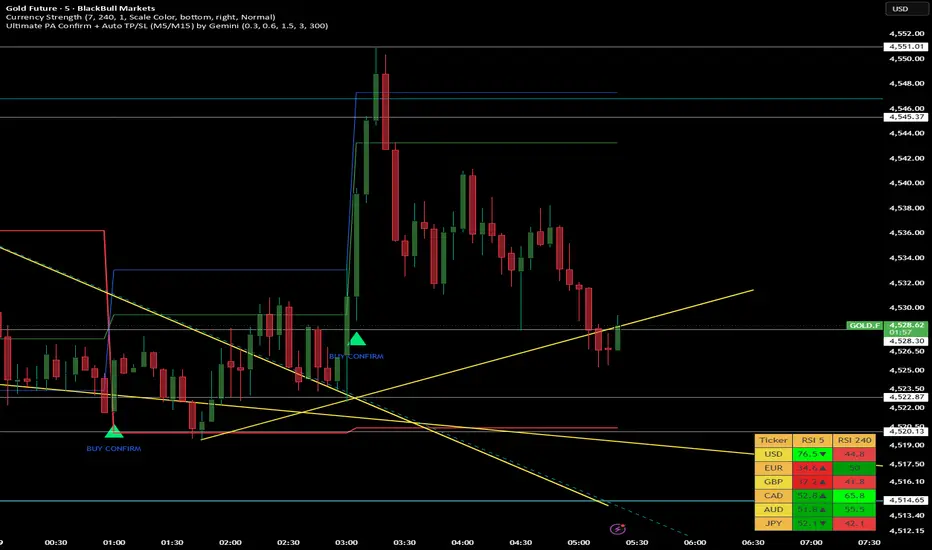
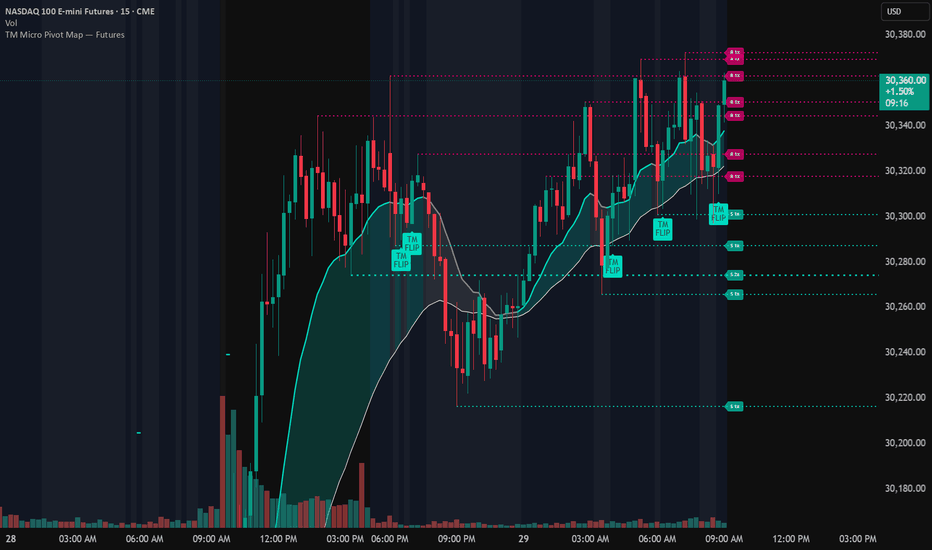
The TM Micro Pivot Framework is a research and validation tool for studying short-term market structure. It is designed to help traders identify compact swing points, local support/resistance reactions, and potential continuation or rejection zones on intraday charts.
This concept focuses on micro pivots: small but meaningful inflection areas that can appear before larger directional moves. Rather than treating every minor swing as important, the framework is intended to organize price action around repeatable structure: prior swing highs/lows, reaction zones, trend context, volatility, and invalidation levels.
Core use cases:
- Identify local intraday pivot highs and pivot lows.
- Mark potential reaction zones where price may pause, reject, or continue.
- Study pullback behavior inside a larger trend context.
- Compare aggressive early structure signals against more conservative confirmation signals.
- Support forward testing and strategy research before any live execution decision.
How to read it:
A bullish micro pivot area may form when price creates a local low, holds above a prior reaction zone, and begins to reclaim short-term structure. A bearish micro pivot area may form when price creates a local high, rejects a prior reaction zone, and begins to lose short-term structure.
Signals and plots are not trade recommendations. They are visual research markers intended to help traders study whether specific structure conditions are present.
Suggested validation workflow:
1. Start with the higher-timeframe trend and key levels.
2. Use the micro pivot markers to identify local structure changes.
3. Define invalidation before considering any setup.
4. Forward test the behavior in a controlled environment.
5. Review results over a meaningful sample before making execution decisions.
Important notes:
- This tool does not predict market direction.
- This tool does not guarantee profitable trades.
- This tool should not be used as a standalone trading system.
- Market conditions, liquidity, volatility, news, and execution quality can materially affect outcomes.
- Any strategy based on this concept should be tested and validated before use.
Risk disclaimer:
Trading futures, stocks, options, forex, crypto, and other financial instruments involves substantial risk and may not be suitable for all traders. Past performance is not indicative of future results. This script is provided for educational and research purposes only and should not be considered financial advice, investment advice, or a recommendation to buy or sell any instrument. Traders are responsible for their own decisions, risk management, and compliance with applicable rules and regulations.
Publication note:
This description is written for TradingView educational/research presentation. It avoids performance claims, guaranteed outcomes, financial advice, and unverifiable profitability language.
อินดิเคเตอร์
Smart Trend Flow Pro [MarkitTick]💡 Navigating modern market structures requires a robust mechanism capable of filtering out transient noise while capturing the dominant directional vectors. The Smart Trend Flow pro is an advanced analytical framework designed to dynamically track market momentum and volatility, transforming complex price action into a highly readable, visual heatmap. By synthesizing trend identification with continuous volatility scaling, this tool aims to provide clarity in both ranging environments and high-expansion phases, allowing for more structured and disciplined market analysis.
✨ Originality and Utility
● A Paradigm Shift in Trend Visualization
Traditional channel-based indicators often suffer from severe lag or become entirely unreadable during periods of intense market contraction. The utility of this script lies in its adaptive ability to map structural boundaries and instantly correlate them with localized market energy. By discarding static thresholds in favor of a dynamic, self-adjusting baseline, the tool presents a unified view of both direction and conviction.
● Beyond Binary Signals
Standard indicators frequently rely on binary conditions—such as a simple moving average crossover—which ignore the underlying volatility context. This script pioneers a synthesized approach where the strength of a trend is continuously evaluated against its own historical variance. This allows users to visually differentiate between a low-conviction drift and a highly energized breakout, providing a much richer context for potential trade management and risk assessment.
🔬 Methodology and Concepts
● Dynamic Boundary Engine
At the core of the script is a reactive boundary detection mechanism. Rather than projecting fixed bands, the engine establishes fluid upper and lower parameters based on recent localized extremes. These boundaries can be structurally smoothed using various adaptive algorithms, effectively tuning the sensitivity of the channel to match the specific rhythm of the asset being analyzed.
● Volatility Normalization Process
To accurately gauge market energy, the framework continuously measures the distance between the established boundaries. This raw measurement is then subjected to a rigorous statistical normalization process. By evaluating current fluctuations against a rolling historical baseline, the engine maps the resulting variance onto a bounded curvilinear scale. This abstract transformation isolates the pure kinetic energy of the market, stripping away absolute price dependencies to provide a standardized metric of volatility expansion and contraction.
● Integrated State Tracking
The logical engine monitors the interaction between the closing prices and the smoothed boundary parameters. A structural shift is recognized only when price definitively breaches and sustains its position relative to these dynamic thresholds. This state-tracking ensures that the primary directional bias is maintained until a statistically significant reversal occurs, minimizing false positives during minor retracements.
🎨 Visual Guide
● Color-Coded Heatmap Candles
The primary visual feature is the complete transformation of the standard candlestick chart into a continuous heatmap. The colors directly correspond to the synchronized output of the trend direction and the normalized volatility metric.
Bullish Gradients: When the market establishes an upward bias, the candles transition through a cool-to-hot spectrum. Deep, cold colors represent low-volatility accumulation phases, while bright, hot neon colors signify intense, high-volatility bullish expansion.
Bearish Gradients: Conversely, downward structural shifts are mapped using a separate color spectrum. Dark, muted tones indicate slow, grinding bearish action, whereas vivid, hot colors highlight rapid, high-volatility sell-offs.
Neutral States: When the price resides within the core boundary parameters, demonstrating no clear directional dominance, the candles default to a flat, neutral gray to reduce visual noise.
● Signal Markers
Buy Labels: Distinct markers appear precisely below the price action when the engine confirms a definitive upward structural breach.
Sell Labels: Clear markers are printed above the price action upon the confirmation of a downward structural breach.
📖 How to Use
● Interpreting the Heatmap
The most effective way to utilize this tool is to read the candle colors as a topographical map of market energy. A transition from a neutral state into a cold bullish or bearish color suggests the early formation of a trend. As the colors heat up and transition toward their neon extremes, it confirms that the directional move is being supported by expanding volatility, which often characterizes the most robust phase of a trend.
● Managing Trend Exhaustion
Traders can monitor the intensity of the heatmap to gauge potential momentum decay. If a strong trend has been characterized by hot, neon colors, a gradual cooling off—where the colors revert to darker, colder shades—may indicate that the localized volatility is subsiding, suggesting potential consolidation or a pending structural shift.
● Confirming Breakouts
The printed Buy and Sell labels serve as structural confirmation points. These markers are best utilized not in isolation, but in confluence with the heatmap. A signal label accompanied by an immediate transition into a high-volatility color spectrum carries significantly more analytical weight than a signal that remains mired in a cold or neutral visual state.
⚙️ Inputs and Settings
● Channel Settings
Channel Length: Determines the primary lookback window for establishing the core upper and lower boundaries. Increasing this value creates a wider, slower-moving channel, while decreasing it makes the system highly sensitive to recent price action.
Channel MA Type: Allows the user to apply different smoothing algorithms to the boundaries. Options range from the standard baseline to advanced weighting methods, providing precise control over signal reactivity.
● Analytics Settings
Squeeze/Z-Score Length: Defines the historical window used to evaluate the relative volatility. A longer length provides a smoother, more macro-level volatility assessment, while a shorter length makes the heatmap highly reactive to sudden micro-expansions.
● Candle Heatmap Settings
Bullish/Bearish Color Controls: Fully customizable inputs allowing the user to define the exact hex values for the cold and hot extremes of both the bullish and bearish spectrums.
Neutral Market Base: The default color applied when the market is bound within the channel without a confirmed directional state.
● Signal Settings
Label Colors: Configurable color selections for the printed Buy and Sell confirmation markers.
🔍 Deconstruction of the Underlying Scientific and Academic Framework
● Topological Price Mapping
At a fundamental level, the script treats financial time-series data not as discrete data points, but as a continuous topological surface. By evaluating the highest and lowest ranges over a specified temporal window, it effectively creates a rolling bounding box that encapsulates the probable distribution of future price vectors. The application of sophisticated moving average algorithms to these boundaries acts as a low-pass filter, mathematically attenuating high-frequency noise and exposing the true underlying macroeconomic drift.
● Non-Linear Variance Scaling
The most complex aspect of the engine is its approach to variance. Standard deviation on its own is an unbounded metric, making it difficult to utilize in a standardized visual format. The script solves this by isolating the width of the bounding box and comparing it against its own moving average and standard deviation. This transforms the raw width into a standardized probabilistic metric.
● The Sigmoidal Activation Function
To achieve the seamless visual gradient, this standardized variance must be mapped onto a finite plane. The engine employs a logistic function—specifically, a sigmoidal activation curve—to compress the unbounded variance data strictly between a 0 and 100 scale. This non-linear mapping ensures that the visual heatmap remains highly sensitive to subtle shifts around the mean, while gracefully asymptotically compressing extreme, outlier volatility spikes, thereby maintaining absolute visual coherence regardless of the asset's inherent behavior.
⚠️ Disclaimer
All provided scripts and indicators are strictly for educational exploration and must not be interpreted as financial advice or a recommendation to execute trades. I expressly disclaim all liability for any financial losses or damages that may result, directly or indirectly, from the reliance on or application of these tools. Market participation carries inherent risk where past performance never guarantees future returns, leaving all investment decisions and due diligence solely at your own discretion. อินดิเคเตอร์

MTF RSI Price Levels [DIN]## 📌 MTF RSI Price Levels
**What if your RSI could tell you exactly where price needs to go — before it gets there?**
Most traders use RSI to read momentum after the fact. This indicator flips that entirely. Instead of watching RSI react to price, **MTF RSI Price Levels projects the exact price required for RSI to reach overbought or oversold on up to four timeframes simultaneously** — plotted live, directly on your chart, right now.
The result is a set of forward-looking price levels that act as precision targets and confluence zones. Whether you're scalping the 1H or positioning on the weekly, you'll know in advance where RSI exhaustion lives — and when multiple timeframes agree, those levels become some of the most powerful areas on your chart.
---
## 🔬 How It Works
The RSI Price Level math is built on Wilder's smoothing algorithm — the same engine that powers the standard RSI. At every bar close, the indicator works backwards through the formula: given the current average gain and average loss at a specific timeframe, it solves for the exact closing price that would push RSI to your target level (default 70 overbought / 30 oversold) on the next bar.
This is not an approximation. It is a mathematically derived price level, recalculated live across every timeframe you have enabled, displayed as a labeled box and a centerline extending right from the current bar. Every time price moves, the levels update. Every time a new bar closes, the calculation refreshes.
Run it on crypto, forex, indices, or equities — wherever RSI has teeth, these levels will show you exactly where the market is being pulled.
---
## ☁️ The MTF Cloud
Above and below price, two dynamic clouds form — one anchored at your overbought RSI level, one at oversold — each blending between two user-selected timeframes. Where the clouds from different timeframes converge, you get a gradient zone of confluence. The closer price approaches these areas, the more compressed momentum tends to become.
The cloud is not decorative. It represents the space between what two different timeframe RSI calculations say about the same price level. When they agree, the cloud tightens. When they diverge, it widens. Bull and bear coloring shifts automatically based on where current price sits relative to the zone, giving you an instant read on whether you're approaching resistance or support.
---
## 📐 Built-In Divergence Engine
Hidden momentum shifts are detected automatically using a pivot-based divergence system running on your chosen timeframe. When price prints a higher high but RSI prints a lower high — or vice versa — the signal is marked directly on the chart with a clear label. No separate RSI panel needed. No manual scanning. The divergence comes to you.
- **Bearish Divergence (DIV▼)** — Price higher high, RSI lower high. Momentum fading into resistance.
- **Bullish Divergence (DIV▲)** — Price lower low, RSI higher low. Momentum building into support.
Both pivot lookback and divergence timeframe are fully adjustable.
---
## ⚙️ Full Customization — Built for Serious Traders
This indicator was designed so that no two setups have to look alike. Every parameter that matters is exposed in the settings panel, organized by group:
**Per Timeframe (up to 4 timeframes):**
- Timeframe selection (any TF supported by TradingView)
- Independent RSI length per timeframe
- Independent RSI source per timeframe
- Custom overbought and oversold threshold levels
- Individual box color, line color, and transparency per TF
**Cloud Settings:**
- Choose any two timeframes to anchor the cloud
- Set your own Level A and Level B for the fill range
- Independent bull and bear color for inner and outer cloud layers
- Gradual two-layer gradient fade built in
**Box & Line Style:**
- Box extend length (how far right the box projects)
- Box height as a percentage of price (works across all asset classes)
- Line width and line style (solid, dashed, dotted)
- Toggle labels on/off with adjustable label size
**Divergence:**
- Enable/disable divergence detection independently
- Choose the timeframe RSI runs the divergence scan on
- Adjust RSI length and pivot lookback for sensitivity control
**Alerts (4 Conditions):**
- Price enters any overbought zone
- Price enters any oversold zone
- Bullish divergence detected
- Bearish divergence detected
Set your alerts once. Let the indicator do the watching.
---
## 🎯 Best Use Cases
- **Confluence trading** — Stack multiple TF RSI levels and watch for price to cluster around the same area across 1H, 4H, Daily, and Weekly simultaneously. These are your highest-conviction zones.
- **Target projection** — In a trending move, use the OB levels on higher timeframes as your take-profit targets. The math tells you where RSI exhaustion lives.
- **Reversal hunting** — When price is approaching a major OS level on the Daily or Weekly with bullish divergence firing beneath, you have a layered, high-probability setup.
- **Scalping structure** — On lower timeframes, the levels act as short-term magnets. Watch how price respects or breaks through these zones and trade the reaction.
---
## 📋 Usage Notes
- **Higher timeframe levels carry more weight.** A Weekly OB level that aligns with a Daily OB level is significantly more significant than either alone.
- **The box height input is a percentage of price.** The default (0.003 = 0.3%) works well for most assets. Crypto with large price ranges may benefit from a lower value; lower-priced assets may need it slightly higher.
- **Divergence signals are plotted with an offset** equal to the pivot lookback period. This means the signal appears when the pivot is confirmed, not at the exact candle — this is intentional and keeps signals non-repainting.
- **Cloud timeframes are independent of the level timeframes.** You can run 1H + 4H levels while anchoring your cloud to 4H + Daily for a broader confluence picture.
---
## 🔔 Alerts Setup
After adding the indicator to your chart, go to the Alerts panel, create a new alert, and select this indicator from the condition dropdown. Four conditions are available:
1. Price in OB Zone
2. Price in OS Zone
3. Bearish Divergence Found
4. Bullish Divergence Found
---
*Built for traders who want their RSI to work harder.*
*Clean levels. Real math. No guessing.*
**— DIN** อินดิเคเตอร์

Volatility Power ZonesENGLISH DESCRIPTION
Volatility Power Zones is a multi-layer visual trading tool designed to combine volatility pressure, trend direction, momentum strength, volume confirmation and ATR-based trade zones into one clean chart structure.
This indicator is not designed to be used only by reading a single number. The healthiest interpretation comes from combining the Omega Score, the WVF line, the 3D ATR band, the green/red band structure, volume condition and power nodes together.
The main idea is simple: the market is stronger when price structure, trend, RSI, volume and WVF position support the same direction. When these elements separate from each other, the market should be treated with more caution.
CORE CALCULATIONS
The system uses Williams Vix Fix logic as the volatility-pressure base.
WVF is calculated from the highest high over the selected length and the current close:
WVF = ((Highest High - Close) / Highest High) × 100
Then this WVF value is smoothed with EMA to create the main WVF line.
The upper and lower WVF levels are created by multiplying the smoothed WVF value with user-defined upper and lower multipliers.
The WVF structure is then fitted onto the price chart by anchoring it around the recent lowest low and scaling it visually. This allows the WVF pressure line and band to be read directly on the chart instead of only in a separate oscillator panel.
ATR is used to create the 3D band zone around the WVF line. The band is divided into four visual layers:
Outer 3D Zone
Mid 3D Zone
Inner 3D Zone
Core 3D Zone
These layers create a soft depth effect and help the user visually understand expansion, compression and possible breakout areas.
OMEGA POWER SCORE
The Omega Score is calculated from four main components:
1. Trend Power
EMA 21 is compared with EMA 55.
If EMA 21 is above EMA 55, trend power is bullish.
If EMA 21 is below EMA 55, trend power is bearish.
2. RSI Power
RSI above 55 adds bullish strength.
RSI below 45 adds bearish strength.
RSI between 45 and 55 is treated as neutral.
3. WVF Power
If price is above the fitted WVF line, WVF power is bullish.
If price is below the fitted WVF line, WVF power is bearish.
4. Volume Power
If volume is above its 20-period average and the candle is bullish, volume power supports the bulls.
If volume is above its 20-period average and the candle is bearish, volume power supports the bears.
If volume is weak, volume power is neutral.
These four values are combined into one raw score and converted into a percentage between 0 and 100.
Omega Score above 55 suggests bullish pressure.
Omega Score below 45 suggests bearish pressure.
Between 45 and 55 is a neutral or decision zone.
HOW TO USE THE INDICATOR
The best trading zones are not created by the score alone. A strong setup appears when the Omega Score, the green band, the WVF line and price behavior confirm each other.
Bullish trade zones are healthier when:
The Omega Score is above 55.
Price is above the WVF line.
The band is green.
EMA trend is bullish.
RSI is above the neutral zone.
Volume supports the move.
Power nodes appear near a pivot low or after compression.
Bearish trade zones are healthier when:
The Omega Score is below 45.
Price is below the WVF line.
The band is red.
EMA trend is bearish.
RSI is below the neutral zone.
Volume supports selling pressure.
Power nodes appear near a pivot high or after compression.
The green band should not be used alone. The score should not be used alone. The strongest reading comes when the visual band and the Omega Score agree at the same time.
BAND COMPRESSION AND BREAKOUT LOGIC
One of the most important parts of this indicator is the 3D ATR band.
When the band becomes narrow, compressed or visually tight, it can show that the market is preparing for a larger move. These areas can be breakout preparation zones.
A narrow band does not mean the breakout direction is guaranteed. Direction should be confirmed by:
Omega Score
WVF line position
Price closing above or below the band
Volume increase
EMA trend direction
RSI strength
The best breakout areas usually appear when price compresses around the WVF band, the band becomes tight, and then price breaks away with rising Omega Score and stronger volume.
For bullish breakout conditions, look for price moving above the WVF upper zone while Omega Score turns bullish and the band color supports the move.
For bearish breakout conditions, look for price moving below the WVF lower zone while Omega Score turns bearish and the band color supports the move.
POWER NODES
Power Nodes are visual pivot-based markers. They appear around confirmed pivot highs and pivot lows. The number shown near the node is the current Omega Score.
These nodes are useful for reading market strength at turning points.
A low pivot with a strong Omega Score may suggest accumulation or bullish recovery.
A high pivot with a weak Omega Score may suggest distribution or bearish pressure.
A pivot with neutral score should be treated carefully because it may represent range movement.
Power Nodes should not be treated as automatic buy or sell signals. They are confirmation markers. The healthiest use is to combine the node score with the band color, WVF line, trend and volume.
PANEL INTERPRETATION
The panel shows the internal state of the indicator.
OMEGA shows the total combined power percentage.
TREND shows EMA 21 versus EMA 55.
RSI shows momentum condition.
WVF shows whether price is above or below the WVF line.
VOLUME shows whether current volume is strong or weak.
ATR shows current volatility.
SIGNAL gives a combined reading such as STRONG-BUY, STRONG-SELL or HOLD.
POWERS displays internal trend and volume power values.
The panel is designed as a decision-support area. It should be read together with the chart, not separately.
BEST PRACTICE
The strongest setups usually appear when multiple parts of the system agree:
Green band + Omega above 55 + price above WVF + bullish trend + strong volume = healthier bullish zone.
Red band + Omega below 45 + price below WVF + bearish trend + strong volume = healthier bearish zone.
Narrow band + rising volume + breakout from WVF zone + score confirmation = possible breakout trade zone.
Neutral score + mixed band + weak volume = avoid or wait zone.
This indicator is designed to reduce random decisions by forcing the user to look at combined evidence instead of only one signal.
IMPORTANT NOTE
No indicator can predict the market with certainty. OMEGA WVF 3D Power Nodes should be used as a visual decision-support tool. It is most useful when combined with price action, risk management, higher timeframe direction and personal trading rules.
TÜRKÇE AÇIKLAMA
OMEGA WVF 3D Power Nodes; volatilite baskısı, trend yönü, momentum gücü, hacim onayı ve ATR tabanlı trade bölgelerini tek grafik üzerinde birleştirmek için tasarlanmış çok katmanlı görsel bir analiz aracıdır.
Bu gösterge sadece tek bir rakama bakılarak kullanılmak için tasarlanmamıştır. En sağlıklı yorum; Omega Skoru, WVF çizgisi, 3D ATR bandı, yeşil/kırmızı bant yapısı, hacim durumu ve power node noktaları birlikte değerlendirildiğinde ortaya çıkar.
Ana fikir şudur: fiyat yapısı, trend, RSI, hacim ve WVF konumu aynı yönü desteklediğinde piyasa daha güçlü okunur. Bu parçalar birbirinden ayrıştığında piyasa daha dikkatli izlenmelidir.
TEMEL HESAPLAMALAR
Sistem volatilite baskısı için Williams Vix Fix mantığını temel alır.
WVF, seçilen uzunluk içindeki en yüksek fiyat ile mevcut kapanış arasındaki farktan hesaplanır:
WVF = ((En Yüksek Fiyat - Kapanış) / En Yüksek Fiyat) × 100
Daha sonra bu WVF değeri EMA ile yumuşatılır ve ana WVF çizgisi oluşturulur.
Üst ve alt WVF seviyeleri, yumuşatılmış WVF değerinin kullanıcı tarafından belirlenen üst ve alt çarpanlarla çarpılmasıyla elde edilir.
WVF yapısı daha sonra fiyat grafiğine oturtulur. Bunun için yakın dönem en düşük fiyat referans alınır ve WVF değeri görsel olarak fiyat ölçeğine taşınır. Böylece WVF baskı çizgisi ve bandı ayrı bir osilatör gibi değil, doğrudan fiyat grafiği üzerinde okunabilir.
ATR, WVF çizgisinin etrafında 3D bant bölgesi oluşturmak için kullanılır. Bant dört görsel katmana ayrılmıştır:
Dış 3D Bölge
Orta 3D Bölge
İç 3D Bölge
Çekirdek 3D Bölge
Bu katmanlar derinlik hissi verir ve kullanıcının genişleme, daralma ve olası breakout bölgelerini daha rahat görmesini sağlar.
OMEGA GÜÇ SKORU
Omega Skoru dört ana bileşenden oluşur:
1. Trend Gücü
EMA 21, EMA 55 ile karşılaştırılır.
EMA 21, EMA 55’in üzerindeyse trend gücü pozitiftir.
EMA 21, EMA 55’in altındaysa trend gücü negatiftir.
2. RSI Gücü
RSI 55 üzerindeyse pozitif momentum kabul edilir.
RSI 45 altındaysa negatif momentum kabul edilir.
RSI 45 ile 55 arasındaysa nötr bölge kabul edilir.
3. WVF Gücü
Fiyat WVF çizgisinin üzerindeyse WVF gücü pozitiftir.
Fiyat WVF çizgisinin altındaysa WVF gücü negatiftir.
4. Hacim Gücü
Hacim 20 periyotluk ortalamanın üzerindeyse ve mum pozitifse hacim boğaları destekler.
Hacim 20 periyotluk ortalamanın üzerindeyse ve mum negatifse hacim ayıları destekler.
Hacim zayıfsa hacim gücü nötr kabul edilir.
Bu dört güç değeri birleştirilir ve 0 ile 100 arasında yüzdelik Omega Skoru oluşturulur.
Omega Skoru 55 üzerindeyse pozitif baskı öne çıkar.
Omega Skoru 45 altındaysa negatif baskı öne çıkar.
45 ile 55 arası karar, denge veya nötr bölge olarak okunur.
GÖSTERGE NASIL KULLANILMALI?
En iyi trade bölgeleri yalnızca skorla oluşmaz. Güçlü kurulumlar; Omega Skoru, yeşil bant, WVF çizgisi ve fiyat davranışı aynı yönü desteklediğinde oluşur.
Daha sağlıklı yükseliş bölgeleri için:
Omega Skoru 55 üzerinde olmalı.
Fiyat WVF çizgisinin üzerinde olmalı.
Bant yeşil olmalı.
EMA trendi pozitif olmalı.
RSI nötr bölgenin üzerinde olmalı.
Hacim hareketi desteklemeli.
Power node dip bölgesinde veya sıkışma sonrası oluşmalı.
Daha sağlıklı düşüş bölgeleri için:
Omega Skoru 45 altında olmalı.
Fiyat WVF çizgisinin altında olmalı.
Bant kırmızı olmalı.
EMA trendi negatif olmalı.
RSI nötr bölgenin altında olmalı.
Hacim satış baskısını desteklemeli.
Power node tepe bölgesinde veya sıkışma sonrası oluşmalı.
Yeşil bant tek başına kullanılmamalıdır. Omega Skoru da tek başına kullanılmamalıdır. En güçlü okuma, görsel bant ile skor aynı anda aynı yönü gösterdiğinde oluşur.
BANT DARALMASI VE BREAKOUT MANTIĞI
Bu göstergenin en önemli bölümlerinden biri 3D ATR bandıdır.
Bant daraldığında, sıkıştığında veya görsel olarak inceldiğinde piyasanın daha büyük bir harekete hazırlandığı düşünülebilir. Bu bölgeler breakout hazırlık alanları olabilir.
Fakat bant daralması tek başına yön garantisi vermez. Yön şu parçalarla teyit edilmelidir:
Omega Skoru
WVF çizgisi konumu
Fiyatın bandın üstüne veya altına kapanış yapması
Hacim artışı
EMA trend yönü
RSI gücü
En iyi breakout bölgeleri genellikle fiyat WVF bandı etrafında sıkışırken, bant daralırken ve ardından Omega Skoru ile hacim artışı eşliğinde fiyatın banttan uzaklaşmasıyla oluşur.
Pozitif breakout için fiyatın WVF üst bölgesinin üzerine çıkması, Omega Skorunun pozitif tarafa dönmesi ve bant renginin hareketi desteklemesi beklenebilir.
Negatif breakout için fiyatın WVF alt bölgesinin altına inmesi, Omega Skorunun negatif tarafa dönmesi ve bant renginin hareketi desteklemesi beklenebilir.
POWER NODE NOKTALARI
Power Node noktaları pivot tabanlı görsel işaretlerdir. Onaylanmış tepe ve dip bölgelerinde görünürler. Node yanında görünen rakam mevcut Omega Skorunu gösterir.
Bu noktalar dönüş bölgelerinde piyasa gücünü okumak için kullanılır.
Dip pivot bölgesinde yüksek Omega Skoru, toparlanma veya alım baskısı ihtimalini güçlendirebilir.
Tepe pivot bölgesinde düşük Omega Skoru, dağıtım veya satış baskısı ihtimalini güçlendirebilir.
Nötr skorlu pivotlar dikkatli değerlendirilmelidir çünkü piyasa yatay veya kararsız olabilir.
Power Node noktaları otomatik al/sat sinyali gibi görülmemelidir. Bunlar teyit işaretleridir. En sağlıklı kullanım; node skoru, bant rengi, WVF çizgisi, trend ve hacim birlikte değerlendirildiğinde oluşur.
PANEL OKUMA
Panel göstergenin iç durumunu gösterir.
OMEGA toplam birleşik güç yüzdesini gösterir.
TREND EMA 21 ve EMA 55 ilişkisini gösterir.
RSI momentum durumunu gösterir.
WVF fiyatın WVF çizgisinin üzerinde mi altında mı olduğunu gösterir.
VOLUME mevcut hacmin güçlü mü zayıf mı olduğunu gösterir.
ATR mevcut volatiliteyi gösterir.
SIGNAL birleşik okuma sonucunu STRONG-BUY, STRONG-SELL veya HOLD olarak verir.
POWERS trend ve hacim güç değerlerini gösterir.
Panel tek başına değil, grafik yapısıyla birlikte okunmalıdır. Panel karar destek alanıdır.
EN SAĞLIKLI KULLANIM
En güçlü kurulumlar sistemin birden fazla parçası aynı yönü gösterdiğinde oluşur:
Yeşil bant + Omega 55 üzeri + fiyat WVF üzerinde + pozitif trend + güçlü hacim = daha sağlıklı yükseliş bölgesi.
Kırmızı bant + Omega 45 altı + fiyat WVF altında + negatif trend + güçlü hacim = daha sağlıklı düşüş bölgesi.
Daralan bant + artan hacim + WVF bölgesinden breakout + skor teyidi = olası güçlü trade bölgesi.
Nötr skor + karışık bant + zayıf hacim = bekleme veya işlemden uzak durma bölgesi.
Bu gösterge, kullanıcıyı tek bir sinyale bağlı kalmaktan uzaklaştırmak ve birleşik kanıtlarla daha sağlıklı karar vermeye yönlendirmek için tasarlanmıştır.
ÖNEMLİ NOT
Hiçbir gösterge piyasayı kesin olarak tahmin edemez. OMEGA WVF 3D Power Nodes bir karar destek ve görsel analiz aracıdır. En verimli kullanım; fiyat aksiyonu, risk yönetimi, üst zaman dilimi yönü ve kişisel işlem kurallarıyla birlikte yapılır.
อินดิเคเตอร์

อินดิเคเตอร์

Quantum Flux Bands [JOAT]Quantum Flux Bands
Quantum Flux Bands is an institutional-style regime detector. It stationarizes the price series via Fixed-Window Fractional Differentiation (FFD), runs a classical CUSUM change-point test on the stationarized stream, and draws a baseline that snaps to a new price level on every confirmed regime shift. Around the baseline, three percentile envelopes (50%, 68%, 90%) are drawn and modulated by a windowed Shannon entropy estimator so the bands narrow in low-noise regimes and widen in high-noise regimes.
What makes it different
Most regime filters hard-code a differentiation order (typically the first difference). FFD takes a real-valued differentiation order d between 0 and 1, retaining long-memory while making the series statistically stationary. This script chooses d adaptively from a rolling Hurst estimate so it responds to the market's persistence regime instead of being a fixed magic number.
The CUSUM trigger is fed by FFD-stationarized values, not raw returns. This reduces baseline whipsaws in trending markets that violate stationarity assumptions of classical CUSUM.
The bands are entropy-weighted. When the local windowed Shannon entropy is high (low signal-to-noise) the bands expand. When entropy is low (clean regime) they contract. The bands lock at the moment of a confirmed regime shift so they describe the regime under which the baseline was established.
How it works
A two-point Hurst estimator (rescaled-range over short and long windows) drives an adaptive differentiation order d in the range 0.30 to 0.90.
FFD weights are recomputed only when d drifts by more than 0.05 from its cached value. Caching keeps per-bar work near zero.
FFD weights are applied to a sliding window of close prices to produce a stationarized series.
Classical CUSUM tracks cumulative positive and negative deviations of the stationarized series from a running baseline reference, with user-configurable drift and threshold parameters.
When CUSUM exceeds the threshold, the baseline snaps to the current close and the trend state is set to bull or bear.
Inner, mid, and outer envelopes are drawn from percentile_linear_interpolation of the absolute distance between close and baseline, multiplied by an entropy modulator.
A bull probability is computed from the Abramowitz and Stegun standard-normal CDF on the signed band-distance and surfaced as a numeric label.
Reading the chart
Baseline line tinted purple in bull regimes, cyan in bear regimes, muted in neutral.
Six percentile band lines (upper and lower inner, mid, outer) with three pairs of atmospheric gradient fills calibrated so candles remain readable through every layer.
Optional iridescent candle recolor scales tint by signed regime score.
A probability label at the right edge of the chart shows the live bull probability.
Seven right-edge price labels, one per envelope level plus baseline, each sit at their own price.
Regime-shift timeline labels record every confirmed regime change with its baseline price and bull probability at the time of the shift.
A 21-segment vertical strength gauge at the right edge maps the continuous regime strength score onto a bull / bear / neutral scale, with a dashed sight-line drawing the gauge level back into the chart.
A short forward probability cone: two dashed segments at outer band levels with opacity scaled by class probability.
Signals
Bull / bear regime entry (CUSUM trigger with direction)
Outer band touch
Outer band rejection (wick pierces the outer band but the body closes back inside)
Baseline reclaim (close re-crosses the baseline)
All gated on barstate.isconfirmed or barstate.ishistory. No future references. No lookahead_on.
Inputs
Fractional Differentiation : FFD window length.
CUSUM : volatility period, drift parameter, threshold parameter.
Regime : Hurst short / long lookbacks, entropy window / bins / z-score length.
Bands : percentile lookback.
Visual : bullish, bearish, quantum purple, quantum cyan colors. Band visibility toggles. Iridescent candles. Regime pulse. Probability label.
Labels : right-edge level labels, regime timeline (offset off candle wicks by ATR), baseline reclaim markers (direction-sensitive Y offset, configurable minimum-bar spacing), band touch and rejection labels (configurable minimum-bar spacing per type), strength gauge, sight-line needle, probability cone, FFD memory label, entropy state strip.
Dashboard : position, size.
How traders use this
Mean-reversion fades from outer-band touches inside a stable regime (Hurst mean-reverting, low entropy z) are statistically supported setups.
Regime-shift entries : when the baseline snaps and the trend turns, the first inner-band retest is a higher-quality continuation entry than chasing the breakout bar.
Probability filter : use the bull probability label as a confidence multiplier for other systems. Below 30% or above 70% are the actionable zones.
Entropy context : high entropy z (band-multiplier expanded) is a low conviction, wider stops warning. Low entropy z (bands tight) is a high conviction, tighter stops green light.
Limitations
Fractional differentiation is a smoothing and filtering tool. It cannot create information that is not already in the price series.
CUSUM, like any change-point detector, lags real-time tops and bottoms. It is calibrated to balance whipsaw against responsiveness.
The two-point Hurst estimator is a fast approximation. For long-horizon classification it agrees with the full R/S statistic. For very short windows it is noisier.
Past regime persistence does not guarantee future regime persistence.
Compatibility
Pine Script v6 open-source indicator. Any symbol, any timeframe (longer timeframes give the FFD window more meaningful history). No external request.security calls. Non-repainting: regime shifts are committed on confirmed bars and baseline values are not retroactively rewritten.
Defaults
Mint and red bullish / bearish defaults. Purple and cyan quantum accents. Top-right medium dashboard. All on-chart visualizations on. Increase the FFD window for very high timeframes (daily and above) and decrease the percentile lookback for fast intraday charts.
Credits
Fractional differentiation methodology popularized by López de Prado, Advances in Financial Machine Learning (2018).
CUSUM change-point test as published by E. S. Page, Biometrika (1954).
Standard-normal CDF approximation per Abramowitz and Stegun (1964).
อินดิเคเตอร์

Yesterday Based High/Low strong setup bosstvs tikole s.p. pune
### **Indicator Overview**
This indicator is designed specifically for intraday traders (especially for the Indian/NSE market). It automatically plots Yesterday’s key levels and marks the High and Low of specific afternoon time ranges (2:25 to 2:35 PM) to help you find breakout or breakdown trades.
#### **1. Yesterday’s Key Levels (Yellow, Red, Blue Circles)**
These levels are calculated from the previous day's High, Low, and 50% midpoint. They act as major support and resistance for the current day.
* **Yellow Line (Yesterday 50%):** This is the midpoint of yesterday's High and Low. It is a strong psychological level. If the price is above this line, the market sentiment is generally bullish; if below, it's bearish.
* **Red Line (Yesterday High):** The highest point reached yesterday. If the price breaks above this line today, it signals a strong breakout.
* **Blue Line (Yesterday Low):** The lowest point reached yesterday. If the price breaks below this line today, it signals a strong breakdown.
#### **2. Time-Based High/Low Markers (2:25 PM to 2:35 PM)**
The afternoon session (around 2:30 PM) often creates a strong momentum move or a range before the market closes. This indicator captures the exact High and Low of these specific time ranges.
* **Orange Line (2:30 H):** This line represents the **Highest Price** between **14:25 and 14:30**. If the price breaks above this orange line after 2:30 PM, you can take a Buy (Long) trade.
* **Red Line (2:35 H):** This line represents the **Highest Price** between **14:30 and 14:35**. Another breakout level for Buy trades.
* **Green/Lime Line (2:35 L):** This line represents the **Lowest Price** between **14:30 and 14:35**. If the price breaks below this green line after 2:35 PM, you can take a Sell (Short) trade.
*Note: The price values (e.g., 44250.50) are displayed as labels on the left side of the lines so you know the exact level to watch.*
#### **3. "No History" Clean Chart Feature**
To keep your chart clean, the 2:30 and 2:35 lines are **only drawn for the current day**. When you scroll back to previous days, you will *not* see those old lines cluttering the chart. However, Yesterday's High, Low, and 50% lines will naturally remain visible in history.
---
### **How to Trade Using This Indicator (Example Strategy)**
1. **Pre-Market / Morning:** Watch how the price reacts to the **Yellow (50%)** line. Use it as a trend filter.
2. **Afternoon (2:25 PM - 2:35 PM):** Wait for the time ranges to finish. Do not trade during the 10 minutes while the lines are being formed.
3. **The Breakout Trade:**
* After 2:35 PM, if the price crosses **above** the Orange (2:30 H) or Red (2:35 H) lines with a strong candle, **Buy**. Keep your Stop Loss slightly below the Green (2:35 L) line.
* After 2:35 PM, if the price crosses **below** the Green (2:35 L) line with a strong candle, **Sell**. Keep your Stop Loss slightly above the Red (2:35 H) line.
4. **Confluence:** The best trades happen when the 2:30/2:35 breakout lines align with Yesterday's High or Low (Red/Blue circles).
---
### **Important Note on Timeframes**
This indicator is coded to work accurately on **1-minute, 3-minute, and 5-minute** charts. It automatically adjusts its internal calculation based on which of these three timeframes you are currently viewing. For best results, use a 3-minute or 5-minute chart. อินดิเคเตอร์

อินดิเคเตอร์

Position Architect [JOAT]Position Architect
Position Architect is an auto-triggered trade-plan visualizer. It consumes a signal source (any plot of another indicator, or a fallback SMA-cross), arms a trade with ATR-scaled stop loss and three risk-reward-scaled targets, and tracks the trade live with breakeven slide, R-multiple lines, MFE / MAE tracking, multi-currency PnL, position sizing, required margin, Kelly sizing suggestion, and a trade-history strip.
What makes it different
Most trade-planner indicators are manual: the user clicks entry, stop, and target. Position Architect is auto-triggered via input.source, so it plans trades from external signal feeds (other JOAT indicators or any compatible script).
Four trigger modes: Manual toggle, Source-above-SMA, Source-cross-above-SMA, Source-cross-below-SMA. These cover bias, breakout, and counter-trend logics.
A three-target ladder (not just one or two) with intermediate R-multiple lines (0.5R, 1R, 1.5R, 2R, 2.5R, 3R) drawn between entry and Target 3 so you see partial-take levels at a glance.
Live R-multiple, MFE, MAE displayed next to the trade in real time. After the trade closes, those values are baked into a persistent history label.
Kelly sizing suggestion based on an assumed win rate and the current risk-reward, capped at 25% to avoid pathological recommendations.
How it works
The signal source is the user-selected input.source. The trigger rule (one of four modes) determines when a long or short is armed.
On arm: entry equals the current close. SL equals low minus ATR(14) times slMult for longs (or symmetric for shorts). Three targets at entry plus or minus risk times tp1Mult / tp2Mult / tp3Mult.
Lifecycle gates on bar_index greater than tradeBar so the arm bar itself cannot also register hits (preventing spurious instant fills).
Each subsequent bar: check for TP1, TP2, TP3 hits in order, plus stop-loss. TP3 takes precedence over SL on same-bar pierces. If TP1 hits and breakeven is enabled, the stop slides to entry.
Position sizing: pos_size equals (capital times riskPct / 100) divided by (sl_pct / 100). Required margin equals pos_size divided by leverage.
Kelly suggestion: f-star equals winRate minus (1 minus winRate) divided by RR, clamped to 25% max.
Reading the chart
Five horizontal price lines: entry (blue), SL (red), TP1 / TP2 / TP3 (green shades), each width 3 to 5.
Five price-only labels at the right edge with R-multiples and percentages.
Two linefills: a translucent red risk zone between entry and SL, a translucent green reward zone between entry and TP3.
bgcolor tint while a trade is open.
A 1-bar bgcolor pulse on TP / SL / breakeven events.
A live R+0.8 MFE+1.5 MAE-0.3 label updating each bar near current price.
Bars-in-trade counter near the entry.
Trade-history strip above past entries with W/L outcomes and R-multiples.
R-multiple intermediate lines with right-edge labels.
A daily trade count plus win-rate summary.
A comprehensive dashboard with capital, risk, leverage, R:R, Kelly, position size, required margin, direction, entry, current price, live PnL, status (OPEN / WIN / LOSS), bars in trade.
Signals
Trade activated long / short
Target 1 / 2 / 3 hit
Stop loss hit
Breakeven slid
All gated on barstate.isconfirmed or barstate.ishistory. No future references.
Inputs
Signal : signal source, trigger mode, signal SMA length, manual long / short toggles.
Targets : SL ATR multiplier, TP1 / TP2 / TP3 risk multipliers, breakeven toggle, line extension bars.
Capital : capital amount, risk percent, leverage, currency code.
Kelly : assumed win rate.
Visual : bullish / bearish colors, entry line color, SL line color, TP line color, R-multiple lines toggle, history strip toggle.
Dashboard : position, size.
How traders use this
Discretionary planning : switch to Manual mode and toggle manualLong / manualShort to drop a complete plan at the current price, with ATR-aware stops and risk-aware sizing.
Signal integration : connect Position Architect's signal source to another JOAT indicator's plot output (for example the composite of Iridescent Helix or the Stage-3 line of Sentinel Cascade) and let it auto-arm trades.
Risk audit : the dashboard's R:R, position size, required margin, and Kelly suggestion are an instant pre-trade audit. You can compare across instruments.
Performance review : the trade-history strip lets you scroll back through recent trades on the chart and see R-multiples without needing a separate journal.
Limitations
Kelly sizing assumes a stable win-rate-and-R distribution. Real performance varies. The suggestion is a calibration reference, not a recommendation.
Position sizing is in price units. For futures or forex contracts the user must convert to contract count manually.
The signal source must be a series compatible with input.source. If the connected indicator does not expose a useful plot, the trigger logic falls back to close.
Trade lifecycle assumes one open position at a time. No pyramiding inside this script.
Compatibility
Pine Script v6 open-source indicator (overlay). Any symbol, any timeframe. ASCII currency codes (no Unicode glyphs) for cross-platform display. No request.security calls.
Defaults
SL ATR multiplier 1.5, targets at 1R / 2R / 3.5R, breakeven on after TP1, mint / red palette, ten-thousand-dollar capital with one percent risk and one times leverage, top-right medium dashboard.
อินดิเคเตอร์

Adaptive Regime Detector [4-State] [TSL]════════════════════════════════════════════════════════════
SCRIPT TITLE (the "Title" field when publishing):
Adaptive Market Regime Detector
SUGGESTED TAGS:
regime, trend, volatility, ATR, marketregime, futures,
efficiencyratio, choppiness, adaptive, context
════════════════════════════════════════════════════════════
DESCRIPTION (paste into the description box):
────────────────────────────────────────────────────────────
Most regime filters answer the wrong question. They tell you a single number — "ADX is 27" — and leave you to guess what that means for the symbol and timeframe in front of you. That threshold was calibrated on one market. Load it somewhere else and it quietly misfires, because volatility and trend distributions are not the same on NQ 1-minute as they are on BTC 4-hour.
This indicator takes a different approach. It does not use a single hard-coded threshold anywhere. Instead, every metric is ranked against its own recent distribution using percentile scoring, so the boundary between "trending" and "ranging" recalibrates to whatever chart you put it on. The same script adapts across symbols and timeframes without manual retuning.
── WHAT IT DOES ──
On each confirmed bar, the script measures two independent axes:
Trend axis — Kaufman Efficiency Ratio (directional travel divided by total path) combined with an ATR-normalized EMA slope. High when price is making clean directional progress, low when it is grinding sideways.
Volatility axis — the percentile rank of ATR combined with the percentile rank of Bollinger Band width. High when ranges are expanding, low when the market is compressed.
Crossing those two axes produces four regimes rather than the usual three:
• TRENDING + VOLATILE — direction and range together. The momentum environment.
• TRENDING + CALM — orderly directional grind, muted volatility.
• VOLATILE CHOP — wide two-sided candles going nowhere.
• QUIET RANGE — low volatility, no direction.
The distinction between a volatile trend and a volatile range is the reason this exists. Most detectors collapse both into one "high volatility" state, but they are opposite trading environments. Splitting them apart is the practically useful part.
── HOW TO READ IT ──
Background shading colors the chart by the active regime. A compact dashboard in the corner shows the live trend score, volatility score, direction, a confidence reading (how decisively the dominant axis clears its threshold), and a one-line note for the current state.
── ANTI-FLICKER ──
A regime only changes after a configurable number of consecutive bars agree (default 3). This trades a few bars of lag for a stable label, so the read does not strobe back and forth in transition zones. All logic runs on confirmed bars; the script does not repaint.
── SETTINGS ──
Percentile lookback — the window each metric is ranked against. Lower it toward 80–100 on the 1-minute, keep it near 120 on the 5-minute and above.
Trend / Volatility percentile thresholds — how far above its own distribution a score must sit to count as trending or volatile. Defaults 60 / 65.
Confirmation bars — agreeing bars required before the label flips. Higher is steadier and slower.
Display — background shading, dashboard, dashboard position, background transparency.
Alerts — fires once per bar close on a confirmed regime change, with the new regime and confidence in the message.
Defaults are tuned for index futures (NQ, ES, MNQ, MES) on intraday charts, but because the engine is adaptive it works on forex, crypto, and stocks without retuning.
── HOW TO USE IT ──
This is a context filter, not a signal generator. It tells you which kind of market you are in so you can apply the tactic that fits — momentum in a volatile trend, pullback entries in a calm trend, mean reversion or standing aside in chop, reduced size in a quiet range. Pair it with your own entry trigger and risk plan. The regime read tells you which tool to reach for, not where to click.
── LIMITATIONS ──
It classifies context; it does not predict direction or generate entries. Transitions are inherently fuzzy and the confirmation buffer means the label arrives a few bars after a regime genuinely shifts — that is deliberate. On a freshly loaded chart with little history, the percentile scores can be jumpy until enough bars accumulate to form a stable distribution.
Open source. The full Pine v6 source is on this page — read it, fork it, adapt it to your own strategy.
This script is an analytical tool published for educational purposes. It does not constitute financial advice and does not guarantee any trading outcome. Trading involves substantial risk of loss. อินดิเคเตอร์

อินดิเคเตอร์

Auto Range / Lateral Consolidation Box DetectorAuto Range / Lateral Consolidation Box Detector
Overview
The Auto Range / Lateral Consolidation Box Detector is designed to automatically identify and draw price ranges where a stock is moving sideways after a prior advance.
Instead of manually drawing rectangle boxes around consolidation areas, this indicator detects them objectively using price containment, range width, prior trend movement, ADR, moving-average structure, and optional volume/RSI filters.
The purpose is to help traders identify:
lateral consolidations
tight launch shelves
continuation bases
range breakouts
failed ranges
breakout/retest zones
early momentum continuation structures
This tool is especially useful for traders who look for stocks that have already shown strength, pause in a controlled range, and then attempt to continue higher.
Core Concept
Many strong momentum moves do not happen randomly. They often follow a repeatable structure:
Prior advance → sideways range → breakout → continuation
This indicator attempts to locate that sideways range automatically.
The blue dashed boxes show detected consolidation zones. When price breaks above a completed range, the indicator can mark the breakout and preserve the prior box so the trader can review the structure historically.
The goal is not to predict breakouts blindly. The goal is to make range structure easier to detect, measure, and trade with defined risk.
What the Indicator Detects
The indicator identifies two main types of structures:
1. Standard Rectangle Range
This is a broader lateral consolidation that usually forms over a larger number of candles.
It is useful for detecting:
multi-week consolidations
continuation bases
sideways digestion after an advance
breakout/retest setups
controlled pullbacks above moving averages
A standard rectangle is best used when price has already advanced and then begins moving sideways in a defined box.
2. Tight Launch Shelf
This is a shorter, tighter range that often forms just before a momentum expansion.
It is useful for detecting:
short pauses near highs
high-tight continuation shelves
pre-breakout compression
momentum names that do not build long bases
stocks that pause briefly before expanding again
This feature was added because some of the strongest stocks do not consolidate for weeks. They may only pause for several sessions before breaking out.
How the Boxes Work
The indicator measures the range using completed prior candles only.
This is important because the breakout candle itself should not distort the range.
For example, if a stock breaks out above a tight rectangle, the breakout candle may be much larger than the range. If the script included that candle in the box calculation, it would make the range look wider than it actually was.
This script avoids that issue by asking:
“Before the current breakout candle, was there a valid sideways range?”
That allows the indicator to draw the actual consolidation area more accurately.
Visual Guide
Visual ElementMeaningBlue dashed boxDetected standard rectangle rangePurple dashed boxDetected tight launch shelfUpper box lineRange resistance / breakout levelLower box lineRange support / invalidation referenceMidlineInternal range midpointBO markerBreakout above range with volumeBO? markerPrice breakout without volume confirmationFAIL markerBreakdown below rangeScore labelShows range quality, width, ADR, prior move, and containment
How I Use It in My Strategy
This indicator fits into a continuation-style trading strategy built around strength, structure, and timing.
The process is:
1. Find a stock with prior strength
I want to see that the stock has already proven demand.
That may include:
strong prior advance
relative strength versus the market
rising moving averages
reclaim or hold above the 200 SMA
improving volume profile
strong sector or theme participation
recent earnings, catalyst, or institutional attention
The indicator is not used to find random sideways stocks. It is used to find sideways ranges after strength has already appeared.
2. Let the stock build a range
Once a stock has moved, I want to see whether it can hold gains.
A clean range tells me:
buyers are defending higher prices
sellers are not fully taking control
price is digesting instead of collapsing
moving averages may be catching up
risk can be defined around the box
This is where the auto box becomes useful.
Instead of manually drawing every range, the indicator highlights areas where price is compressing or consolidating.
3. Use the box for trade planning
The box gives me three major trade locations:
Trade LocationUse CaseRange lowSupport-defense entryRange highBreakout triggerBreakout retestPreferred continuation entry
I generally do not want to enter randomly in the middle of the box unless I have another strong reason.
The best trades usually come from:
range-low defense,
breakout through range high,
or breakout followed by a retest that holds.
4. Confirm with other tools
This indicator identifies structure, but it is not a standalone buy signal.
Before taking a trade, I still want confirmation from:
relative strength
catalyst/news/earnings context
sector/theme strength
ADR/movement potential
volume expansion
VWAP/AVWAP location
volume profile levels
option-chain liquidity if using options
broader market regime
The box tells me where the trade may be forming.
The rest of the process tells me whether it deserves capital.
How Other Traders Can Use It
This indicator can be adapted to several trading styles.
Momentum Traders
Momentum traders can use it to identify stocks that are pausing after a strong move and preparing for another push.
Best use:
breakout above range high
breakout with volume
tight launch shelf breakouts
high-relative-volume names
strong sector/theme participation
Swing Traders
Swing traders can use it to locate multi-day or multi-week continuation bases.
Best use:
buy breakout/retest
enter near range support with defined risk
use the box low as invalidation
use the box height for measured-move targets
combine with daily/weekly trend structure
Breakout Traders
Breakout traders can use the box high as an objective breakout level.
Best use:
price closes above the range high
volume expands above average
range is not too wide
stock is above key moving averages
market regime supports continuation
Mean-Reversion Traders
Mean-reversion traders can use the range boundaries in the opposite way.
Best use:
fade weak breakouts back into the range
buy range low if buyers defend
sell/avoid failed range highs
use the midpoint as a decision level
Position Traders
Position traders can use detected boxes as add zones during a larger trend.
Best use:
add after a valid base forms above rising moving averages
trail risk below higher base lows
identify where trend continuation is being accepted
avoid adding after emotional vertical moves without digestion
Input Settings Explained
Standard Rectangle Bars
Controls how many prior candles are used to detect a normal consolidation box.
Higher values detect longer bases.
Lower values detect shorter ranges.
Suggested use:
StyleSettingFast momentum8–12Swing trading12–20Longer bases20–40
Tight Launch Shelf Bars
Controls how many prior candles are used to detect short, tight shelves near highs.
This is designed for stocks that pause briefly before breaking out.
Suggested use:
StyleSettingVery fast momentum4–6Normal launch shelf6–10Slower swing shelf10–15
Prior Move Lookback Bars
Determines how far back the script looks to measure whether the stock had a prior advance before the range.
Higher values allow the script to detect bases after larger, older moves.
Suggested use:
StyleSettingShort-term momentum20–35Swing continuation35–60Longer trend bases60–100
Minimum Prior Advance %
Defines how much price must have advanced before the range qualifies.
This helps prevent the script from highlighting random sideways chop.
Suggested use:
Market TypeSettingLarge caps8%–15%Mid caps15%–25%Small caps / high ADR20%–40%
A higher setting makes the script more selective.
Minimum Close Containment %
Controls how many closes must remain inside the box.
A higher value requires cleaner sideways behavior.
Suggested use:
Range QualitySettingLoose ranges60%–70%Normal ranges70%–80%Very tight clean bases80%–90%
Max Standard Range Width x ADR
Controls how wide a normal range can be compared with the stock’s average daily range.
Lower values require tighter bases.
Higher values allow wider, looser consolidations.
Suggested use:
PreferenceSettingTight clean bases only1.5–2.25Balanced2.5–3.0Loose momentum names3.0–4.0
Max Tight Shelf Width x ADR
Controls how wide a tight launch shelf can be.
Because launch shelves should be tighter than standard ranges, this number is usually lower.
Suggested use:
PreferenceSettingVery tight shelves1.0–1.3Balanced1.4–1.8Volatile small caps1.8–2.5
ADR Length
Controls the lookback period for average daily range.
Default is 20, which approximates one trading month.
Suggested use:
PurposeSettingShort-term sensitivity10Standard20Smoother ADR30–50
Volume Average Length
Controls the average volume lookback used for breakout and volume comparison.
Suggested use:
StyleSettingFast momentum10Standard swing20Smoother volume filter30–50
Max Range Volume vs Avg
This controls how much volume is allowed during the range if the volume filter is enabled.
Lower values require quieter consolidation.
Higher values allow more active ranges.
Suggested use:
Range TypeSettingQuiet base0.8–1.0Normal base1.0–1.25Active momentum range1.25–1.75
RSI Settings
RSI filters can be used to avoid ranges that are either too weak or too extended.
Suggested use:
PurposeSettingAvoid weak rangesMinimum RSI 40Allow momentum leadersMaximum RSI 80–85Stricter resetMax RSI 70–75
For strong momentum stocks, I prefer leaving RSI control flexible because strong names can remain elevated before breaking out.
Require Price Above 200 SMA
When enabled, the script only accepts ranges where price is above the 200 SMA.
This is useful for trend-following and continuation strategies.
Turn this off if you want to scan:
bottoming structures
early reversals
200 SMA reclaim attempts
accumulation ranges below the 200 SMA
Require Prior Advance
When enabled, the script requires price to have moved up before forming the range.
This is best for continuation traders.
Turn this off if you want to study:
accumulation bases
bottoming ranges
reversal setups
sideways structures before a first move
Require Volume Control
When enabled, the range must have controlled volume relative to average volume.
This helps filter out chaotic ranges.
However, for volatile small caps or active momentum names, I often leave this off because strong stocks can consolidate with active volume.
Require RSI Control
When enabled, RSI must remain within the selected range.
This can help avoid weak or overextended setups.
However, momentum leaders can remain strong for longer than expected, so this setting is optional depending on the strategy.
Setup Score
The label displays an Auto Range Score out of 10.
The score considers:
prior move
price above 200 SMA
containment inside the range
range width versus ADR
volume behavior
OBV behavior
RSI condition
ADR level
The score is not a buy signal. It is a structure-quality score.
General interpretation:
ScoreInterpretation9–10Very clean structure7–8Good watchlist candidate5–6Needs more confirmationBelow 5Low-quality or incomplete structure
Trading Notes
A detected box is only a location tool.
It does not replace:
market regime analysis
risk management
catalyst research
relative strength checks
liquidity checks
options-chain review
trade planning
The highest-quality setups usually combine:
strong prior move + clean box + range containment + volume expansion on breakout + supportive market conditions.
Risk Management
The box can help define risk.
Common invalidation methods:
stop below range low
stop below breakout candle low
stop below retest low
stop below rising 20 EMA or 50 SMA
exit if breakout fails back into range
avoid if price breaks below the box with volume
The cleanest setups are usually those where the box gives a tight, logical invalidation level.
Important Disclaimer
This indicator is for educational and research purposes only.
It does not provide financial advice, investment advice, or guaranteed trade signals. All trading involves risk. Traders should use their own research, risk management, and judgment before entering any position. อินดิเคเตอร์

อินดิเคเตอร์

NAJI EL HAJJ HASSAN ntraday Regime Index (NIRI) The Naji INaji Intraday Regime Index (NIRI)
The Naji Intraday Regime Index (NIRI) is an adaptive market activity and volatility regime indicator designed to identify whether the current trading session is behaving in compression, balance, expansion, or momentum conditions relative to its historical intraday behavior.
Unlike traditional volatility indicators such as ATR, NIRI compares the current session’s cumulative intraday movement against the average movement of the same exact time window across a user-defined historical sample.
The indicator measures the market’s real intraday activity using cumulative absolute price movement:
∑
∣
c
l
o
s
e
−
c
l
o
s
e
∣
∑∣close−close ∣
This approach captures actual market participation and directional activity more effectively than simple net price change, allowing traders to detect:
ranging environments,
volatility compression,
session expansion,
abnormal momentum conditions,
and statistically quiet or active trading periods.
NIRI dynamically compares:
the current day’s movement from a selected starting time (market open or custom time),
to a selected ending time (current time or custom time),
against the same intraday window over a configurable number of previous trading sessions.
The output is expressed as a relative activity percentage:
C
u
r
r
e
n
t
M
o
v
e
m
e
n
t
H
i
s
t
o
r
i
c
a
l
A
v
e
r
a
g
e
×
100
Historical Average
Current Movement
×100
Interpretation example:
Below 70% → Compression / low activity / ranging conditions
70%–100% → Normal session behavior
Above 100% → Expansion relative to historical norms
Above 130% → Strong momentum or abnormal volatility
The indicator is designed as a market regime filter rather than a directional signal generator. It helps traders adapt strategy selection based on current session conditions:
trend-following during expansion,
mean reversion during compression,
and risk reduction during abnormal volatility.
Key Features:
Adaptive intraday volatility comparison
Same-time historical session analysis
Automatic or manual session timing
User-defined lookback period
Relative movement normalization
Ranging and expansion regime detection
Instrument-independent behavior modeling
NIRI is especially effective for:
index futures,
forex,
crypto,
commodities,
and highly session-dependent markets where volatility behavior changes significantly throughout the trading day.
Created by Naji. อินดิเคเตอร์

Trend Pulse Channel StrategyTrend Pulse Channel Strategy
Trend Pulse Channel Strategy is an educational trend-following strategy designed to study breakout entries above an adaptive multi-pole price channel.
The strategy builds a smoothed trend filter from the selected source price and then creates an upper and lower channel using a filtered true-range calculation. The goal is to study whether price breaking above the upper channel can represent bullish trend expansion, and whether price falling back below the upper channel can be used as an exit condition.
This script is a strategy for research, backtesting, and forward-testing only. It is not financial advice, does not predict future price movement, and does not guarantee profitable results. Historical strategy results are hypothetical and can differ from live trading because of slippage, commissions, liquidity, spread, execution quality, timeframe selection, and market regime changes.
Core concept
The strategy is built around a smoothed adaptive channel.
The center line is a filtered version of the selected source price. The upper and lower bands are calculated by adding and subtracting a filtered true-range value multiplied by the selected range multiplier.
The channel is intended to provide a dynamic trend structure:
* The center filter represents the main smoothed trend path.
* The upper band represents upside expansion beyond the filtered trend.
* The lower band represents downside expansion below the filtered trend.
* The channel fill helps visualize the active trend zone.
Strategy logic
The strategy is long-only.
A long entry occurs when price closes above the upper channel band during the selected date range.
A long exit occurs when price closes back below the upper channel band during the selected date range.
The strategy does not open short positions.
The logic is intentionally simple so that users can evaluate how channel breakouts behave across different symbols, timeframes, and market conditions.
Main components
1. Adaptive multi-pole filter
The script uses a multi-pole smoothing structure to calculate the main trend filter.
The Poles input controls how many smoothing stages are applied. A higher number of poles generally produces a smoother filter, while a lower value reacts faster.
2. Period
The Period input controls the main smoothing length used by the filter calculation.
A shorter period makes the channel more responsive but may increase noise and false breakouts. A longer period makes the channel smoother but may react more slowly to trend changes.
3. Range multiplier
The Range Multiplier controls the distance between the center filter and the upper/lower bands.
A larger multiplier creates a wider channel and usually fewer breakout entries. A smaller multiplier creates a tighter channel and usually more frequent signals.
4. Reduced Lag mode
Reduced Lag mode attempts to make the source and true-range inputs more responsive by applying a lag-reduction adjustment before filtering.
This can make the channel react faster, but it may also increase sensitivity and noise.
5. Fast Response mode
Fast Response mode blends the multi-pole filter with a faster single-pole version.
This is designed to make the channel respond more quickly to price movement, but it may also increase whipsaws in sideways markets.
Visual elements
The script plots:
* The main trend filter.
* The upper channel band.
* The lower channel band.
* A filled channel area.
* Colored bars based on price behavior relative to the filter and bands.
* A strategy equity line in the data window / chart display.
The filter and channel color change according to the filter slope:
* Green tones indicate a rising filter.
* Red tones indicate a falling filter.
* Gray indicates a flat or neutral condition.
Bar coloring
The script colors bars according to price behavior relative to the filter and channel:
* Strong bullish bars appear when price advances above the filter or upper band.
* Weaker bullish bars appear when price remains above the filter but shows less upside pressure.
* Bearish bars appear when price falls below the filter or lower band.
* Neutral bars appear when conditions are mixed.
These colors are visual aids only. They are not separate trade signals by themselves.
Default strategy properties
The script uses the following default strategy properties:
* Initial capital: 10,000
* Position sizing: percent of equity
* Default order size: 10% of equity
* Commission: 0.1%
* Slippage: 1 tick
* Fill orders on standard OHLC: enabled
* Long-only execution
These settings are included for backtesting convenience. Users should adjust commission, slippage, order size, and test range to match the market and broker conditions they are trying to model.
Backtesting note
TradingView strategy results are simulations based on historical bar data. They are not live trading results.
Results can change significantly depending on:
* Symbol.
* Timeframe.
* Date range.
* Liquidity.
* Spread.
* Commission.
* Slippage.
* Source price.
* Number of poles.
* Filter period.
* Range multiplier.
* Reduced Lag mode.
* Fast Response mode.
* Market trend strength.
* Sideways or choppy conditions.
Users should test the strategy across a sufficiently large sample of trades and across different market regimes before drawing conclusions.
How to use it
A practical workflow is:
1. Select the symbol and timeframe to test.
2. Use a realistic date range that includes trending and sideways market conditions.
3. Review the number of trades before evaluating performance.
4. Adjust commission and slippage to match the market being tested.
5. Test the default settings first.
6. Compare results with Reduced Lag mode on and off.
7. Compare results with Fast Response mode on and off.
8. Adjust the Range Multiplier to control channel sensitivity.
9. Forward-test before considering any real-world use.
Inputs
Date Range
* Start Date: first date included in the backtest.
* End Date: last date included in the backtest.
Source
* Source: price input used by the filter. The default is HLC3.
Channel Settings
* Poles: number of smoothing stages used in the filter.
* Period: main smoothing period.
* Range Multiplier: controls the distance of the upper and lower channel bands.
Response Modes
* Reduced Lag: applies a lag-reduction adjustment before filtering.
* Fast Response: blends the multi-pole filter with a faster single-pole version.
Limitations
This strategy is long-only and does not evaluate short trades.
The strategy does not use a fixed stop-loss, fixed take-profit, trailing stop, or volatility-based exit. Exits are based on price crossing back below the upper channel band.
Channel breakout systems can perform poorly in sideways, choppy, or low-volatility markets.
A close above the upper band does not guarantee trend continuation.
A close below the upper band does not guarantee that the trend has ended.
The adaptive filter is based on historical price and true range, so it is lagging by nature.
Changing the period, poles, multiplier, lag mode, or fast mode can materially change backtest results.
Recommended use
Trend Pulse Channel Strategy is best used as an educational framework for studying adaptive channel breakouts and trend-following behavior.
It should be used with realistic backtesting assumptions, conservative position sizing, and independent validation before any trading decision.
กลยุทธ์

Squeeze Memory Cone [forexobroker]Squeeze Memory Cone detects a volatility squeeze when the Bollinger Bands sit fully inside the Keltner Channel, then projects a forward "memory cone" from the squeeze-release bar. The unique angle is that the cone half-width grows with the square root of bars elapsed since release, mirroring the typical post-squeeze expansion envelope, and that envelope plus the release direction frames every entry.
🔶 ALGORITHM
1. Build Bollinger Bands (SMA basis +/- stdev x BB mult) and a Keltner Channel (same basis +/- ATR-style range x KC mult) on the shared length.
2. Squeeze is ON when the upper BB is below the upper KC AND the lower BB is above the lower KC (volatility compression).
3. Release = squeeze was on last bar and is off this bar. On release, the linreg of detrended price (close minus its SMA) gives the expansion direction, which sets the bias; the release close anchors the cone base.
4. Project the memory cone forward: half-width = Cone Width x ATR x sqrt(bars since release), bounded by Cone Life bars. The cone is a sqrt-time expansion envelope, not a forecast line.
5. Entry timing: in Release-Only mode the signal is the directional release bar itself; otherwise, while the cone is active and bias is set, a close crossover (long) or crossunder (short) of the reclaim EMA times the entry. Cooldown, position-lock, and bar-close confirmation apply. Non-repainting.
🔶 SIGNAL LOGIC
- Buy: in-session AND ((Release-Only: squeeze released with positive momentum) OR (cone active AND bias = +1 AND close crosses over the reclaim EMA)) AND position not already long AND cooldown elapsed AND barstate.isconfirmed (then position locks long).
- Sell: in-session AND ((Release-Only: squeeze released with negative momentum) OR (cone active AND bias = -1 AND close crosses under the reclaim EMA)) AND position not already short AND cooldown elapsed AND barstate.isconfirmed (then position locks short).
- Only fires while the projected memory cone is active (or on the release bar in Release-Only mode).
🔶 INPUTS
- Squeeze group: shared length for Bollinger Bands and Keltner Channel; default BB/KC Length 20.
- BB width: standard-deviation multiplier for the Bollinger Bands; default BB StdDev Mult 2.0.
- KC width: ATR-range multiplier for the Keltner Channel; default KC ATR Mult 1.5.
- Cone life: bars the projected cone stays active after release; default Cone Life 30.
- Cone width: k in the k x ATR x sqrt(bars) half-width; default Cone Width x ATR 1.0.
- Volatility reference: ATR length for cone width and dashboard; default ATR Length 20.
- Signal Logic group: entry reclaim EMA, release-only mode, cooldown; default Entry Reclaim EMA 9.
- Cooldown: minimum bars between signals; default Cooldown Bars 5.
- Filters group: optional session restriction and session window; default Restrict to Session off.
- Visual group: memory cone, dashboard, 3-layer glow, buy/sell colors, dashboard background.
🔶 ALERTS
SMQ Buy, SMQ Sell, SMQ Any Signal, SMQ Squeeze On, SMQ Release, SMQ Release Up, SMQ Release Down, SMQ EMA Up, SMQ EMA Down, SMQ Cone Open, SMQ Cone Expire, SMQ Bias Flip, SMQ Webhook JSON.
🔶 LIMITATIONS
- The squeeze/cone logic needs a full BB/KC length to stabilise, so the first length bars are warm-up.
- The memory cone is a sqrt-time heuristic envelope of expected expansion, not a price forecast or target.
- Release direction is taken from a linreg of detrended price on the release bar and can be marginal when momentum is near zero.
- Default multipliers are tuned for liquid instruments; gappy symbols can trigger or break squeezes abruptly.
- Entries confirm on bar close, so the reclaim-EMA cross is acknowledged with one-bar lag versus intrabar price.
อินดิเคเตอร์
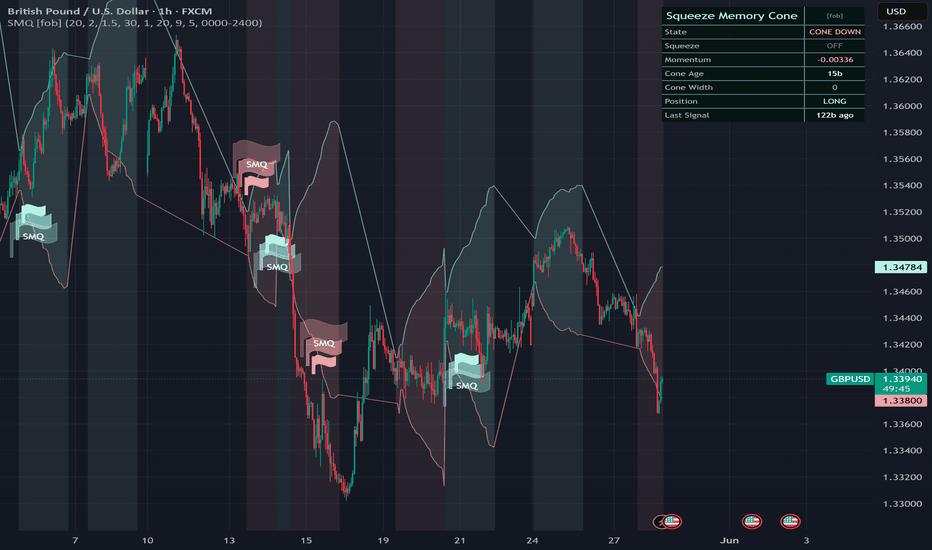
Premium Discount Equilibrium [forexobroker]Premium Discount Equilibrium builds a dealing range from the rolling N-bar high and low and marks its 50% midpoint as equilibrium: above it is premium (expensive, favor shorts), below it is discount (cheap, favor longs). The unique angle is executing the ICT premium/discount model on an EMA reclaim so entries are timed rather than merely biased, with an optional Optimal Trade Entry (OTE) band gate for deeper-discount / higher-premium precision.
🔶 ALGORITHM
1. Build the dealing range from the highest high and lowest low over Dealing Range Length bars.
2. Compute equilibrium as the range midpoint (rngHi + rngLo) / 2, with an EQ Buffer expressed as a fraction of range defining a neutral band where no bias applies.
3. Classify price: in premium when close is above EQ + buffer, in discount when below EQ - buffer.
4. Derive the OTE bands: discount OTE = 21% to 38% off the low, premium OTE = 21% to 38% off the high (the classic 62-79% retrace zone), used for an optional confirmation gate.
5. Entry timing: an EMA reclaim (ta.crossover / ta.crossunder of close vs the Reclaim EMA) inside the correct zone times the trade; long entries require discount, short entries require premium.
6. Optional Require OTE Zone filter restricts signals to bars inside the matching OTE band.
🔶 SIGNAL LOGIC
- Buy: price in discount (close below EQ - buffer) and close crosses over the Reclaim EMA, in session, OTE gate satisfied if enabled, position not already long, after the cooldown window, only on barstate.isconfirmed; position-lock flips to LONG.
- Sell: price in premium (close above EQ + buffer) and close crosses under the Reclaim EMA, in session, OTE gate satisfied if enabled, position not already short, cooldown elapsed, on barstate.isconfirmed; position-lock flips to SHORT.
Only fires when price is on the correct side of equilibrium (discount for longs, premium for shorts).
🔶 INPUTS
- Range: dealing range length for the high/low window (default 60) and ATR length.
- Equilibrium band: EQ buffer as a fraction of range defining the neutral no-bias zone (default 0.05).
- Signal Logic: Reclaim EMA length (default 9).
- OTE: show OTE 62-79 band toggle (default on).
- Cooldown: minimum bars between signals (default 5).
- Filters: optional session restriction and a Require OTE Zone gate (default off).
- Visual: zone plots (EQ, range high/low, OTE fills), dashboard, 3-layer glow, buy/sell colors, dashboard background.
🔶 ALERTS
PDE Buy, PDE Sell, PDE Any Signal, PDE Enter Premium, PDE Enter Discount, PDE Discount OTE, PDE Premium OTE, PDE EQ Cross, PDE EMA Up, PDE EMA Down, PDE Range High, PDE Range Low, PDE Webhook JSON.
🔶 LIMITATIONS
- Requires warm-up: the dealing range needs Dealing Range Length bars before it stabilizes.
- The range high/low recompute every bar, so equilibrium and zones shift as the rolling window moves; signals themselves confirm on bar close and do not repaint.
- Defaults are tuned for liquid instruments; range length and EQ buffer may need adjustment per market.
- Require OTE Zone mode is stricter and produces noticeably fewer signals.
- Premium/discount is a contextual bias, not a guaranteed reversal; ranging-to-trending transitions can keep price extended in one zone.
อินดิเคเตอร์

อินดิเคเตอร์

WAVE TIME ORGAN FORCE🌊 WAVE TIME ORGAN FORCE
WAVE TIME ORGAN FORCE is a multi-timeframe market flow and synchronization engine designed to combine organ-based market pressure analysis, EMA-smoothed visual flow, timeframe force propagation, and cinematic wave-style visualization into one clean and powerful trading system.
The indicator was built with two main goals:
1. To measure how market pressure behaves internally.
2. To visualize how that pressure propagates through multiple timeframe layers.
Instead of functioning as a simple oscillator or signal generator, WAVE TIME ORGAN FORCE focuses on market rhythm, synchronization, pressure quality, and directional propagation.
━━━━━━━━━━━━━━━━━━
THE MAIN PHILOSOPHY
━━━━━━━━━━━━━━━━━━
Most traditional indicators analyze only one dimension of the market.
Examples:
• RSI measures momentum strength.
• MACD measures moving average relationship.
• ATR measures volatility.
• OBV measures volume pressure.
WAVE TIME ORGAN FORCE combines several internal market behaviors into one synchronized system.
The indicator tries to answer questions such as:
Is the current movement supported by volume?
Is volatility supporting expansion?
Are multiple timeframes aligned together?
Is momentum propagating upward through the timeframe stack?
Is the market synchronized or internally conflicted?
Is the current structure smooth or chaotic?
The goal is not only to identify direction, but to understand the internal quality of market movement.
━━━━━━━━━━━━━━━━━━
ORGAN ENGINE
━━━━━━━━━━━━━━━━━━
The internal core is based on the “Organ Engine” concept.
The market is treated like a living structure composed of multiple organs.
The engine currently includes:
Trend Organ
Momentum Organ
Volume Organ
Volatility Organ
Each organ measures a different type of market behavior.
━━━━━━━━━━━━━━━━━━
TREND ORGAN
━━━━━━━━━━━━━━━━━━
The Trend Organ measures directional pressure using EMA slope behavior.
Instead of only checking whether price is above or below a moving average, the system measures how aggressively the trend itself is moving.
This allows the engine to detect acceleration and directional force more naturally.
━━━━━━━━━━━━━━━━━━
MOMENTUM ORGAN
━━━━━━━━━━━━━━━━━━
The Momentum Organ measures the speed and force of price movement using ROC-based calculations.
This helps the system determine whether the market movement is weak, expanding, slowing down, or accelerating.
━━━━━━━━━━━━━━━━━━
VOLUME ORGAN
━━━━━━━━━━━━━━━━━━
The Volume Organ uses OBV-style pressure calculations to determine whether volume supports the current market movement.
A bullish move without volume support is considered weaker than a move supported by synchronized volume behavior.
━━━━━━━━━━━━━━━━━━
VOLATILITY ORGAN
━━━━━━━━━━━━━━━━━━
The Volatility Organ uses ATR-based directional behavior.
This layer helps the system detect:
Expansion
Compression
Directional volatility pressure
The volatility component is important because strong trends usually expand volatility while weak or exhausted movements often compress.
━━━━━━━━━━━━━━━━━━
RAW ORGAN VALUE
━━━━━━━━━━━━━━━━━━
All organ layers are normalized and merged into a single internal value called the Raw Organ.
The Raw Organ represents the true internal market pressure.
This raw value is preserved internally and is not destroyed by visual smoothing.
This is extremely important.
The calculation engine remains mathematically intact while the visualization becomes smoother and easier to read.
━━━━━━━━━━━━━━━━━━
EMA-SMOOTHED ORGAN FLOW
━━━━━━━━━━━━━━━━━━
The visual Organ Flow is created by applying EMA smoothing to the Raw Organ.
This creates a flowing wave appearance instead of a sharp mechanical oscillator.
The smoothing exists for visual clarity and wave behavior representation.
The purpose is not to manipulate signals.
The result is a more natural energy-flow appearance where the market behaves like a living wave system rather than disconnected candles.
━━━━━━━━━━━━━━━━━━
TIMEFRAME FORCE ENGINE
━━━━━━━━━━━━━━━━━━
One of the most important parts of WAVE TIME ORGAN FORCE is the Timeframe Force Engine.
The system reads multiple timeframe layers simultaneously.
Instead of asking:
“Is the market bullish?”
the engine asks:
“Is bullish pressure propagating successfully through multiple timeframes?”
This creates a propagation-based analysis system rather than a simple trend filter.
━━━━━━━━━━━━━━━━━━
TIMEFRAME PROPAGATION
━━━━━━━━━━━━━━━━━━
Lower timeframe movement alone is often unreliable.
The system therefore checks whether momentum and directional pressure are successfully spreading into higher timeframe layers.
This creates a more stable and higher-quality directional environment.
The indicator measures:
Bullish Layer Count
Bearish Layer Count
Timeframe Alignment
Directional Force
Cascade Conditions
━━━━━━━━━━━━━━━━━━
CASCADE STRUCTURE
━━━━━━━━━━━━━━━━━━
A cascade occurs when all timeframe layers align in the same direction.
Bull Cascade:
All timeframe layers are synchronized bullish.
Bear Cascade:
All timeframe layers are synchronized bearish.
Mixed Wave:
The timeframe stack is not fully aligned.
The cascade system is important because strong directional moves often occur when multiple timeframe layers begin moving together.
━━━━━━━━━━━━━━━━━━
QUALITY CROSS ENGINE
━━━━━━━━━━━━━━━━━━
The indicator uses a cross relationship between:
Organ Flow EMA
Signal EMA
A bullish quality condition forms when:
• Organ Flow crosses above the signal line
• Organ Flow is above zero
• Timeframe Force is bullish
• Multiple timeframe layers support the movement
A bearish quality condition forms when:
• Organ Flow crosses below the signal line
• Organ Flow is below zero
• Timeframe Force is bearish
• Multiple timeframe layers support the movement
This creates a cleaner confirmation structure than simple crossover systems.
━━━━━━━━━━━━━━━━━━
WAVE STACK VISUALIZATION
━━━━━━━━━━━━━━━━━━
The indicator visualizes multiple timeframe layers as a stacked wave structure.
Each layer represents a different market rhythm.
Lower timeframe waves react faster.
Higher timeframe waves react slower and represent larger directional force.
The stacked structure creates a living market-flow appearance.
The purpose is to help the user visually understand:
Market rhythm
Directional depth
Synchronization
Pressure propagation
Wave expansion
Flow behavior
━━━━━━━━━━━━━━━━━━
GLOW & AURA SYSTEM
━━━━━━━━━━━━━━━━━━
The indicator uses cinematic glow and aura layers to improve readability and create a premium visual structure.
Glow layers emphasize:
Main Organ Flow
Timeframe Force
Wave Expansion
Cascade Conditions
Aura fills help visualize the relationship between:
Organ Flow
Signal Flow
Timeframe Force
Wave Stack Layers
The goal is to create a visually alive chart environment rather than a static indicator appearance.
━━━━━━━━━━━━━━━━━━
MAIN CHART CANDLE COLORING
━━━━━━━━━━━━━━━━━━
The indicator can color candles directly on the main chart.
This allows the user to visually identify stronger conditions without cluttering the chart with excessive BUY/SELL labels.
Yellow:
Higher-quality bullish condition.
Orange:
Higher-quality bearish condition.
Lime:
Bullish force dominance.
Red:
Bearish force dominance.
Gray:
Mixed or uncertain conditions.
The candle system is designed to communicate market state visually while keeping the chart clean.
━━━━━━━━━━━━━━━━━━
PANEL SYSTEM
━━━━━━━━━━━━━━━━━━
The premium panel acts as a live market cockpit.
It displays:
Current Market State
Organ Flow EMA
Raw Organ Value
Timeframe Force
Bullish Layer Count
Bearish Layer Count
Cross Quality
Signal State
The panel is designed to help the trader understand WHY the current condition exists instead of only displaying random numbers.
━━━━━━━━━━━━━━━━━━
MARKET STATES
━━━━━━━━━━━━━━━━━━
The indicator can display different structural conditions:
Bull Cascade
Bear Cascade
Bull Force
Bear Force
Mixed Wave
This allows the user to read the market as a living structure instead of reducing everything to simple buy and sell labels.
━━━━━━━━━━━━━━━━━━
WHY THIS INDICATOR IS DIFFERENT
━━━━━━━━━━━━━━━━━━
WAVE TIME ORGAN FORCE is not a traditional oscillator.
It combines:
Organ-based market pressure
EMA-smoothed visual flow
Multi-timeframe propagation analysis
Wave-stack visualization
Cascade synchronization
Cinematic glow and aura effects
Candle-state coloring
Premium panel guidance
The purpose is not simply to generate signals.
The purpose is to visualize market behavior, synchronization, and pressure flow.
━━━━━━━━━━━━━━━━━━
IMPORTANT NOTE
━━━━━━━━━━━━━━━━━━
This indicator does not predict the future.
It is a market structure and flow visualization engine.
It should always be used together with:
Risk management
Support and resistance
Volume analysis
Higher timeframe structure
Personal trading strategy
Market context
No indicator should be treated as a guaranteed prediction system.
━━━━━━━━━━━━━━━━━━
SUMMARY
━━━━━━━━━━━━━━━━━━
WAVE TIME ORGAN FORCE is designed to visualize how market pressure behaves and propagates across multiple timeframe layers.
The indicator combines organ-based internal pressure analysis with smooth wave-style visual presentation.
The result is a cinematic market-flow system focused on:
Direction
Force
Synchronization
Timeframe Propagation
Wave Behavior
Cascade Structure
Market Rhythm
Pressure Quality
Visual Clarity
The system is built for traders who want to understand the internal rhythm and synchronization of the market instead of relying only on traditional buy/sell indicators.
อินดิเคเตอร์