EduVest - IFA-VP Context v3.0 [NEON Edition]📊 IFA-VP Context v3.0
A powerful market context indicator combining Volume Profile analysis with SMA trend detection. Designed with a cyberpunk-inspired NEON color palette for maximum visibility on dark charts.
━━━━━━━━━━━━━━━━━━━━━━━━━━━━━━
🎯 WHAT IT DOES
This indicator helps you understand "where you are" in the market by analyzing:
• Volume Profile (POC, VAH, VAL)
• SMA Alignment (20/50/200)
• Context Score (0-100)
━━━━━━━━━━━━━━━━━━━━━━━━━━━━━━
⚡ KEY FEATURES
🔹 NEON Color Palette - Cyan/Pink/Gold colors optimized for dark mode
🔹 Context Score - Visual score bar (████████░░) shows market strength
🔹 Cross Signals - GOLDEN CROSS / DEATH CROSS with HUGE labels
🔹 POC Reaction - Track price interaction with Point of Control
🔹 Status Panel - All-in-one dashboard with trend, zone, and hints
━━━━━━━━━━━━━━━━━━━━━━━━━━━━━━
📺 THREE DISPLAY MODES
• Impact Mode - Full visual experience with badges, ribbons, and glow effects
• Minimal Mode - Clean SMA lines and VP levels only
• Pro Mode - Complete VP histogram display
━━━━━━━━━━━━━━━━━━━━━━━━━━━━━━
📈 SIGNALS EXPLAINED
▲ GOLDEN CROSS (20×50) - Short-term bullish momentum
▼ DEATH CROSS (20×50) - Short-term bearish momentum
⭐ MAJOR GOLDEN (50×200) - Long-term bull market signal
💥 MAJOR DEATH (50×200) - Long-term bear market signal
Context Badges:
⚡ SUPER BUY/SELL (Score 80+)
🔥 POWER BUY/SELL (Score 70-79)
💪 STRONG BUY/SELL (Score 60-69)
⏸ WAIT (Score <50)
━━━━━━━━━━━━━━━━━━━━━━━━━━━━━━
⏰ RECOMMENDED TIMEFRAMES
✅ 15min - 4H (Best for day trading & swing)
⚠️ 1min-5min (Noisy, use with caution)
━━━━━━━━━━━━━━━━━━━━━━━━━━━━━━
⚠️ DISCLAIMER
This is NOT a buy/sell signal indicator.
It shows market CONTEXT to help your own trading decisions.
Always use proper risk management and combine with your own analysis.
━━━━━━━━━━━━━━━━━━━━━━━━━━━━━━
🏷️ Tags: volume profile, sma, context, trend, neon, dark mode, poc, value area
อินดิเคเตอร์

อินดิเคเตอร์

อินดิเคเตอร์

อินดิเคเตอร์

อินดิเคเตอร์
อินดิเคเตอร์

อินดิเคเตอร์

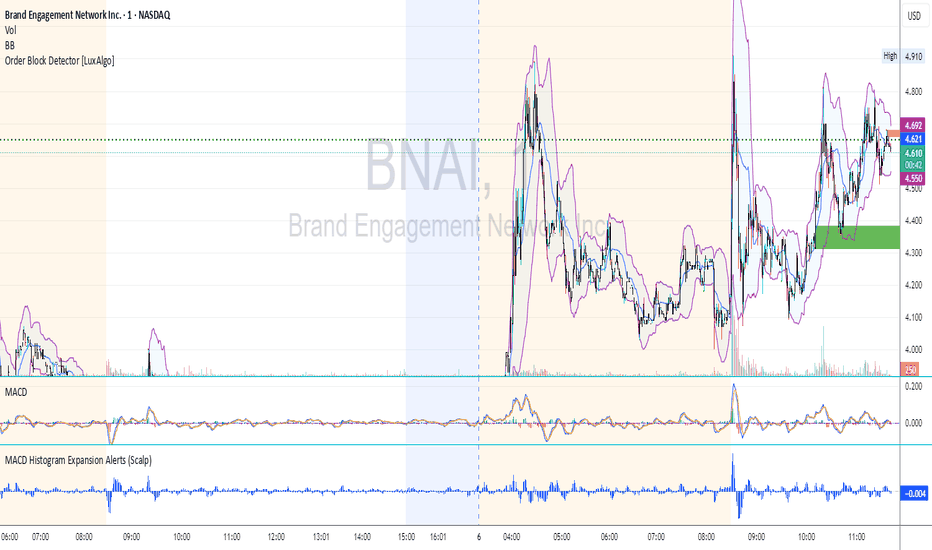
MACD Histogram Expansion Alerts (Scalp)Purpose: Alerts when MACD histogram is expanding (momentum increasing) rather than simply crossing. Designed for 1-minute scalping and intraday momentum confirmation.
This script is for traders who are tired of late MACD cross alerts.
Instead of firing when MACD lines cross (which often happens after the move), this indicator alerts when the MACD histogram is expanding — meaning momentum is actually increasing right now, not rolling over.
I use it as a “heads up” alert, not a buy/sell signal. When it fires, I check price action, volume, VWAP, support/resistance, etc., to see if the move is worth trading.
Best suited for 1-minute charts, scalping, and fast intraday momentum.
MACD Histogram Expansion Alerts (Scalp) is a lightweight alert-focused indicator designed for intraday traders and scalpers, particularly on lower timeframes such as the 1-minute chart.
Rather than triggering alerts on standard MACD line crossovers (which tend to lag in fast or volatile markets), this script detects MACD histogram expansion — a condition that indicates momentum acceleration, not just direction.
🔍 What this script does
Uses a fast MACD configuration suitable for lower timeframes
Monitors the MACD histogram slope and magnitude
Triggers alerts only when the histogram expands for multiple consecutive bars
Alerts are fired on bar close only, reducing noise and false intrabar signals
🚀 Why focus on histogram expansion?
Histogram expansion highlights when momentum is building, which can be useful for:
Continuation setups
Early momentum confirmation
Avoiding entries when momentum is already fading
This approach is especially helpful in small caps, news-driven stocks, and volatile intraday instruments, where traditional MACD cross alerts can arrive too late.
🔔 Alert Types
Bullish MACD Histogram Expansion
Bearish MACD Histogram Expansion
Each alert can be enabled independently and is intended as an attention signal, not a standalone trading system.
⚙️ Customizable Inputs
MACD Fast / Slow / Signal lengths
Number of consecutive expanding histogram bars required
Optional minimum histogram magnitude filter
Optional directional filter (above/below zero line)
⚠️ Important Notes!!!!
This script does not place trades
Alerts should be used with additional context, such as price action, volume, VWAP, or support/resistance
Not designed for higher-timeframe or swing trading use .
If you find this helpful, feel free to adapt it to your own trading style or timeframe. This script is meant to be simple, flexible, and non-opinionated. อินดิเคเตอร์
อินดิเคเตอร์

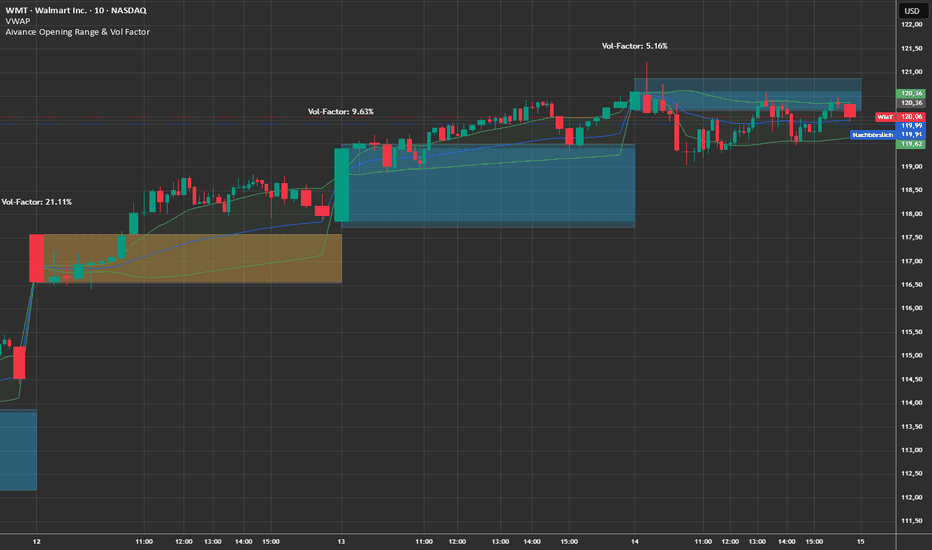
VWAP Pro [Capitalize Labs]VWAP Pro is a volume weighted average price indicator designed to provide structured price context across Session, Weekly, and Monthly anchors. It allows users to define custom session templates and apply multiple band calculation methods to help frame price behavior relative to volume weighted levels.
The indicator supports Session, Week, and Month anchor periods. Session anchoring can be aligned to user defined templates including RTH, ETH, London, New York, Asia, or a fully custom session, all based on the instrument’s exchange time zone. This allows VWAP to reset at meaningful market boundaries rather than fixed calendar times.
VWAP Pro includes three band calculation methods: volume weighted standard deviation, fixed tick distance based on the instrument’s minimum tick size, and ATR based distance. Up to three band levels can be enabled independently, with configurable multipliers and visual settings.
A warm up system is included to manage band behavior immediately after a VWAP reset. Bands can either be hidden during the warm up period and appear at full width once complete, or gradually expand from zero to full width over the defined number of bars. The VWAP line itself always plots immediately.
Optional prior period reference levels are available for the previous Session, Week, and Month VWAP. These levels represent only fully completed periods and do not update during the current active period. Display of these levels depends on sufficient historical data being loaded to cover the full prior period.
The indicator requires valid volume data. Symbols that do not provide volume are not supported. All session definitions and settings should be reviewed and adjusted to match the specific instrument being analyzed.
Risk Warning
This indicator is provided for educational and analytical purposes only and does not constitute financial advice, an investment recommendation, or a solicitation to buy or sell any financial instrument. Trading involves significant risk and market conditions can change rapidly. Losses can exceed expectations and the use of this indicator does not guarantee any specific outcome or performance. You are solely responsible for your trading decisions, risk management, and compliance with applicable regulations. Past market behavior or indicator signals are not reliable indicators of future results. อินดิเคเตอร์

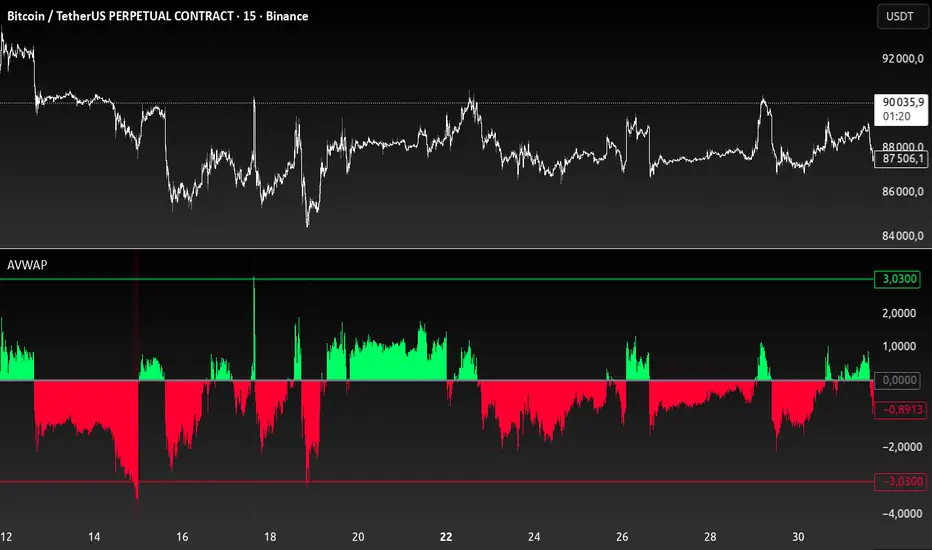
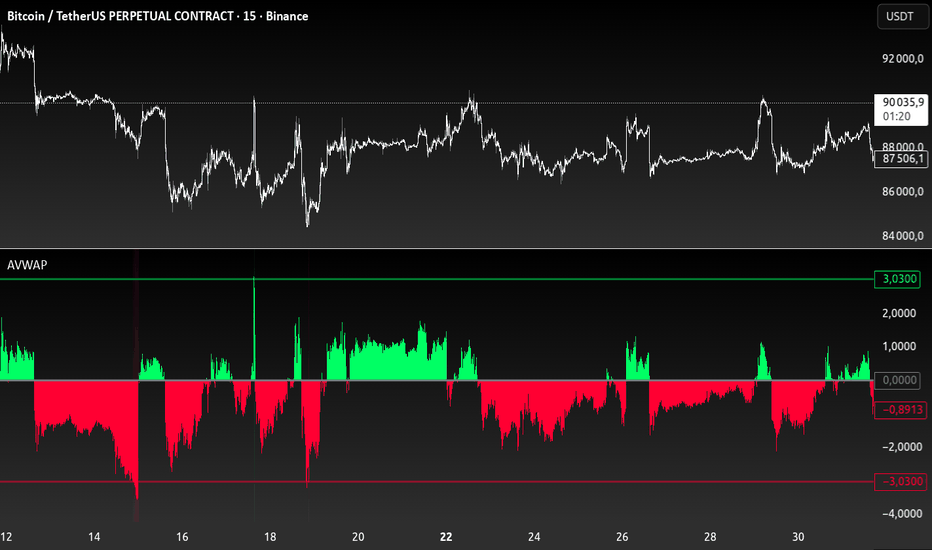
Anchored VWAP PercentageINDICATOR: ANCHORED VWAP PERCENTAGE (AVWAP)
1. Overview
The Anchored VWAP Percentage (AVWAP) is a quantitative momentum and mean-reversion tool. It measures the percentage distance between the current price and a Volume Weighted Average Price (VWAP) that resets automatically based on specific time cycles. It allows traders to identify overextended market conditions relative to institutional value.
---
2. Core Logic & Calculation
The script tracks the relationship between price and volume starting from a specific Anchor Point .
* Volume-Weighted Foundation: Unlike simple moving averages, this indicator uses the VWAP formula: sum(Volume * Price) / sum(Volume) .
* Automatic Anchoring: The starting point (Anchor) resets automatically depending on the chart timeframe (e.g., resets weekly on a 15m chart, or yearly on a Daily chart).
* Percentage Deviation: It calculates the precise gap between the price and the VWAP, plotted as an oscillator: ((Price - VWAP) / VWAP) * 100 .
---
3. Adaptive Intelligence (Multi-Asset & Multi-TF)
The AVWAP is built with an internal database of 85th Percentile (P85) volatility thresholds. It recognizes that different assets have different "stretching" limits:
1. Asset-Specific Calibration: It includes optimized data for Bitcoin, Ethereum, Altcoins, Forex, and Indices .
2. Dynamic Timeframe Mapping: The anchor period and the exhaustion thresholds adjust automatically. For example:
* Intraday (1m-5m): Anchors to an 8-hour (480 min) cycle.
* Mid-Term (15m-60m): Anchors to a Weekly (W) cycle.
* Swing (Daily): Anchors to a Yearly (12M) cycle.
---
4. Visual Anatomy
The indicator is designed for high-speed decision-making:
* The Histogram:
* Green: Price is trading above the VWAP (Bullish premium).
* Red: Price is trading below the VWAP (Bearish discount).
* P85 Threshold Lines:
* These lines represent the 85th percentile of historical deviations . Historically, the price stays within these boundaries 85% of the time.
* Background Highlighting: When the histogram crosses the P85 line, the background glows, signaling a Statistical Exhaustion Zone where a retracement to the mean is highly probable.
---
5. How to Trade with AVWAP
* Mean Reversion: When the histogram reaches the P85 Zone , the price is "statistically overextended." This is a prime area to look for reversals or to take profits on existing trends.
* Trend Strength: If the histogram stays near the Zero Line while the price moves, the trend is supported by healthy volume.
* Value Area: The Zero Line represents the Fair Value . Buying near the Zero Line during a bullish histogram (Green) offers a high-probability entry with low risk.
---
6. Technical Parameters
* Asset Selection: A dropdown to switch between Crypto, Forex, and Indices.
* Color Customization: User-defined colors for bullish and bearish sentiment.
* Precision Control: 4-decimal precision for accurate tracking of thin-margin assets like Forex. อินดิเคเตอร์
อินดิเคเตอร์

อินดิเคเตอร์

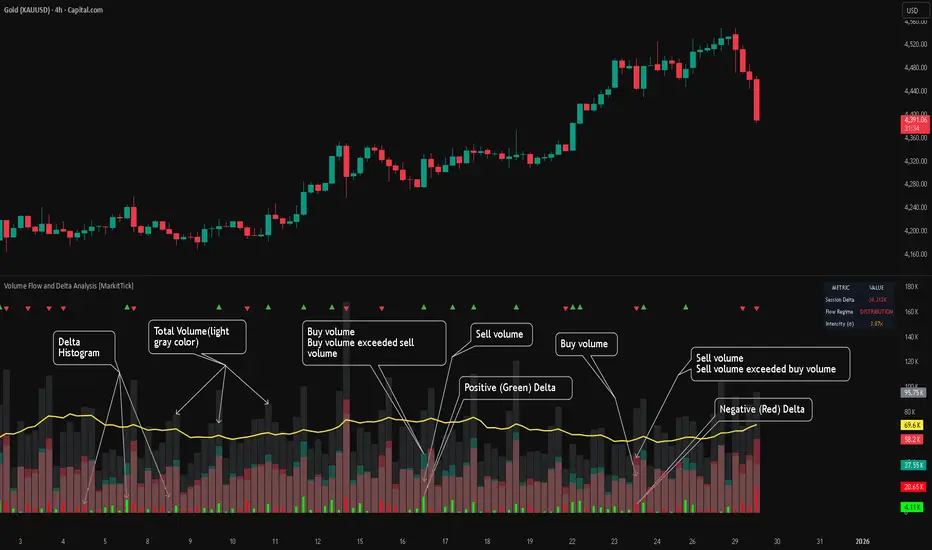
Volume Flow and Delta Analysis [MarkitTick]💡This comprehensive technical indicator is designed for traders who require a granular view of market participation that goes beyond standard volume bars. By leveraging the advanced "Intrabar Analysis" capabilities of Pine Script, this tool deconstructs every single price candle on your chart into its constituent lower-timeframe components. It effectively "X-rays" the market to determine whether the volume inside a bar was primarily driven by aggressive buying or aggressive selling, providing a definitive read on market sentiment and institutional control.
● Originality and Utility
Most standard volume indicators display a simple aggregate total—a single block of volume that fails to distinguish between buying pressure and selling pressure. A high-volume candle could represent a strong breakout, or it could represent a "selling tail" where buyers were absorbed. This script solves that ambiguity. It is not a standard oscillator; it is a quantitative flow analyzer. It reconstructs the "Delta" (the net difference between buying and selling volume) by querying lower-timeframe data (e.g., analyzing 1-minute data inside a 60-minute bar). This allows traders to spot "Hidden Accumulation" (where price is flat but Delta is rising) or "Exhaustion" (where price rises but Delta falls), offering a significant edge in identifying reversals and trend continuations.
● Methodology
The script operates through a sophisticated three-stage quantitative process:
• Intrabar Data Acquisition
The script uses the security_lower_tf function to fetch granular price and volume data from a lower timeframe (automatically detected or user-defined). This allows the script to see what happened "inside" the current chart's bar.
• Directional Flow Distribution
For every lower-timeframe interval, the script assigns volume to either "Bullish Flow" or "Bearish Flow." If the close is higher than the open on the lower timeframe, the volume is credited to buyers. If the close is lower, it is credited to sellers. This logic is far more accurate than simple "Up/Down" tick data, as it respects price action.
• Statistical Volatility Normalization
To filter out noise, the script calculates a dynamic baseline using an Exponential Moving Average (EMA) of the absolute Delta values. It then compares the current bar's Delta against this baseline. This generates an "Intensity Score" (measured in Sigma or Standard Deviations). This ensures that a "High Volume" signal is relevant to the current market volatility, rather than relying on fixed, arbitrary thresholds.
● How to Use
This tool is designed to be a complete decision-support system. Here is how to interpret its various components:
• The Volume Histogram
The background histogram displays Total Volume, while the foreground bars show the split between Buying (Teal) and Selling (Red) flow. Use this to gauge the "quality" of a move. A price rally accompanied by high Teal volume is healthy; a rally on low volume or high Red volume is suspect.
• The Delta Histogram
This plots the net difference.
Strong Positive (Green) Delta: Indicates aggressive market buy orders are hitting the ask.
Strong Negative (Red) Delta: Indicates aggressive market sell orders are hitting the bid.
Divergence: If Price makes a New High but the Delta Histogram makes a Lower High, this is a classic signal of exhaustion and potential reversal.
• The Heads-Up Display (HUD)
A dashboard table pinned to the chart provides real-time metrics:
Session Delta: The cumulative buy/sell pressure for the current trading day.
Flow Regime: Clearly states if the market is in "ACCUMULATION" or "DISTRIBUTION."
Intensity: Shows how statistically significant the current volume is (e.g., "2.5x" means the volume is 2.5 times the standard deviation, indicating an anomaly).
• Visual Signals
The script plots triangle markers on top of the chart when the Delta Intensity exceeds the user-defined threshold.
Up Triangle (Green): Signals strong institutional buying pressure (Delta > Threshold).
Down Triangle (Red): Signals strong institutional selling pressure (Delta < Threshold).
● Inputs and Configuration
Lower Timeframe: By default, the script auto-selects the best resolution (e.g., 1-minute data for hourly charts). Users can override this to fine-tune the granularity.
Volume MA Length: Defines the lookback period for the volume moving average.
Delta Volatility Threshold (Sigma): This is the sensitivity filter for signals. A higher value (e.g., 2.0) results in fewer but more significant signals. A lower value (e.g., 1.0) provides more frequent alerts.
Visual Logic: Users can toggle the Dashboard, Delta Histogram, and Moving Averages on or off to suit their charting aesthetic.
● Disclaimer
All provided scripts and indicators are strictly for educational exploration and must not be interpreted as financial advice or a recommendation to execute trades. I expressly disclaim all liability for any financial losses or damages that may result, directly or indirectly, from the reliance on or application of these tools. Market participation carries inherent risk where past performance never guarantees future returns, leaving all investment decisions and due diligence solely at your own discretion. อินดิเคเตอร์

Volume vs Range Imbalance DetectorDescription :-
Concept :-
This indicator is designed to identify "Effort vs. Result" anomalies in the market using Volume Spread Analysis (VSA) concepts. It highlights specific candles where high trading activity (Volume) is occurring, but the price movement (Range) is restricted. This behavior often signals the presence of heavy absorption by buyers or sellers ("Smart Money" activity) before a potential reversal or continuation.
How It Works :-
The script combines two distinct methods of volume analysis into a single view
1. Structural Imbalance (Lime & Red Signals)
This logic detects major market anomalies by comparing the current candle against a 50-period average context.
The Logic: A signal is generated if the Volume is significantly higher than the average (default 1.618x the 50 SMA) AND the Price Range is significantly smaller than the average (default 1.272x the 50 ATR).
Lime Candle/Dot (Bullish Absorption): Massive volume with small range, closing in the upper 50% of the bar. This suggests sellers are dumping, but buyers are absorbing all orders, preventing the price from dropping.
Red Candle/Dot (Bearish Blockade): Massive volume with small range, closing in the lower 50% of the bar. This suggests buyers are pushing, but sellers are absorbing the demand, preventing the price from rising.
2. Hidden Activity (Orange Signals)
This logic is more sensitive and compares the current candle only to the previous candle.
The Logic: A signal is generated if the current Volume is higher than the previous bar's volume, but the current Range is smaller than the previous bar's range.
Orange Candle/Dot: This indicates "Churn." Effort is increasing, but the result (movement) is decreasing. It is often an early warning sign of congestion or a pending breakout.
Visual Guide
Lime Dot (Below Bar): Strong Buying Pressure (Bullish Imbalance).
Red Dot (Above Bar): Strong Selling Pressure (Bearish Imbalance).
Orange Dot (Above Bar): Hidden Activity / Churn (Warning).
Settings
Context Length: The lookback period for the moving averages (Default: 50).
Volume/Range Multipliers: Determine how strict the "Imbalance" signals are. Higher numbers result in fewer, more significant signals.
Show Hidden Activity: Toggle the orange signals on or off.
Disclaimer
This tool is for educational purposes only. Volume analysis is subjective and should be used in conjunction with other form อินดิเคเตอร์

อินดิเคเตอร์

อินดิเคเตอร์

อินดิเคเตอร์

อินดิเคเตอร์

Volume OscillatorDescription
The Volume Oscillator measures the momentum of trading volume by calculating the percentage difference between a fast and a slow Simple Moving Average (SMA) of daily volume. It helps traders identify periods of increasing or decreasing market participation, often signaling potential trend strength or exhaustion.
Key Features:
Adaptive to Trading Session:
Automatically adjusts SMA periods based on the actual trading session length (default: 8.5 hours for FTSEMIB, customizable for any market — e.g., 6.5h for US stocks, 24h for crypto).
Fast & Slow SMAs:
Compares a short-term SMA (default 10 days) with a longer-term SMA (default 25 days) of volume.
Oscillator Formula:
100 × (Fast SMA / Slow SMA - 1)
→ Positive values = increasing volume momentum (bullish)
→ Negative values = decreasing volume momentum (bearish)
Signal Line (optional):
A moving average of the oscillator (default 7 days) for smoother trend identification and crossover signals.
Overbought/Oversold Levels:
User-defined horizontal lines (default +40 / -40) to highlight extreme volume conditions.
Customizable Colors:
Change the oscillator and signal line colors to match your chart style.
How to Interpret:
Bullish Conditions:
Oscillator crosses above the zero line
Oscillator crosses above the signal line
Readings near or above +40 may indicate strong buying pressure (watch for possible exhaustion if too extreme)
Bearish Conditions:
Oscillator crosses below the zero line
Oscillator crosses below the signal line
Readings near or below -40 may indicate selling pressure or capitulation
Divergences:
Look for divergences between price and the Volume Oscillator (e.g., price makes new highs but oscillator fails to confirm with higher highs) — a classic sign of weakening momentum.
Best Use Cases:
Indices (FTSEMIB, DAX, CAC, SPX, etc.), stocks and futures with defined trading hours, crypto (set session duration to 24 hours).
Works well on intraday (e.g., 15m, 30m, 1h) and daily charts.
Customization Tips:
- Shorten fast/slow lengths for faster signals (more noise)
- Lengthen them for smoother, longer-term analysis
- Adjust session duration for non-standard market hours
- Enable/disable the signal line in the settings
Note: Volume data quality can vary by symbol and exchange. Always combine this indicator with price action and other tools. Use proper risk management.
อินดิเคเตอร์

Volume ROC (smoothed)Description
The Volume ROC (Rate of Change) indicator is designed to measure the momentum of trading volume over a user-defined period, adjusted for the trading session length of the symbol (e.g., 8.5 hours for the FTSEMIB index). This makes it particularly useful for intraday charts where standard daily calculations might not align with actual trading days.
By focusing on volume changes rather than price, it helps identify potential shifts in market participation, such as accumulation, distribution, or unusual activity that could precede price movements.
How It Works:
Session Adjustment:
The indicator calculates the number of candles per trading day based on the input session duration (in hours) and the chart's timeframe. This ensures that the ROC and other calculations are based on "trading days" rather than calendar days, making it adaptable to markets with non-standard hours like European indices (e.g., FTSEMIB).
Daily Data Fetch:
It retrieves daily high, low, close, and volume data using "request.security" to ensure consistency across timeframes.
ROC Calculation:
The Rate of Change (ROC) is computed on volume using "ta.change" over the specified length (in days), multiplied by the candles-per-day factor for timeframe independence. By chosing the subtraction method instead of the division method we avoid distortions of the ROC below the zero line (method ok for timespans inferior to two years).
Smoothing with SMA:
A Simple Moving Average (SMA) is applied to the ROC to reduce noise and highlight trends in volume momentum.
Standard Deviation Bands:
The standard deviation of the smoothed ROC is calculated over a lookback period. Bands are plotted at +2σ (overbought) and -2σ (oversold) to provide context for extreme volume changes, similar to Bollinger Bands but applied to volume ROC.
Key Plots:
SMA Line (Orange): The smoothed ROC value. Positive values indicate increasing volume momentum; negative values suggest decreasing momentum.
Zero Line (Black Dotted): A reference line at 0, separating positive and negative ROC territories.
+2σ Band (Red Dotted): Upper overbought threshold. Crossings above this may signal excessive buying volume.
-2σ Band (Green Dotted): Lower oversold threshold. Dips below this could indicate capitulation or low interest.
Usage and Interpretation:
Trend Confirmation:
Use the SMA crossing above/below zero to confirm price trends with volume backing. For example, a rising price with positive Volume ROC suggests strong conviction.
Divergences:
Look for divergences between price and Volume ROC (e.g., price making new highs but ROC weakening), which can signal reversals.
Overbought/Oversold Signals:
The ±2σ bands act as dynamic levels. Volume ROC spiking above +2σ might precede pullbacks, while below -2σ could indicate buying opportunities.
Best Applied To:
European indices (like FTSEMIB or DAX), stocks, or futures with defined session hours. Test on intraday (e.g., 2h) and combine with price-based indicators like RSI or MACD for confluence.
Customization:
Adjust the ROC/SMA lengths for sensitivity (shorter for scalping, longer for swings). The STDEV lookback affects band width—longer periods create smoother bands.
Limitations:
Volume data can be noisy in low-liquidity symbols. This indicator assumes consistent session lengths; irregular holidays may affect accuracy. Always backtest and use with risk management.
This indicator is original and built for educational/trading purposes.
อินดิเคเตอร์

อินดิเคเตอร์

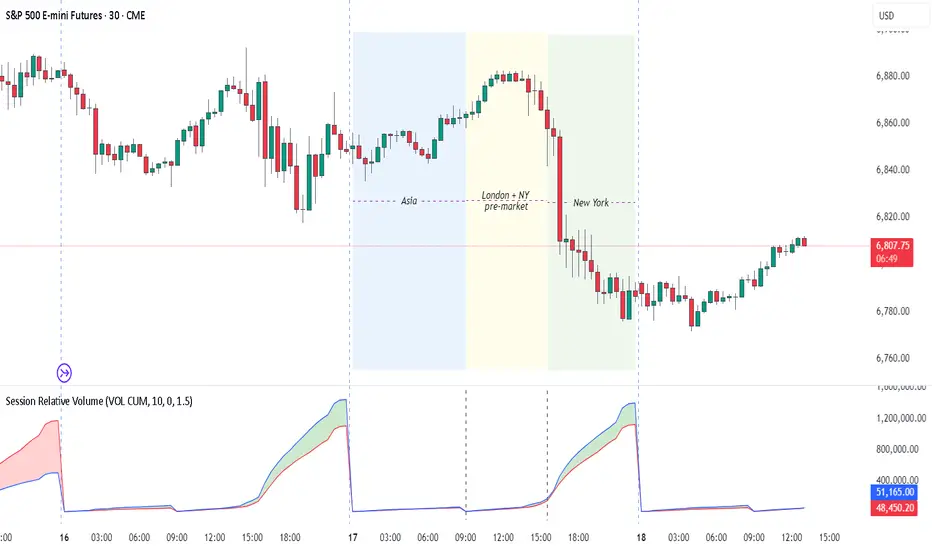
Session Relative VolumeSession Relative Volume is an advanced intraday futures volume indicator that analyzes volume separately for Asia, London, and New York sessions - something standard relative volume tools can’t do.
Instead of aggregating the entire day’s volume, the indicator compares current volume to historical averages for the same session and time of day, allowing you to spot true volume strength and meaningful spikes, especially around session opens.
Background
Relative volume helps traders spot unusual activity: high volume often signals institutional participation and trending days, while low volume suggests weak commitment and possible mean reversion. In futures markets, sessions ( Asia, London, New York ) must be analyzed separately, but TradingView’s Relative Volume in Time aggregates the entire day, masking session-specific behavior - especially during the New York open. Since volume can vary by more than 20× between sessions, standard averages struggle to identify meaningful volume spikes when trader conviction matters most.
Indicator Description
The “Session Relative Volume” indicator solves these problems by calculating historical average volume specific to each session and time of day, and comparing current volume against those benchmarks. It offers four display modes and fully customizable session times
Altogether, it provides traders with a powerful tool for analyzing intraday futures volume, helping to better assess market participation, trader conviction, and overall market conditions - ultimately supporting improved trading decisions.
Parameters
Mode – display mode:
R-VOL: Relative cumulative session-specific volume at time
VOL CUM: Cumulative session volume at time compared to historical average cumulative session-specific volume
VOL AVG: Average session intrabar volume at time compared to historical average session-specific intrabar volume
VOL: Individual bars volume, highlighting (solid color) unusual spikes
Lookback period – number of days used for calculating historical average session volume at time
MA Len – length of the moving average, representing average bar volume within a session based on previous periods (different from historical cumulative volume!). Used only in VOL and VOL AVG modes
MA Thresh – deviation from moving average, used to detect bar volume spikes (bar volume > K × moving average)
Start Time – End Time and Time Zone parameters for each session. The time zone must be set using TradingView’s format (e.g., GMT+1).
อินดิเคเตอร์